Uveitis Treatment Market | Acumen Research and Consulting
Uveitis Treatment Market Size - Global Industry, Share, Analysis, Trends and Forecast 2024 - 2032
Published :
Report ID:
Pages :
Format : 
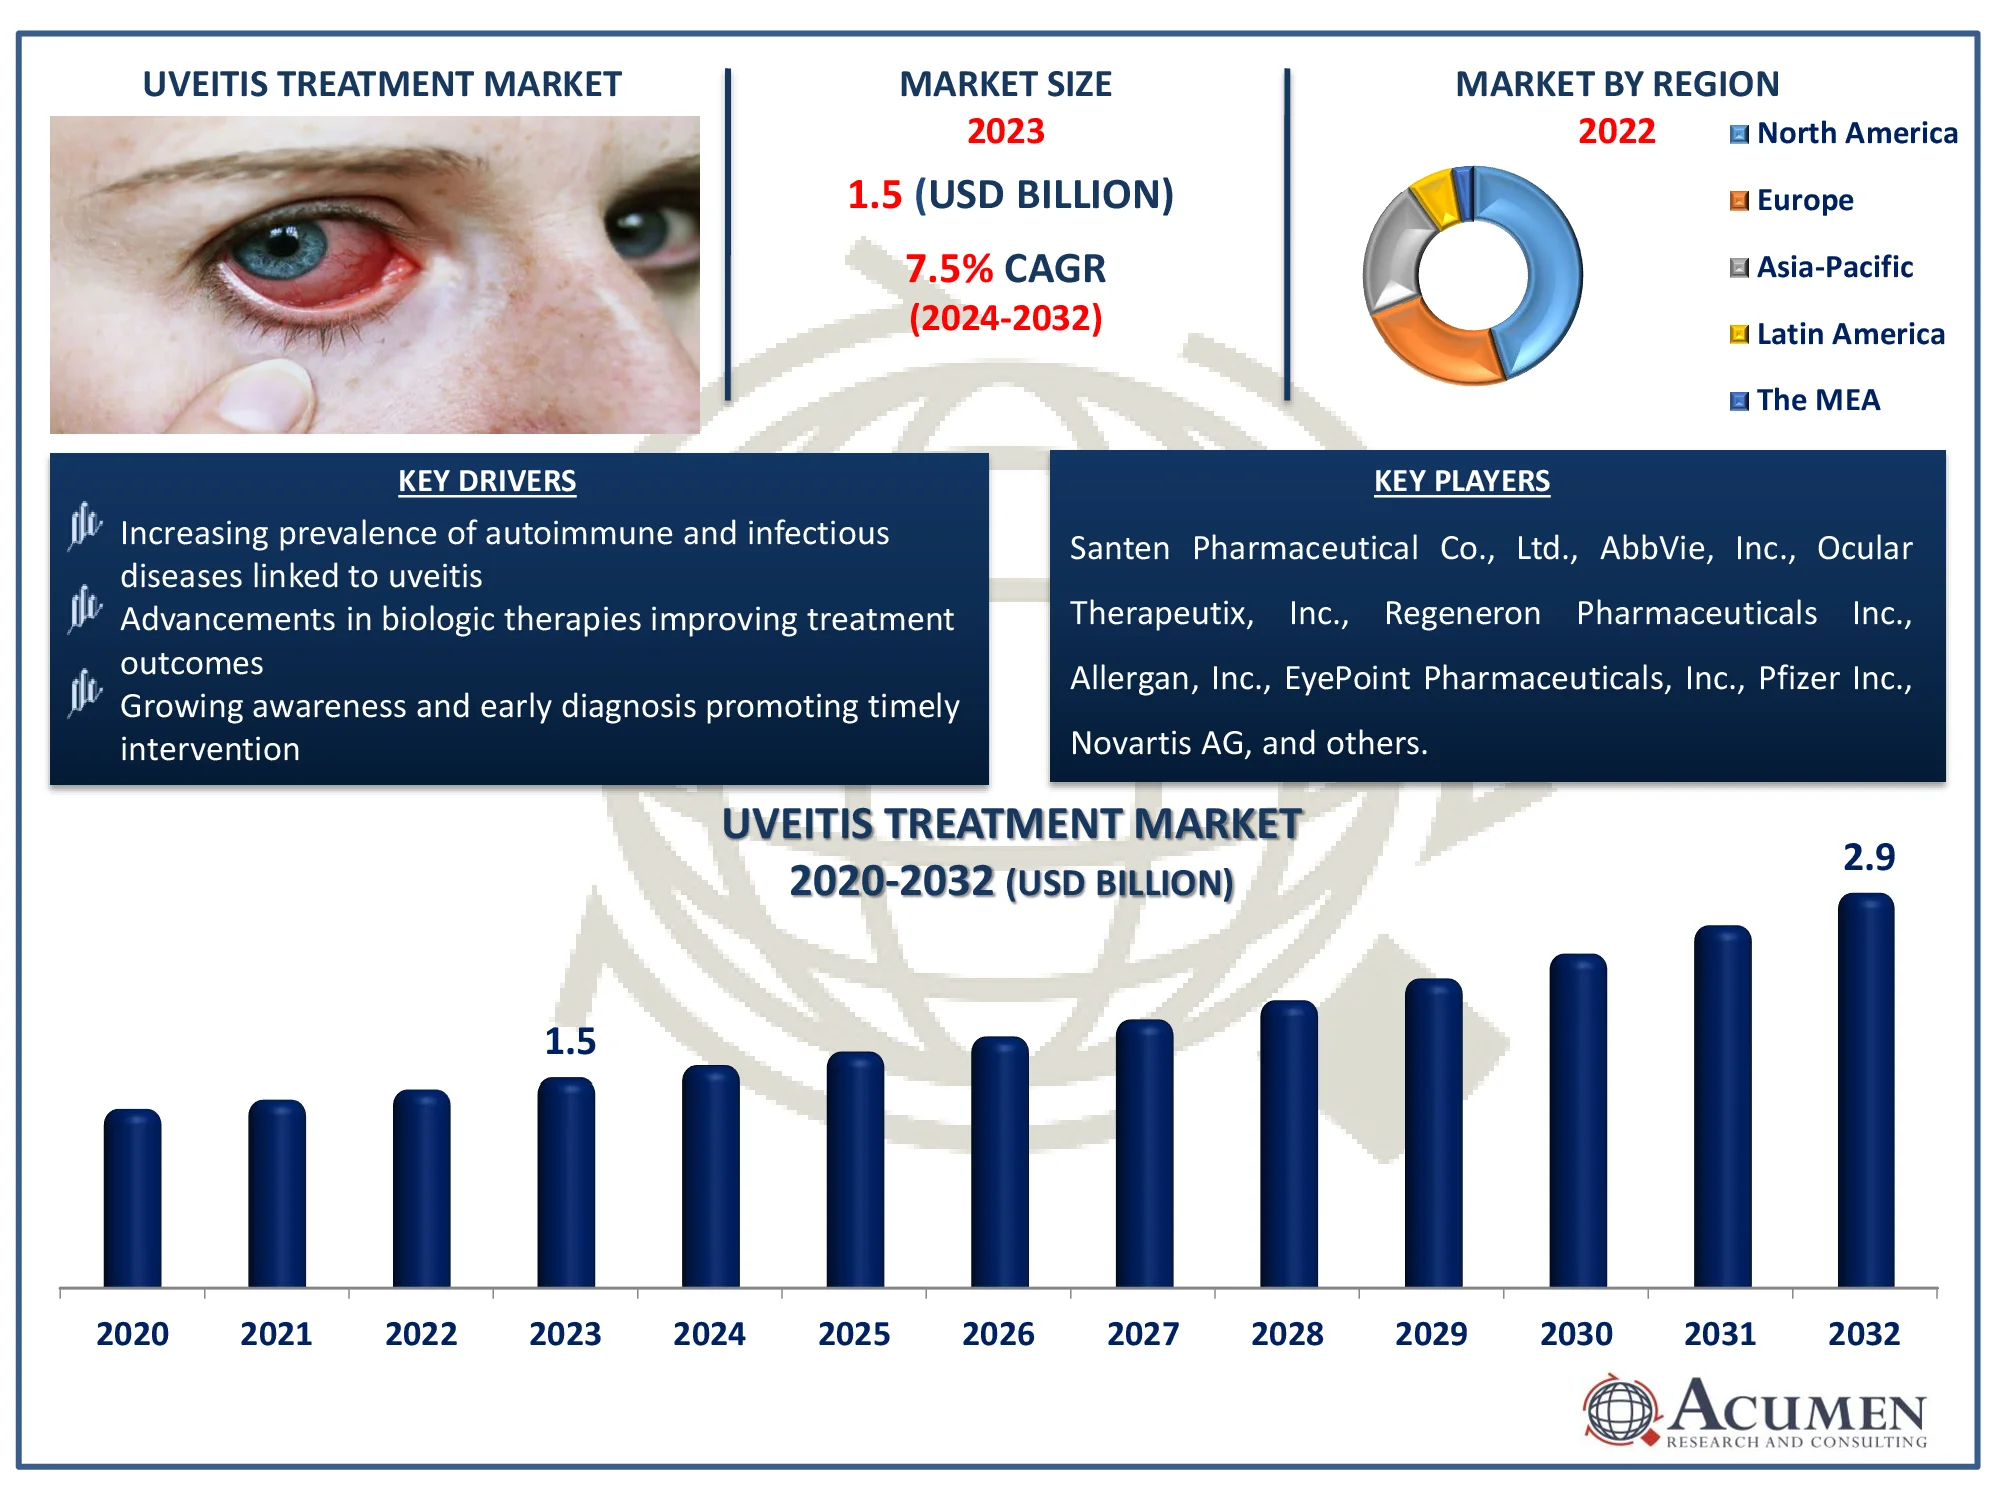
The Global Uveitis Treatment Market Size accounted for USD 1.5 Billion in 2023 and is estimated to achieve a market size of USD 2.9 Billion by 2032 growing at a CAGR of 7.5% from 2024 to 2032.
Uveitis Treatment Market Highlights
- The global uveitis treatment market is expected to reach USD 2.9 billion by 2032, growing at a CAGR of 7.5% from 2024 to 2032
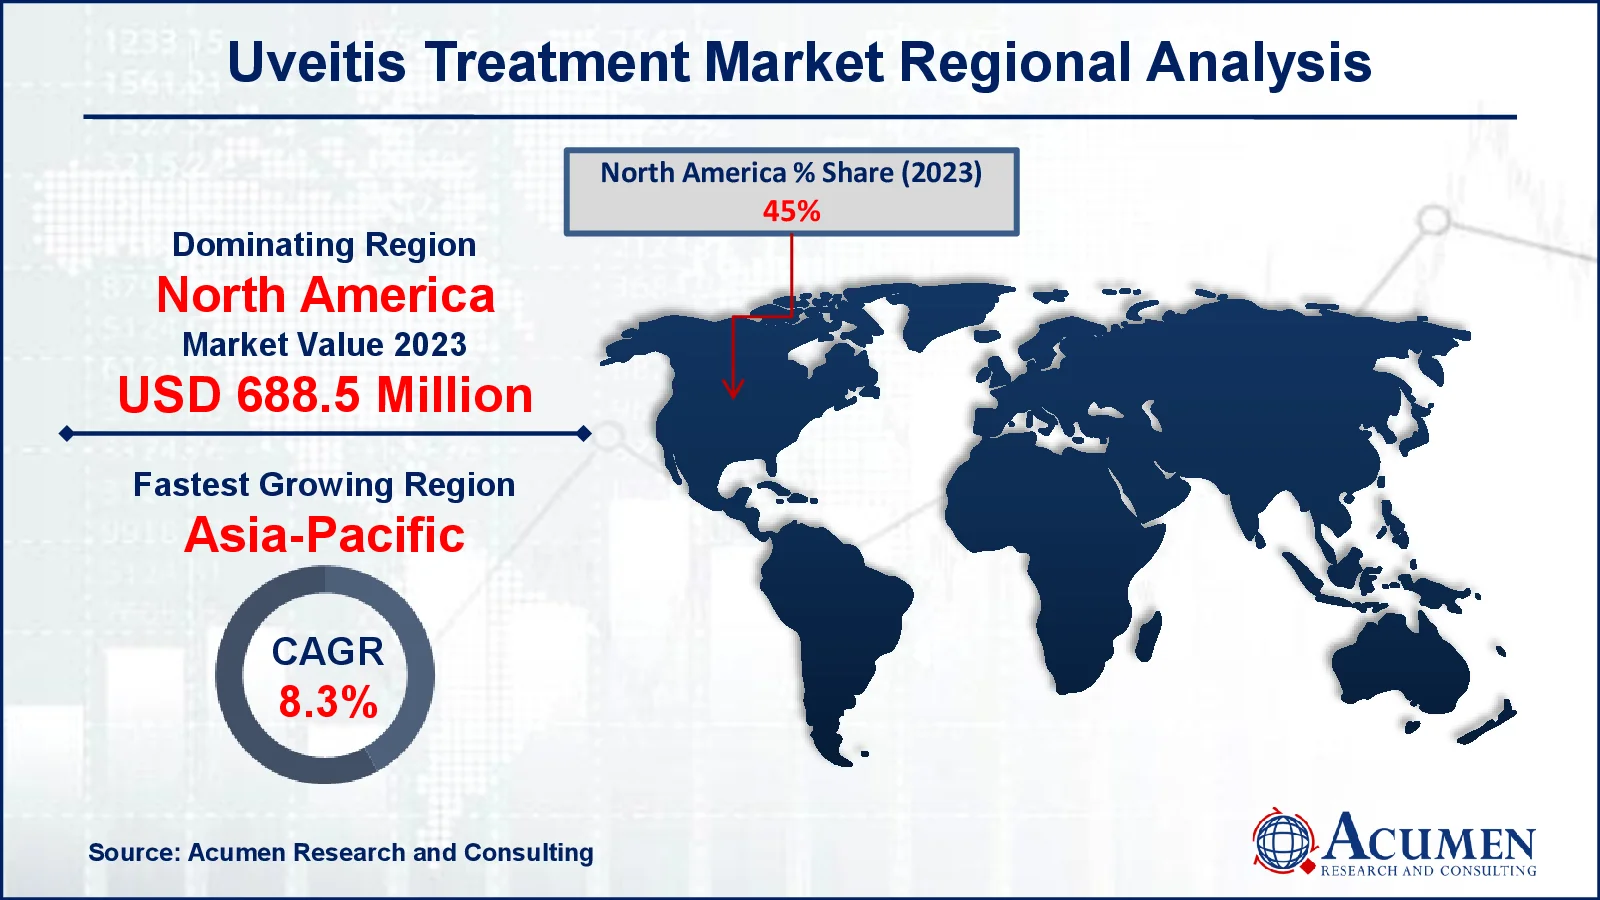
- In 2023, the North American uveitis treatment market was valued at approximately USD 688.5 million
- The Asia-Pacific uveitis treatment market is projected to grow at a CAGR of over 8.3% from 2024 to 2032
- Corticosteroids accounted for 25% of the uveitis treatment market share in 2023 based on treatment type
- Anterior uveitis held a 47% market share in 2023 based on disease type
- The infectious segment dominated the market in 2023, contributing 82% of the share based on cause
- Retail distribution channels generated 41% of the market share in 2023 based on distribution channel
- Advances in genomics and biomarkers are enabling personalized treatment approaches for uveitis patients is the uveitis treatment market trend that fuels the industry demand

Uveitis treatment focuses on reducing inflammation of the uvea, the eye's central layer, which can be caused by infections, autoimmune disorders, or trauma. The goal is to minimize inflammation, relieve pain, prevent vision loss, and treat the underlying cause. Corticosteroids (topical, oral, or injectable) are commonly used to manage inflammation, as well as immunosuppressive medicines for chronic patients and biologics such as anti-TNF therapies. In some circumstances, antibiotics or antivirals are prescribed to treat infectious diseases. Biologics and gene treatments are examples of advanced therapeutics that target specific pathways. These medications can be used to treat autoimmune uveitis as well as viral and traumatic conditions, improving patient outcomes and maintaining vision.
Global Uveitis Treatment Market Dynamics
Market Drivers
- Increasing prevalence of autoimmune and infectious diseases linked to uveitis
- Advancements in biologic therapies improving treatment outcomes
- Growing awareness and early diagnosis promoting timely intervention
Market Restraints
- High cost of advanced biologics and immunosuppressive therapies
- Adverse side effects of long-term corticosteroid use
- Shortage of skilled ophthalmologists in certain regions
Market Opportunities
- Development of novel biologics and gene therapies
- Expansion in emerging markets with improving healthcare infrastructure
- Personalized medicine enabling tailored uveitis treatments
Uveitis Treatment Market Report Coverage
| Market | Uveitis Treatment Market |
| Uveitis Treatment Market Size 2022 |
USD 1.5 Billion |
| Uveitis Treatment Market Forecast 2032 | USD 2.9 Billion |
| Uveitis Treatment Market CAGR During 2023 - 2032 | 7.5% |
| Uveitis Treatment Market Analysis Period | 2020 - 2032 |
| Uveitis Treatment Market Base Year |
2022 |
| Uveitis Treatment Market Forecast Data | 2023 - 2032 |
| Segments Covered | By Type, By Disease Type, By Cause, By Distribution Channel, And By Geography |
| Regional Scope | North America, Europe, Asia Pacific, Latin America, and Middle East & Africa |
| Key Companies Profiled | Santen Pharmaceutical Co., Ltd., AbbVie, Inc., Ocular Therapeutix, Inc., Regeneron Pharmaceuticals Inc., Allergan, Inc., EyePoint Pharmaceuticals, Inc., Pfizer Inc., Novartis AG, Bausch & Lomb, Inc., and Eyegate Pharmaceuticals, Inc. |
| Report Coverage |
Market Trends, Drivers, Restraints, Competitive Analysis, Player Profiling, Covid-19 Analysis, Regulation Analysis |
Uveitis Treatment Market Insights
The key driving force for development is an increase in uveitis incidence. According to The College of Optometrists, anterior uveitis affects 12 out of 100,000 people each year. According to a survey of medical records from Californian towns, uveitis causes 30.000 new cases of blindness per year, accounting for approximately 10% of all blind patients. Increased research and development efforts in the ophthalmological industry have also contributed to market expansion. Globally, more clinical research is being conducted to treat eye inflammation. Many novel stage III clinical studies for refractory post- or intermediate uveitis are being developed. For example, phase III is being studied as the standard Corticasteroid therapy for non-infectious upper, intermediate, and panuveitis cases to determine the efficacy of mycophenolate mofetil and methotrexate.
Another important aspect that contributes to effective treatment of eye inflammation disorders is increased R&D effort for biological medications. The demand for these treatments is expected to drive market growth. Uveitis with infectious etiologies becomes more common as the number of infectious disorders rises. In developing countries, it is most common. According to the Indian Journal of Inflammation Research, infection causes around half of all cases of uveitis. Even developing countries are highly susceptible to eye irritation due to viral causes.
The development of innovative biologics and gene therapies presents a tremendous opportunity in the uveitis treatment industry because they provide more targeted, effective, and long-term treatments. Biologics, such as anti-TNF medicines, target the underlying inflammatory pathways, providing better control of chronic and severe cases than standard therapy. Gene treatments have the potential to treat genetic causes of uveitis and provide long-term anti-inflammatory effects. These improvements reduce corticosteroid use while minimizing adverse effects.
Uveitis Treatment Market Segmentation
The worldwide market for uveitis treatment is split based on type, disease type, cause, distribution channel, and geography.
Uveitis Treatment Type
- Monoclonal Antibodies
- Cycloplegic Agents
- Corticosteroids
- Immunosuppressant
- Antibiotics
- Antifungal
- Antivirals
- Analgesics
According to the uveitis treatment industry analysis, corticosteroids had the largest market share in 2023 since they are the primary treatment for people with noninfectious uveitis. Corticosteroid medications are particularly effective at reducing inflammation. The Food and Drug Administration (FDA) has approved several types of corticosteroid eye drops for the market. Ophthalmologists frequently recommend eye drops, oral medications, and corticosteroid injections. Corticosteroid implants are also becoming increasingly useful in treating chronic inflammatory eye diseases. Bausch+Lomb created Retisert, the first FDA-approved operational corticosteroid implant for the treatment of non-infective post-UV uveitis, in the United States. Because of the rapid rise of biologic drugs, monoclonal antibodies are likely to have a profitable CAGR throughout the projection period. Infliximab, Interferon, Daclizumab, Efalizumab, Alefacept, and Etanercept are among the most commonly-used biologic medications.
Uveitis Treatment Disease Type
- Intermediate Uveitis
- Posterior Uveitis
- Anterior Uveitis
- Panuveitis
According to the uveitis treatment industry analysis, anterior uveitis dominated the market in 2023 because adults and young people had a higher incidence of the illness. More research into this subject reveals that this type of sickness is getting older. Untreated uveitis increases the risk of visual loss, cataracts, glaucoma, and retinal oedema. Later uveitis, caused by the use of numerous medicines, is expected to exhibit profitable progress during the study period. Trivaris, for example, is Allergan's preventive corticosteroid. The uveitis treatment market is expected to be hampered by poor penetration of topical corticosteroids into the back of the eye. Median uveitis is projected to progress significantly over the forecast period, as it aids in the prevention of permanent structural damage to key eye tissue. Furthermore, the rising prevalence of several infectious diseases such as leprosy, Lyme disease, tuberculosis, syphilis, toxicaria, and whipple disease is expected to cause to an increase in cases of uveitis.
Uveitis Treatment Cause
- Noninfectious
- Infectious
According to the uveitis treatment market forecast, infectious causes dominate the market, accounting for 82% of the total in 2023. This dominance stems from the high incidence of illnesses such as toxoplasmosis, herpes viruses, and tuberculosis, all of which contribute significantly to uveitis cases worldwide. Early detection and treatment of infectious uveitis are crucial to avoiding complications, including vision loss. As a result, tailored medicines are in high demand, boosting market expansion.
Uveitis Treatment Distribution Channel
- Retail
- Hospital
- Online
- Others
According to the uveitis treatment market forecast, the retail distribution channel dominates market, accounting for 41% of the total in 2023. This dominance stems from the broad availability of drugs such as corticosteroids, immunosuppressant’s, and biologics at retail pharmacies, making treatment more accessible to patients. Retail pharmacies provide convenience and are the preferred location for filling prescriptions and obtaining over-the-counter medications. Additionally, rising retail chains and online pharmacy platforms have accelerated the rise of this segment.
Uveitis Treatment Market Regional Outlook
North America
- U.S.
- Canada
Europe
- U.K.
- Germany
- France
- Spain
- Rest of Europe
Asia-Pacific
- India
- Japan
- China
- Australia
- South Korea
- Rest of Asia-Pacific
Latin America
- Brazil
- Mexico
- Rest of Latin America
The Middle East & Africa
- South Africa
- GCC Countries
- Rest of the Middle East & Africa (ME&A)

Uveitis Treatment Market Regional Analysis
For several reasons, due to the rising prevalence of non-infectious uveitis in the United States, North America dominated the market in 2023. Furthermore, the encouragement of regional development is attributed to advanced healthcare equipment and favorable refund policies. Many medications are commercially available in the United States, which increases demand. For instance, Bausch + Lomb and Clearside Biomedical announced in October 2021 that the US Food and Drug Administration (FDA) has authorized XIPERE (triamcinolone acetonide). XIPERE is an injectable suspension that is delivered via a suprachoroidal route to treat macular edema caused by uveitis.
Asia-Pacific, on the other hand, is predicted to grow at a lucrative CAGR 8.3% over the forecast period, owing to the rising prevalence and lack of sanitation for infectious diseases in emerging countries. Increased understanding of the many treatment choices has resulted in elevated regional development
In 2023, Europe generated significant growth due to increased R&D investments and healthcare spending. The growing aged population is also a major driver of regional growth.
Uveitis Treatment Market Players
Some of the top uveitis treatment companies offered in our report include Santen Pharmaceutical Co., Ltd., AbbVie, Inc., Ocular Therapeutix, Inc., Regeneron Pharmaceuticals Inc., Allergan, Inc., EyePoint Pharmaceuticals, Inc., Pfizer Inc., Novartis AG, Bausch & Lomb, Inc., and Eyegate Pharmaceuticals, Inc.
Frequently Asked Questions
How big is the uveitis treatment market?
The uveitis treatment market size was valued at USD 1.5 billion in 2023.
What is the CAGR of the global uveitis treatment market from 2024 to 2032?
The CAGR of uveitis treatment is 7.5% during the analysis period of 2024 to 2032.
Which are the key players in the uveitis treatment market?
The key players operating in the global market are including Santen Pharmaceutical Co., Ltd., AbbVie, Inc., Ocular Therapeutix, Inc., Regeneron Pharmaceuticals Inc., Allergan, Inc., EyePoint Pharmaceuticals, Inc., Pfizer Inc., Novartis AG, Bausch & Lomb, Inc., and Eyegate Pharmaceuticals, Inc.
Which region dominated the global uveitis treatment market share?
North America held the dominating position in uveitis treatment industry during the analysis period of 2024 to 2032.
Which region registered fastest CAGR from 2024 to 2032?
Asia-Pacific region exhibited fastest growing CAGR for market of uveitis treatment during the analysis period of 2024 to 2032.
What are the current trends and dynamics in the global uveitis treatment industry?
The current trends and dynamics in the uveitis treatment industry include increasing prevalence of autoimmune and infectious diseases linked to uveitis, advancements in biologic therapies improving treatment outcomes, and growing awareness and early diagnosis promoting timely intervention.
Which treatment type held the maximum share in 2023?
The corticosteroids treatment type held the maximum share of the uveitis treatment industry.
Select Licence Type
Connect with our sales team
Why Acumen Research And Consulting
100%
Customer Satisfaction
24x7
Availability - we are always there when you need us
200+
Fortune 50 Companies trust Acumen Research and Consulting
80%
of our reports are exclusive and first in the industry
100%
more data and analysis
1000+
reports published till date


