Plastic Compounding Market | Acumen Research and Consulting
Plastic Compounding Market Size - Global Industry, Share, Analysis, Trends and Forecast 2024 - 2032
Published :
Report ID:
Pages :
Format : ![]()
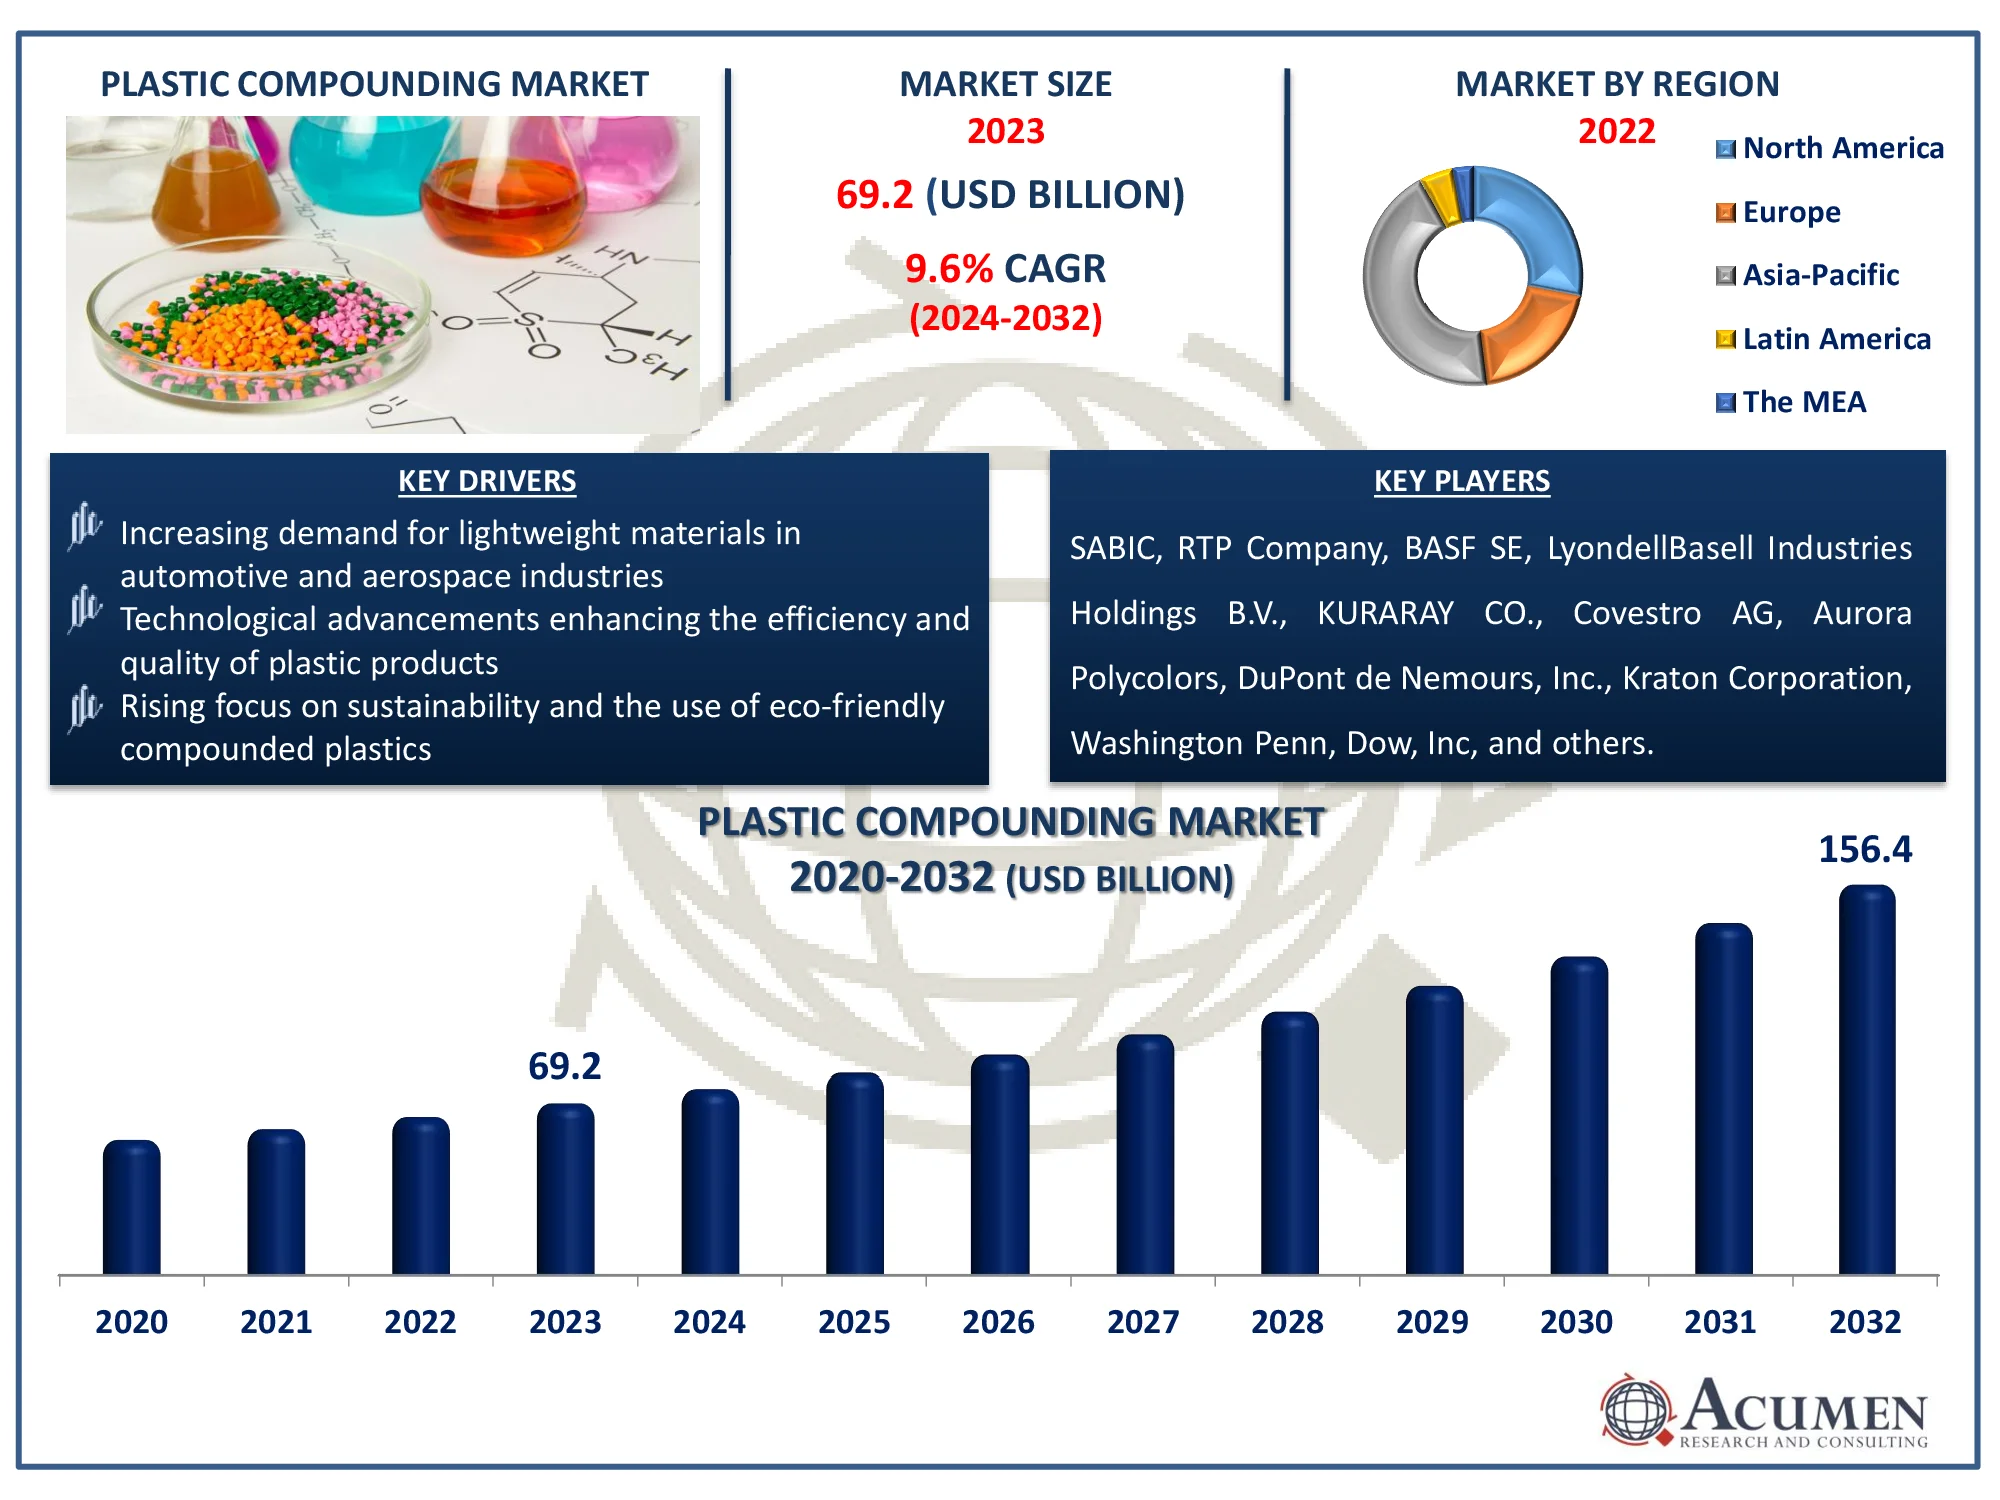
The Global Plastic Compounding Market Size accounted for USD 69.2 Billion in 2023 and is estimated to achieve a market size of USD 156.4 Billion by 2032 growing at a CAGR of 9.6% from 2024 to 2032.
Plastic Compounding Market Highlights
- The global plastic compounding market is forecasted to reach USD 156.4 billion by 2032, with a CAGR of 9.6% between 2024 and 2032
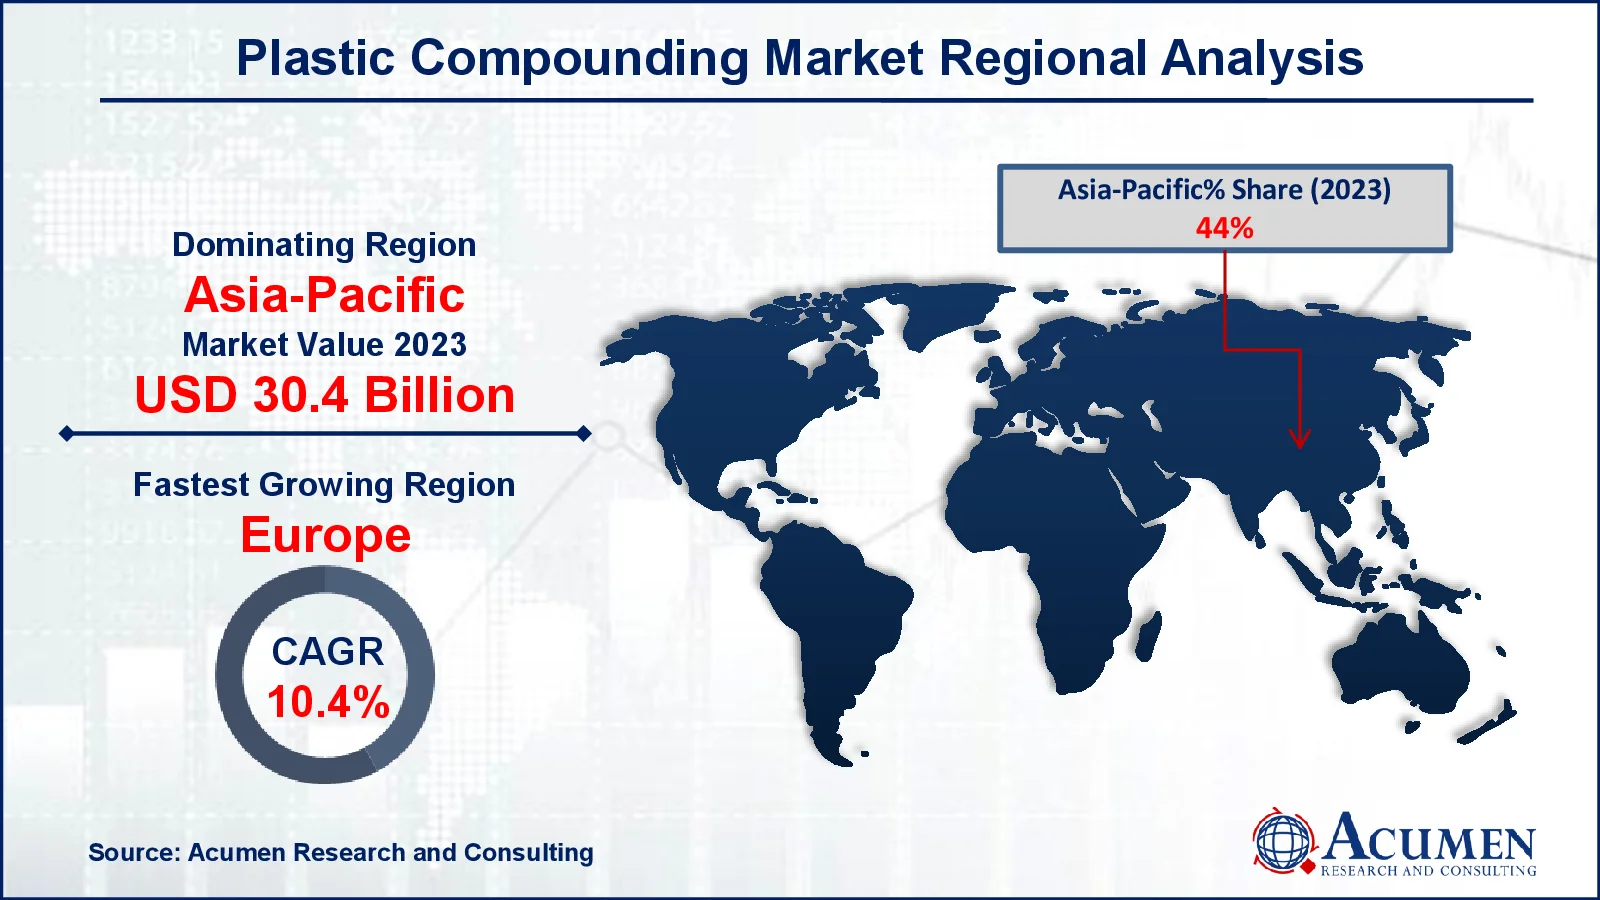
- In 2023, the Asia-Pacific plastic compounding market was valued at approximately USD 30.4 billion
- Europe is anticipated to grow at a CAGR of over 10.4% from 2024 to 2032
- Fossil-based sources represented 56% of the market share in 2023
- The polypropylene (PP) product segment accounted for 29% of the market share in 2023
- Automotive applications captured 26% of the total plastic compounding market in 2023
- Innovative compounding technologies improving material properties and processing efficiency is the plastic compounding market trend that fuels the industry demand

Plastic compounding is an effective procedure for producing plastic formulations by combining additives and polymers in a molten state, which is often done via extrusion. This procedure transforms the features of basic polymers to generate plastic formulations by improving their attributes. The plastic compounding process yields a mixture of polymers and additives. Plastic compounds have outstanding physical features such as a wide range of conductivity, flame retardancy, wear resistance, and light weight. Because of these features, demand for plastic compounds is increasing in a variety of industrial verticals, including building and construction, packaging, and electrical and electronics.
Global Plastic Compounding Market Dynamics
Market Drivers
- Increasing demand for lightweight materials in automotive and aerospace industries
- Technological advancements enhancing the efficiency and quality of plastic products
- Rising focus on sustainability and the use of eco-friendly compounded plastics
Market Restraints
- Fluctuating raw material prices impacting production costs and profitability
- Strict regulations regarding plastic usage and environmental concerns
- Competition from alternative materials, such as metals and composites
Market Opportunities
- Growth in developing regions due to increasing industrialization and urbanization
- Expanding application areas in healthcare, electronics, and construction
- Rising demand for customized and specialty compounds tailored to specific needs
Plastic Compounding Market Report Coverage
| Market | Plastic Compounding Market |
| Plastic Compounding Market Size 2022 |
USD 69.2 Billion |
| Plastic Compounding Market Forecast 2032 | USD 156.4 Billion |
| Plastic Compounding Market CAGR During 2023 - 2032 | 9.6% |
| Plastic Compounding Market Analysis Period | 2020 - 2032 |
| Plastic Compounding Market Base Year |
2022 |
| Plastic Compounding Market Forecast Data | 2023 - 2032 |
| Segments Covered | By Source, By Product, By Application, And By Geography |
| Regional Scope | North America, Europe, Asia Pacific, Latin America, and Middle East & Africa |
| Key Companies Profiled | SABIC, RTP Company, BASF SE, LyondellBasell Industries Holdings B.V., KURARAY CO., Covestro AG, Dow, Inc, Aurora Polycolors, DuPont de Nemours, Inc., Kraton Corporation, Washington Penn, and Asahi Kasei Corporation. |
| Report Coverage |
Market Trends, Drivers, Restraints, Competitive Analysis, Player Profiling, Covid-19 Analysis, Regulation Analysis |
Plastic Compounding Market Insights
The global plastic compounding market is growing due to the wide demand for thermoplastic plastic goods now in its growth stage of the industry life cycle. However, the market is likely to reach saturation during the projection period as a result of restrictions on the use of plastic products due to increased environmental awareness. Furthermore, the expansion of this market is fueled by a diversified product offering, good related features, and increasing demand from a variety of end use sectors. Plastic compounding involves a variety of processes, including additive ratio determination, mixing, and chilling. Thus, depending on the availability of different additives and fillers, the process produces a variety of final compound products.
Furthermore, strong demand from industries such as automotive, electrical & electronics, and construction is driving overall market growth. Plastic compounding materials are widely preferred in the automobile sector for reducing overall vehicle weight and increasing fuel efficiency. The trend for light weight automotive parts is increasing demand for light weight plastic products to meet the requirement for light weight automobile production, hence boosting market growth. These compounded products are widely used in the electrical and electronics industries because of their thermal and electrical conductivity.
Compounding goods contain a high concentration of conductive fillers, resulting in excellent electrical conductivity. Driven by these considerations, the expansion of this market is limited by the high VOC content of plastic compounding products, which is linked to their high pricing. Price-related difficulties are projected to impede the expansion of this industry. Nonetheless, advancements in filler material technology are projected to open up new growth prospects for key companies in the plastic compounding market.
Plastic Compounding Market Segmentation
The worldwide market for plastic compounding is split based on source, product, application, and geography.
Plastic Compounding Sources
- Bio-Based
- Fossil-Based
- Recycled
According to the plastic compounding industry analysis, fossil-based materials, particularly from petroleum, dominate industry due to their ubiquitous availability and low cost. These materials, including as polyethylene and polypropylene, have great mechanical qualities and adaptability, making them indispensable in a variety of industries, including automotive, packaging, and construction. Despite growing environmental concerns, the well-established infrastructure and processing techniques for fossil-based plastics maintain their supremacy.
Plastic Compounding Products
- Polyamide (PA)
- Polyethylene (PE)
- Polyvinyl Chloride (PVC)
- Polypropylene (PP)
- Polyurethane (PU)
- Polymethyl Methacrylate (PMMA)
- Acrylonitrile Butadiene Styrene (ABS)
- Polyethylene Terephthalate (PET)
- Thermoplastic Vulcanizates (TPV)
- Polybutylene Terephthalate (PBT)
- Polystyrene (PS)
- Thermoplastic Polyolefins (TPO)
- Polycarbonate (PC)
- Others
According to the plastic compounding industry analysis, polypropylene is the largest sector among the many polymer kinds. Polypropylene polymer compounds are widely employed in automotive applications due to their related qualities, which make them ideal for this purpose. For instance, according to Plastics Engineering Organization, Polypropylene (PP) has long been a popular material in vehicle manufacturing due to its durability and light weight. In 2023, Braskem, a worldwide biopolymer leader, announced a project to assess the manufacturing of bio-based polypropylene in the United States. Furthermore, growing automotive applications in countries like as China, India, Germany, and Italy are further driving the use of polypropylene plastic compounding products.
Plastic Compounding Applications
- Electrical & Electronics
- Consumer Goods Machinery
- Consumer Goods
- Medical Devices
- Automotive
- Aerospace & Defense
- Building & Construction
- Packaging
- Optical Media
- Others
According to the plastic compounding market forecast, the automotive segment is the largest, among others. The emergence of plastic as a cost-effective and lightweight alternative to melt materials is boosting demand for plastic compounding products in the automotive industry. The automobile industry's strong focus on reducing overall vehicle weight is boosting demand for plastic components, which also helps to improve fuel efficiency. Because of these factors, manufacturers are moving their focus toward the use of plastic compounding goods.
Plastic Compounding Market Regional Outlook
North America
- U.S.
- Canada
Europe
- U.K.
- Germany
- France
- Spain
- Rest of Europe
Asia-Pacific
- India
- Japan
- China
- Australia
- South Korea
- Rest of Asia-Pacific
Latin America
- Brazil
- Mexico
- Rest of Latin America
The Middle East & Africa
- South Africa
- GCC Countries
- Rest of the Middle East & Africa (ME&A)

Plastic Compounding Market Regional Analysis
For several reasons, Asia-Pacific is the largest geographic market for plastic compounding. The area is the greatest manufacturer and consumer due to its enormous consumer base and China's rise as a global manufacturing hub. China is also noted for having the largest automobile manufacturing capacity as well as the largest consumer base in the industry. For instance, according to India Metrological Department (IMD), in 2023, China became the world's largest automotive production sector, with a total output of 30 million vehicles, including global leadership in the manufacture of new energy vehicles (NEVs), producing nearly nine million units during the year, accounting for nearly two out of every three NEVs produced globally. Economic reforms and increased industrialization in nations like as India, Japan, and South Korea are also contributing considerably to regional market growth.
Europe's plastic compounding industry is expanding rapidly, owing to high demand from industries like as automotive, packaging, and electronics. For instance, Brazil's transition to neo industrialization represents a drive toward modernizing its industrial sector with an emphasis on sustainability and innovation. The National Council for Industrial Development (CNDI) unveiled the New Industry Brazil (NIB) policy, which was presented to President Luiz Inácio Lula da Silva. This policy presents a strategy for promoting national growth, with an emphasis on environmentally friendly practices and technological breakthroughs, with targets set until 2033. The region's emphasis on sustainability and severe laws has accelerated the creation of environmentally friendly, recyclable, and bio-based substances. Furthermore, developments in manufacturing technology and increased investment in research and innovation are driving market growth.
Plastic Compounding Market Players
Some of the top plastic compounding companies offered in our report include SABIC, RTP Company, BASF SE, LyondellBasell Industries Holdings B.V., KURARAY CO., Covestro AG, Dow, Inc, Aurora Polycolors, DuPont de Nemours, Inc., Kraton Corporation, Washington Penn, and Asahi Kasei Corporation.
Frequently Asked Questions
How big is the plastic compounding market?
The plastic compounding market size was valued at USD 69.2 Billion in 2023.
What is the CAGR of the global plastic compounding market from 2024 to 2032?
The CAGR of plastic compounding is 9.6% during the analysis period of 2024 to 2032.
Which are the key players in the plastic compounding market?
The key players operating in the global market are including SABIC, RTP Company, BASF SE, LyondellBasell Industries Holdings B.V., KURARAY CO., Covestro AG, Dow, Inc, Aurora Polycolors, DuPont de Nemours, Inc., Kraton Corporation, Washington Penn, and Asahi Kasei Corporation.
Which region dominated the global plastic compounding market share?
Asia-Pacific held the dominating position in plastic compounding industry during the analysis period of 2024 to 2032.
Which region registered fastest CAGR from 2024 to 2032?
Europe region exhibited fastest growing CAGR for market of plastic compounding during the analysis period of 2024 to 2032.
What are the current trends and dynamics in the global plastic compounding industry?
The current trends and dynamics in the plastic compounding industry include increasing demand for lightweight materials in automotive and aerospace industries, technological advancements enhancing the efficiency and quality of plastic products, and rising focus on sustainability and the use of eco-friendly compounded plastics.
Which source held the maximum share in 2023?
The fossil-based source held the maximum share of the plastic compounding industry.


