Medical Plastic Compounds Market Size - Global Industry, Share, Analysis, Trends and Forecast 2024 - 2032
Published :
Report ID:
Pages :
Format :
Medical Plastic Compounds Market Size - Global Industry, Share, Analysis, Trends and Forecast 2024 - 2032
Report Coverage
- Industry Dynamics
- Market Size and Forecast Data
- Segment Analysis
- Competitive Landscape
- Regional Analysis with a Niche Focus on Country-Level Data
- High Level Analysis - Porter's, PESTEL, Value Chain, etc.
- Company Profiles of Key Players
- Option to Customize the Report As Per Your Specific Need
Request Sample Report
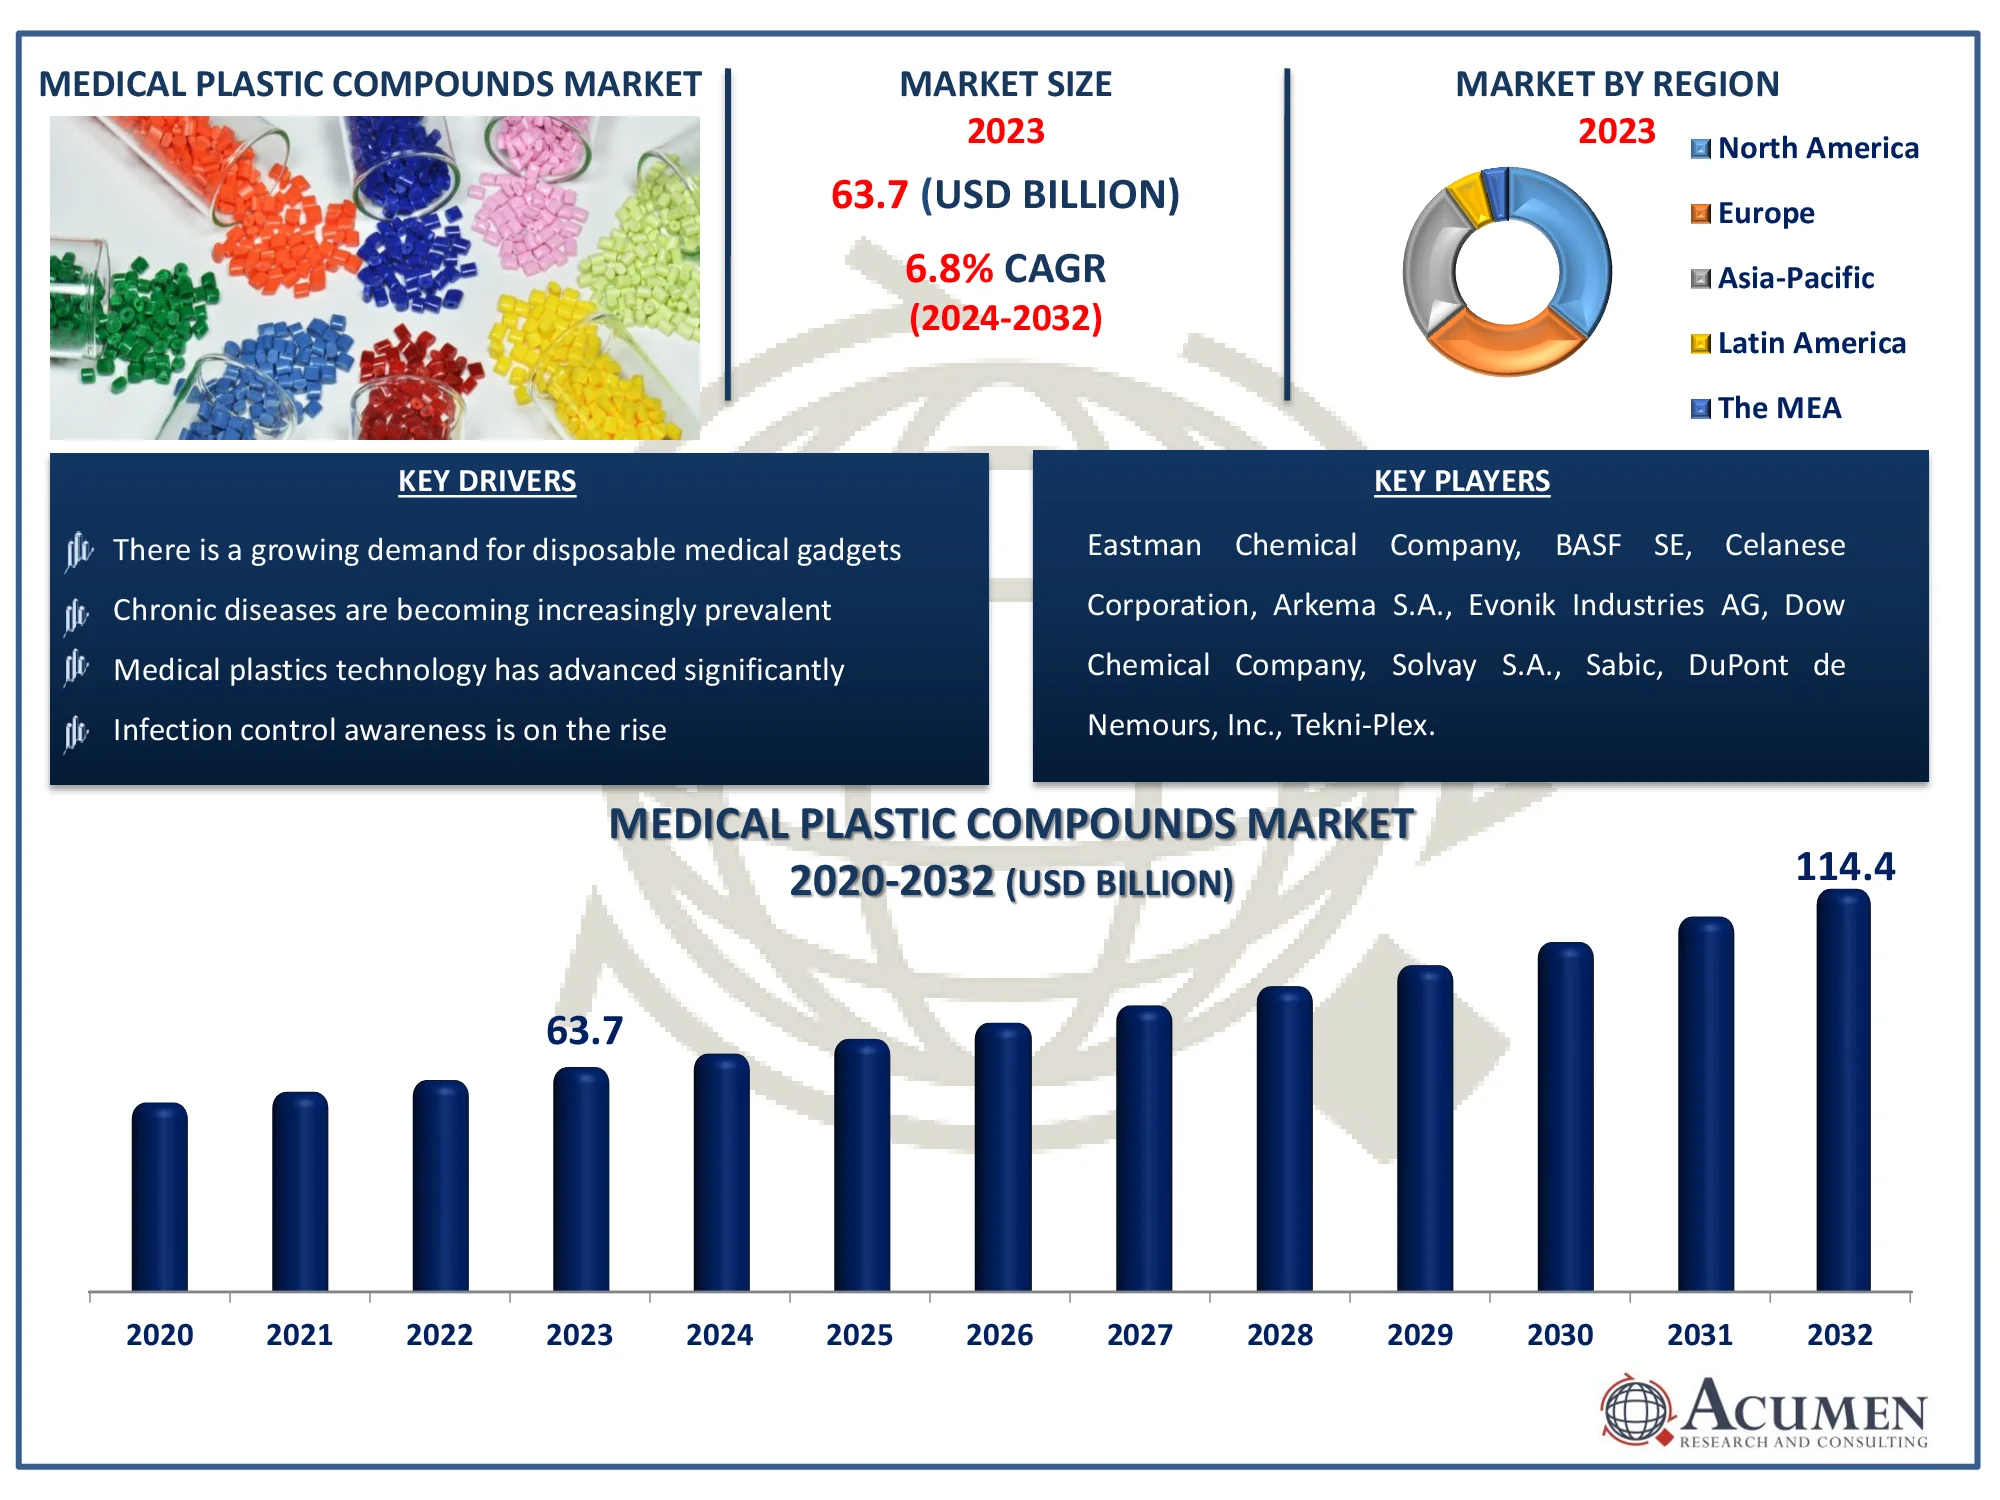
The Global Medical Plastic Compounds Market Size accounted for USD 63.7 Billion in 2023 and is estimated to achieve a market size of USD 114.4 Billion by 2032 growing at a CAGR of 6.8% from 2024 to 2032.
Medical Plastic Compounds Market Highlights
- Global medical plastic compounds market revenue is poised to garner USD 114.4 billion by 2032 with a CAGR of 6.8% from 2024 to 2032
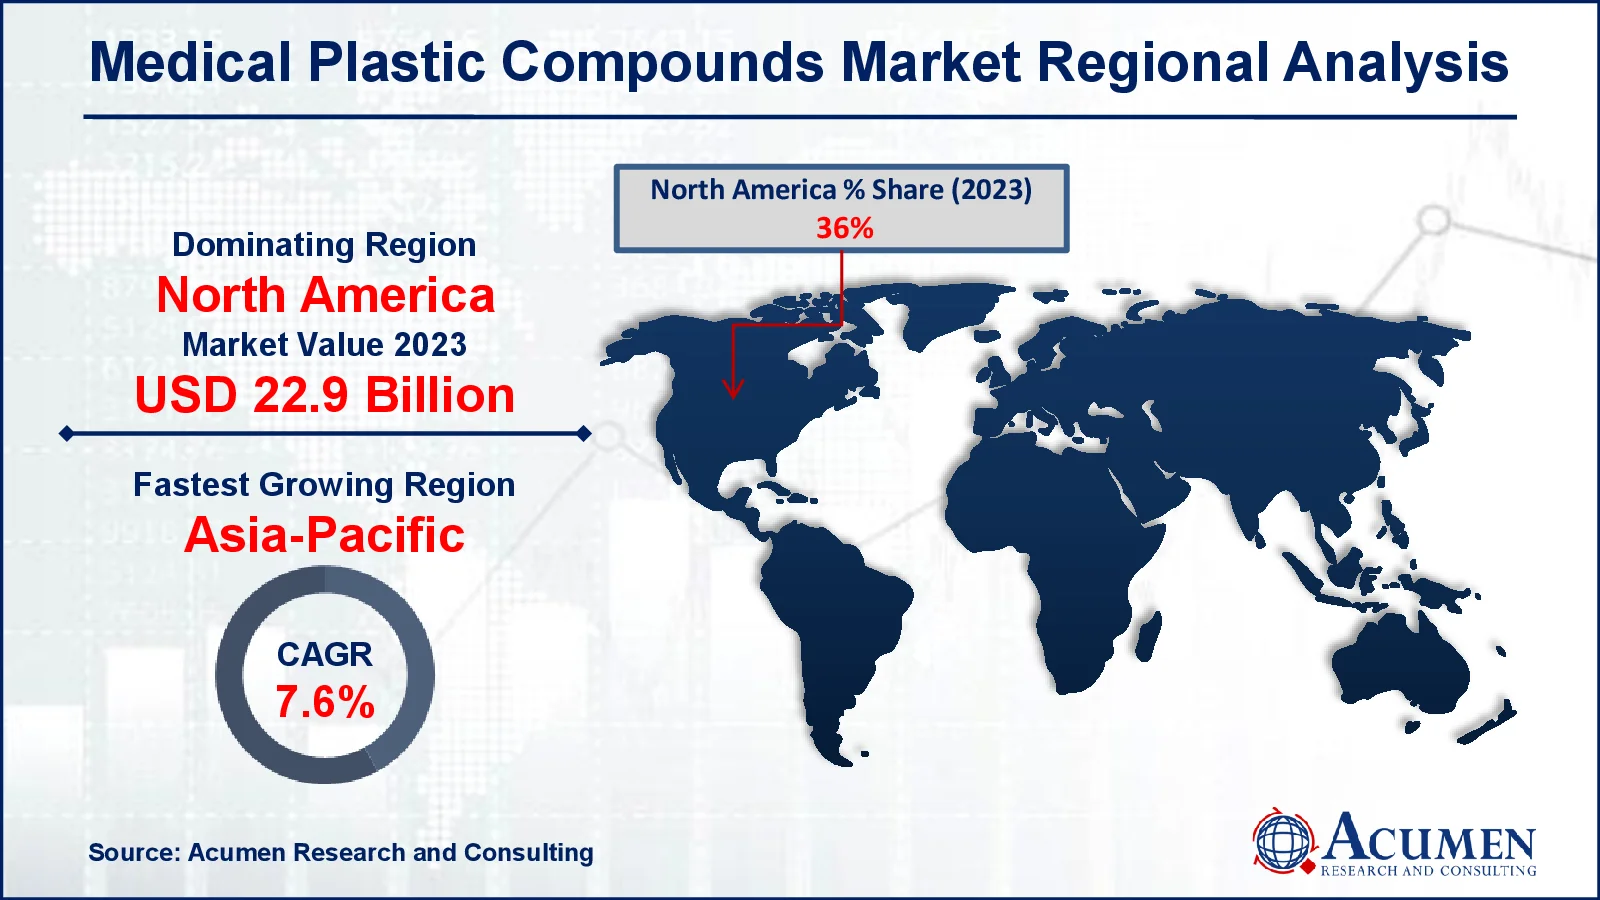
- North America medical plastic compounds market value occupied around USD 22.9 billion in 2023
- Asia-Pacific medical plastic compounds market growth will record a CAGR of more than 7.6% from 2024 to 2032
- Among product, the polyvinyl chloride sub-segment generated around USD 19.7 billion revenue in 2023
- Based on application, the disposables sub-segment generated 16% medical plastic compounds market share in 2023
- Growth in minimally invasive surgical treatments is a popular medical plastic compounds market trend that fuels the industry demand

Medical plastic compounds are specialized polymers used in healthcare to create a variety of medical devices, equipment, and packaging materials. They're made of PVC, polypropylene, polyethylene, and polycarbonate. These plastics have been specifically created to meet high medical requirements, ensuring their safety and efficacy in medical applications. They are designed to be extremely durable, adaptable, and resistant to chemicals and sterilization methods. Disposable syringes, tubing, catheters, implanted devices, and surgical instruments are all viable options. Medical plastic compounds provide a number of advantages, including biocompatibility, lightweight properties, and the ability to be molded into complex shapes. Their use contributes to lower healthcare-associated infections and better patient outcomes. They also enable the creation of low-cost, single-use devices, which are essential for maintaining hygiene and reducing cross-contamination in medical environments.
Global Medical Plastic Compounds Market Dynamics
Market Drivers
- There is a growing demand for disposable medical gadgets
- Chronic diseases are becoming increasingly prevalent
- Medical plastics technology has advanced significantly
- Infection control awareness is on the rise
Market Restraints
- Strict regulatory requirements
- Raw material costs are volatile
- Environmental worries over plastic trash
Market Opportunities
- Expanding healthcare infrastructure in emerging markets
- Development of biodegradable and environmentally friendly polymeric compounds
- Increased emphasis on home healthcare solutions
Medical Plastic Compounds Market Report Coverage
|
Market |
Medical Plastic Compounds Market |
|
Medical Plastic Compounds Market Size 2023 |
USD 63.7 Billion |
|
Medical Plastic Compounds Market Forecast 2032 |
USD 114.4 Billion |
|
Medical Plastic Compounds Market CAGR During 2024 - 2032 |
6.8% |
|
Medical Plastic Compounds Market Analysis Period |
2020 - 2032 |
|
Medical Plastic Compounds Market Base Year |
2023 |
|
Medical Plastic Compounds Market Forecast Data |
2024 - 2032 |
|
Segments Covered |
By Product, By Application, and By Geography |
|
Regional Scope |
North America, Europe, Asia Pacific, Latin America, and Middle East & Africa |
|
Key Companies Profiled |
Eastman Chemical Company, BASF SE, Celanese Corporation, Arkema S.A., Evonik Industries AG, Dow Chemical Company, Solvay S.A., Sabic, DuPont de Nemours, Inc., and Tekni-Plex. |
|
Report Coverage |
Market Trends, Drivers, Restraints, Competitive Analysis, Player Profiling, Covid-19 Analysis, Regulation Analysis |
Medical Plastic Compounds Market Insights
Expanding aging populace in economies, for example, Austria, India, China, and Germany is anticipated to remain a key driving variable. Developing demand for healthcare offices and services combined with government activities and support towards healthcare services is anticipated to positively affect the market development. Expanding aging populace in nations, for example, Germany, Denmark, Belgium, Japan, and Austria and is foreseen to incite development of the medical plastic compound market. Expanding utilization of medicinal gadgets, for example, MRI, X-beam, apheresis machines and robotic dispensing systems would additionally drive the demand over the medical plastic compounds industry forecast period.
Technological advancements, advancements in plastics, and developed purification gadgets are boosting demand for plastic gadgets. Expanding demand for polymers in end-use enterprises including disposables, surgical instruments, medical bags, catheters, implants, and drug delivery systems is required to incite market development in not so distant future. Polymers show predominant properties, for example, surface control, adaptability, quality, lightweight, inflexibility, simplicity of creation, and capacity to withstand long haul presentation to human body. Maturing populace is touted to drive demand for existing and new medicinal innovations in nations, for example, China, Japan, India, and Thailand.
Predominance of chronic diseases including diabetes, heart infections, arthritis, and respiratory sicknesses; particularly among maturing populace is required to drive demand for medical devices, which thusly, is foreseen to make new avenues for market participants. Surging home healthcare industry, inclination for self-prescription combined with booming medical tourism is relied upon to affect the development of the market in not so distant future. Crude oil costs have been seeing critical vacillations over the ongoing years. Political unsteadiness in real unrefined petroleum delivering nations, for example, Iraq, Nigeria, Venezuela, Libya, and Iran have unfavourably influenced crude oil supply, hence making inelasticity in free market activity balance for polymer raw material.
Medical Plastic Compounds Market Segmentation
The worldwide market for medical plastic compounds is split based on product, application, and geography.
Medical Plastic Compounds Market By Products
- Polyvinyl Chloride
- Polyethylene
- Polypropylene
- Polystyrene
- Polyester
- Polycarbonate
- Polyurethane
- Acrylics
- Others
According to medical plastic compounds industry analysis, the polyvinyl chloride (PVC) segment accounts for roughly 31% of the market share. PVC is widely utilized in the healthcare industry due to its high durability, flexibility, and cost effectiveness. It is commonly used in the production of medical devices including as tubing, catheters, blood bags, and intravenous containers. The material's ability to be sterilized while retaining physical qualities makes it perfect for medical applications that need high degrees of cleanliness and safety.
PVC's versatility allows it to be easily molded into complex shapes, which is important when making unique medical components. Furthermore, its chemical resistance allows it to handle a wide range of fluids and drugs. The availability of medical-grade PVC that passes severe regulatory requirements accelerates its adoption in the healthcare industry. The high need for disposable medical equipment, combined with PVC's proven performance, helps to explain its dominant position in the medical plastic compounds industry.
Medical Plastic Compounds Market By Applications
- Disposables
- Catheters
- Surgical Instruments
- Medical Bags
- Implants
- Drug Delivery System
- Others
Disposables are the major application in the medical plastic compounds market. This category comprises syringes, gloves, masks, and other single-use medical supplies. The increasing demand for disposables stems from their vital function in infection control, which reduces the danger of cross-contamination between patients. The increased emphasis on sanitation and safety in healthcare settings, particularly in light of recent global health crises, has boosted demand for disposable medical supplies. Medical plastics used in disposables are preferred because of their low cost, convenience of manufacture, and ability to meet stringent sterilization and safety standards. As healthcare providers prioritize patient safety and operational efficiency, disposable medical equipment are expected to maintain their market lead.
Medical Plastic Compounds Market Regional Outlook
North America
- U.S.
- Canada
Europe
- U.K.
- Germany
- France
- Spain
- Rest of Europe
Asia-Pacific
- India
- Japan
- China
- Australia
- South Korea
- Rest of Asia-Pacific
Latin America
- Brazil
- Mexico
- Rest of LATAM
The Middle East & Africa
- South Africa
- GCC Countries
- Rest of the Middle East & Africa (ME&A)

Medical Plastic Compounds Market Regional Analysis
In terms of medical plastic compounds market analysis, North America is relied upon to be the predominant district representing over 36% of the industry in 2023. The provincial market is driven by flooding rate of way of life maladies and government activity on enhancing healthcare industry. Expanding market tourism industry particularly in nations, for example, U.K., Germany, and France is foreseen to build demand for gadgets. Developing home healthcare devices and self-medication in Europe is relied upon to impel industry development over the medical plastic compounds market forecast period. Asia-Pacific healthcare industry demand is relied upon to develop at an expected CAGR of 7.6% from 2024 to 2032. To diminish the expense of hospital stay is relied upon to expand center around homecare health devices and improve the demand for diabetes control gadgets and dialysis packs.
Medical Plastic Compounds Market Players
Some of the top medical plastic compounds companies offered in our report includes Eastman Chemical Company, BASF SE, Celanese Corporation, Arkema S.A., Evonik Industries AG, Dow Chemical Company, Solvay S.A., Sabic, DuPont de Nemours, Inc., Tekni-Plex.
Frequently Asked Questions
How big is the medical plastic compounds market?
The medical plastic compounds market size was valued at USD 63.7 billion in 2023.
What is the CAGR of the global medical plastic compounds market from 2024 to 2032?
The CAGR of medical plastic compounds is 6.8% during the analysis period of 2024 to 2032.
Which are the key players in the medical plastic compounds market?
The key players operating in the global market are including Eastman Chemical Company, BASF SE, Celanese Corporation, Arkema S.A., Evonik Industries AG, Dow Chemical Company, Solvay S.A., Sabic, DuPont de Nemours, Inc., Tekni-Plex.
Which region dominated the global medical plastic compounds market share?
North America held the dominating position in medical plastic compounds industry during the analysis period of 2024 to 2032.
Which region registered fastest CAGR from 2024 to 2032?
Asia-Pacific region exhibited fastest growing CAGR for market of medical plastic compounds during the analysis period of 2024 to 2032.
What are the current trends and dynamics in the global medical plastic compounds industry?
The current trends and dynamics in the medical plastic compounds industry there is a growing demand for disposable medical gadgets, chronic diseases are becoming increasingly prevalent, medical plastics technology has advanced significantly, and infection control awareness is on the rise.
Which application held the maximum share in 2023?
The disposables application held the maximum share of the medical plastic compounds industry.


