Noble Ferro Alloys Market | Acumen Research and Consulting
Noble Ferro Alloys Market Size - Global Industry, Share, Analysis, Trends and Forecast 2024 - 2032
Published :
Report ID:
Pages :
Format :
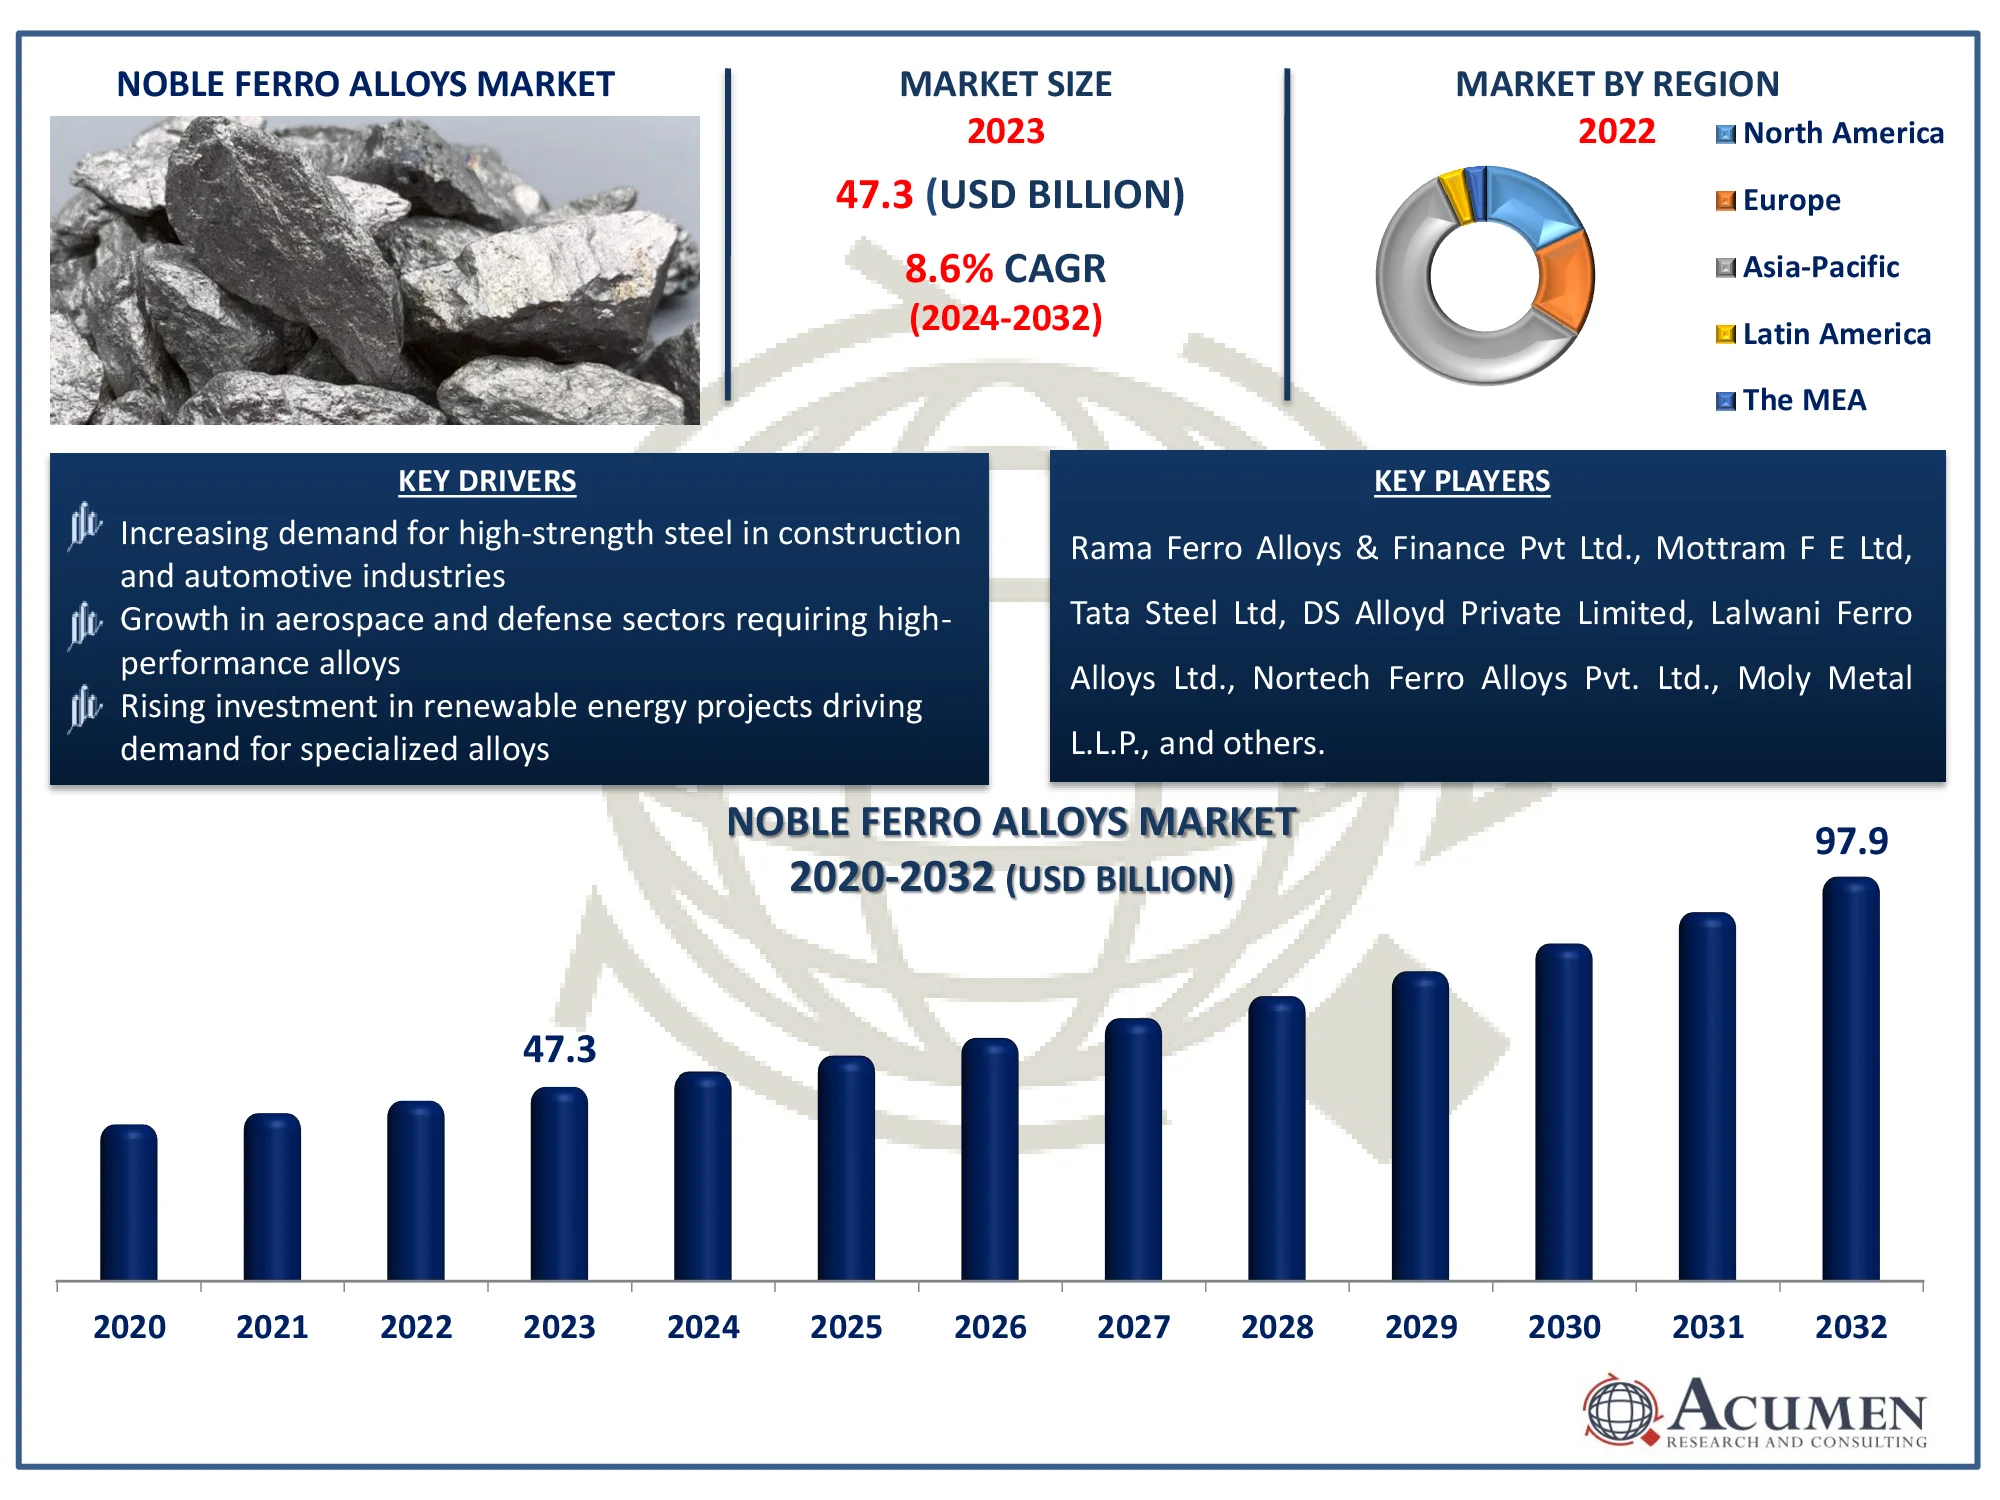
The Global Noble Ferro Alloys Market Size accounted for USD 47.3 Billion in 2023 and is estimated to achieve a market size of USD 97.9 Billion by 2032 growing at a CAGR of 8.6% from 2024 to 2032.
Noble Ferro Alloys Market Highlights
- Global noble ferro alloys market revenue is poised to garner USD 97.9 billion by 2032 with a CAGR of 8.6% from 2024 to 2032
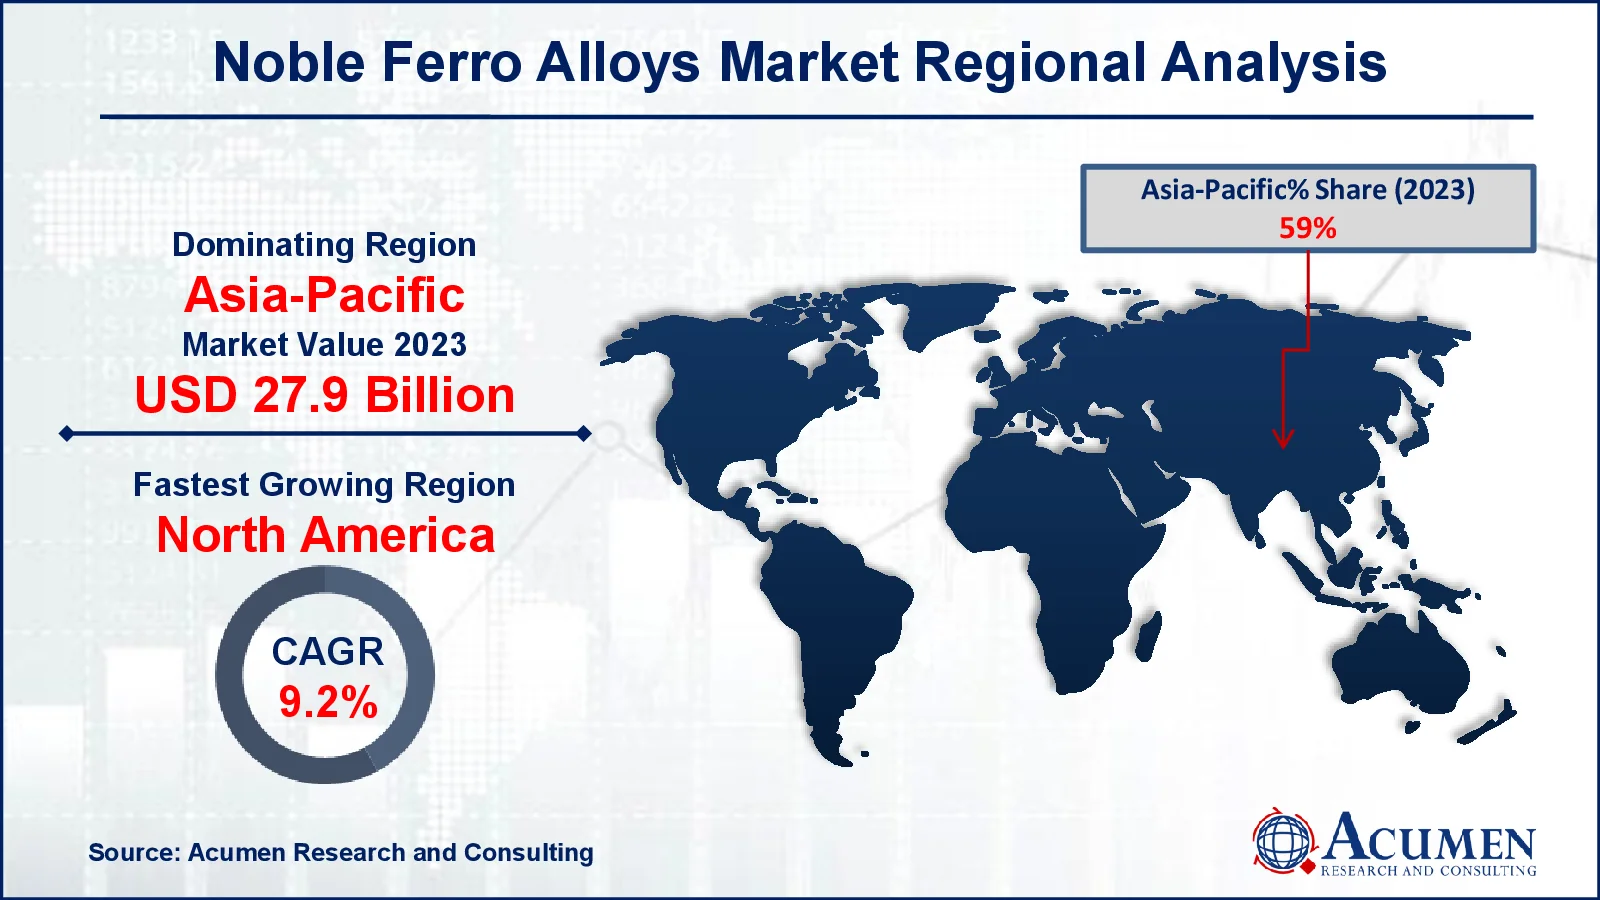
- Asia-Pacific noble ferro alloys market value occupied around USD 27.9 billion in 2023
- North America noble ferro alloys market growth will record a CAGR of more than 9.2% from 2024 to 2032
- Based on types, the ferronickel sub-segment expected to generated significant market share in 2023
- Environmental regulations are encouraging the use of eco-friendly and high-quality alloys in industrial processes is the noble ferro alloys market trend that fuels the industry demand

Noble ferro alloys are specialist alloys formed by mixing iron with rare or precious metals like vanadium, titanium, niobium, tungsten, and molybdenum. These alloys are typically used to improve the mechanical qualities of steel and other metals, such as strength, heat resistance, and corrosion resistance. Their special properties make them indispensable in the production of high-performance materials such as superalloys and high-strength steel. Noble ferro alloys are frequently utilized in aircraft for long-lasting components, the automobile sector for lightweight, crash-resistant parts, and construction for infrastructure that demands increased durability. Other applications include welding electrodes and the manufacturing of high-grade steel. These alloys are crucial in sectors requiring modern, dependable materials for safety and efficiency.
Global Noble Ferro Alloys Market Dynamics
Market Drivers
- Increasing demand for high-strength steel in construction and automotive industries
- Growth in aerospace and defense sectors requiring high-performance alloys
- Rising investment in renewable energy projects driving demand for specialized alloys
Market Restraints
- Volatility in raw material prices impacting production costs
- Environmental regulations affecting mining and alloy production processes
- Competition from alternative materials and substitutes in various applications
Market Opportunities
- Expanding applications in emerging technologies, such as electric vehicles and energy storage
- Increasing investments in infrastructure development in developing regions
- Potential for product innovation and development of new alloys with enhanced properties
Noble Ferro Alloys Market Report Coverage
| Market | Noble Ferro Alloys Market |
| Noble Ferro Alloys Market Size 2022 |
USD 47.3 Billion |
| Noble Ferro Alloys Market Forecast 2032 | USD 97.9 Billion |
| Noble Ferro Alloys Market CAGR During 2023 - 2032 | 8.6% |
| Noble Ferro Alloys Market Analysis Period | 2020 - 2032 |
| Noble Ferro Alloys Market Base Year |
2022 |
| Noble Ferro Alloys Market Forecast Data | 2023 - 2032 |
| Segments Covered | By Product, By Application, And By Geography |
| Regional Scope | North America, Europe, Asia Pacific, Latin America, and Middle East & Africa |
| Key Companies Profiled | Rama Ferro Alloys & Finance Pvt Ltd., Mottram F E Ltd, Tata Steel Ltd, DS Alloyd Private Limited, Lalwani Ferro Alloys Ltd., Nortech Ferro Alloys Pvt. Ltd., Moly Metal L.L.P., Team Ferro Alloys Pvt. Ltd., AMG Critical Materials, and Essel Mining & Industries Limited (EMIL). |
| Report Coverage |
Market Trends, Drivers, Restraints, Competitive Analysis, Player Profiling, Covid-19 Analysis, Regulation Analysis |
Noble Ferro Alloys Market Insights
The global ferroalloys industry is thriving and is expected to develop at a CAGR of 8.6% due to the lack of a viable solution capable of meeting the diverse applications. The development of lightweight and high-strength steel grades will open up new chances for a variety of rising economies to encourage building growth, and the building industry is yet another significant driver of the global ferroalloys market. On the other hand, rigorous environmental regulations and high operational expenses in the global ferroalloys market are two clear constraints.
Manganese is used to make most steels and is also a key component in the production of cast iron. The majority of noble ferroalloys is made from rare earth minerals and is more expensive to make than bulk ferroalloys. Most noble metals are made from boron, tungsten, nickel, vanadium, niobium, cobalt, titanium, chromium, copper, and molybdenum. These rare earth elements impart distinct properties and features to various alloy stones and cast steels.
Most bulk ferro alloys and noble alloys are utilized by a variety of end users to improve steel properties. Because of the low pricing and increased manufacturing of bulk ferroalloys in the main producing locations, about 80 percent of all ferroalloys are produced and utilized for steel production. Noble alloys are formed from rare earth elements and need costly industrial methods that consume energy, raising their production prices. Noble Ferro Alloys are pricier than bulk ferroalloys. Noble Ferro Alloys consume substantially less than bulk ferroalloys, but they yield far more revenue.
The emphasis on ferroalloys is growing as they become more important in the iron and steel industry. Price variations and instability in the steel sector have a direct impact on the expansion of the noble market for ferroalloys. Noble ferro alloys are utilized in the steel, stainless steel, and superalloys industries, with the steel industry using around 80% of all noble ferro alloys produced worldwide.
The rising use of noble ferro alloys in developing technologies, particularly electric vehicles (EVs) and energy storage systems, presents considerable market potential opportunities. These alloys improve the performance and longevity of components such as battery casings and electric motor parts, helping EVs run more efficiently and safely. As the demand for sustainable transportation grows, so does the requirement for high-strength, lightweight materials, which drives the use of noble ferro alloys. Furthermore, advancements in energy storage technologies, such as battery systems, necessitate the use of specialty alloys to improve energy density and thermal stability, resulting in a significant market opportunity.
Noble Ferro Alloys Market Segmentation
The worldwide market for noble ferro alloys is split based on type, application, and geography.
Noble Ferro Alloy Market By Type
- Ferroniobium
- Ferromolybdenum
- Ferrovanadium
- Ferroboron
- Ferronickel
- Ferrotungsten
- Ferrotitanium
- Ferroaluminium
- Others
According to the noble ferro alloys industry analysis, the ferronickel segment is expected to increase significantly within the noble ferro alloys market because of its importance in the production of stainless steel. As businesses prioritize corrosion resistance and durability, demand for ferronickel, which improves steel's mechanical qualities, is increasing. Furthermore, the growing automotive and construction industries are driving the demand for high-performance materials, which is boosting the ferronickel segment.
Noble Ferro Alloy Market By Application
- Welding Electrodes
- Elevated Grade Steel
- Superalloys
- Others
According to the noble ferro alloys market forecast, superalloys are frequently the popular application in market, owing to their importance in high-performance industries such as aerospace, power generation, and automotive. Noble ferro alloys, such as ferro-titanium, ferro-vanadium, and ferro-tungsten, are critical in superalloy production due to their ability to improve heat resistance, corrosion resistance, and mechanical strength. These qualities are critical in severe conditions, making superalloys necessary for applications that require durability and precision.
Noble Ferro Alloys Market Regional Outlook
North America
- U.S.
- Canada
Europe
- U.K.
- Germany
- France
- Spain
- Rest of Europe
Asia-Pacific
- India
- Japan
- China
- Australia
- South Korea
- Rest of Asia-Pacific
Latin America
- Brazil
- Mexico
- Rest of Latin America
The Middle East & Africa
- South Africa
- GCC Countries
- Rest of the Middle East & Africa (ME&A)

Noble Ferro Alloys Market Regional Analysis
For several reasons, around 59% of worldwide ferroalloys demand for Asia-Pacific in the 2023 market was expected to have the highest CAGR throughout the entire projection period. This is owing to its powerful steel production industry, particularly in China and India, which are significant alloy users for infrastructure and manufacturing. The region's rapid industrialization and expanding need for innovative materials in industries such as aerospace, automotive, and energy contribute to high consumption. Additionally, emerging technologies for the manufacture and expansion of ferroalloys from China, Japan, and India will dominate the global ferroalloys industry.
The global ferroalloys market has been driven by the recovery of the North American economy, Asia-Pacific financial expansion, and increased ferroalloy manufacture in African nations
Europe was the rapidly growing market in 2023, however due to the region's deteriorating economy and global recession; demand is expected to fall in the near future.
Noble Ferro Alloys Market Players
Some of the top noble ferro alloys companies offered in our report include Rama Ferro Alloys & Finance Pvt Ltd., Mottram F E Ltd, Tata Steel Ltd, DS Alloyd Private Limited, Lalwani Ferro Alloys Ltd., Nortech Ferro Alloys Pvt. Ltd., Moly Metal L.L.P., Team Ferro Alloys Pvt. Ltd., AMG Critical Materials, and Essel Mining & Industries Limited (EMIL).
Frequently Asked Questions
How big is the noble ferro alloys market?
The noble ferro alloys market size was valued at USD 47.3 billion in 2023.
What is the CAGR of the global noble ferro alloys market from 2024 to 2032?
The CAGR of noble ferro alloys is 8.6% during the analysis period of 2024 to 2032.
Which are the key players in the noble ferro alloys market?
The key players operating in the global market are including Rama Ferro Alloys & Finance Pvt Ltd., Mottram F E Ltd, Tata Steel Ltd, DS Alloyd Private Limited, Lalwani Ferro Alloys Ltd., Nortech Ferro Alloys Pvt. Ltd., Moly Metal L.L.P., Team Ferro Alloys Pvt. Ltd., AMG Critical Materials, and Essel Mining & Industries Limited (EMIL).
Which region dominated the global noble ferro alloys market share?
Asia-Pacific held the dominating position in noble ferro alloys industry during the analysis period of 2024 to 2032.
Which region registered fastest CAGR from 2024 to 2032?
North America region exhibited fastest growing CAGR for market of noble ferro alloys during the analysis period of 2024 to 2032.
What are the current trends and dynamics in the global noble ferro alloys industry?
The current trends and dynamics in the noble ferro alloys industry include increasing demand for high-strength steel in construction and automotive industries, growth in aerospace and defense sectors requiring high-performance alloys, and rising investment in renewable energy projects driving demand for specialized alloys.
Which type segment held the maximum share in 2023?
The ferronickel type is expected to hold the maximum share of the noble ferro alloys industry.


