Vanadium Market Size - Global Industry, Share, Analysis, Trends and Forecast 2023 - 2032
Published :
Report ID:
Pages :
Format :
Vanadium Market Size - Global Industry, Share, Analysis, Trends and Forecast 2023 - 2032
Report Coverage
- Industry Dynamics
- Market Size and Forecast Data
- Segment Analysis
- Competitive Landscape
- Regional Analysis with a Niche Focus on Country-Level Data
- High Level Analysis - Porter's, PESTEL, Value Chain, etc.
- Company Profiles of Key Players
- Option to Customize the Report As Per Your Specific Need
Request Sample Report
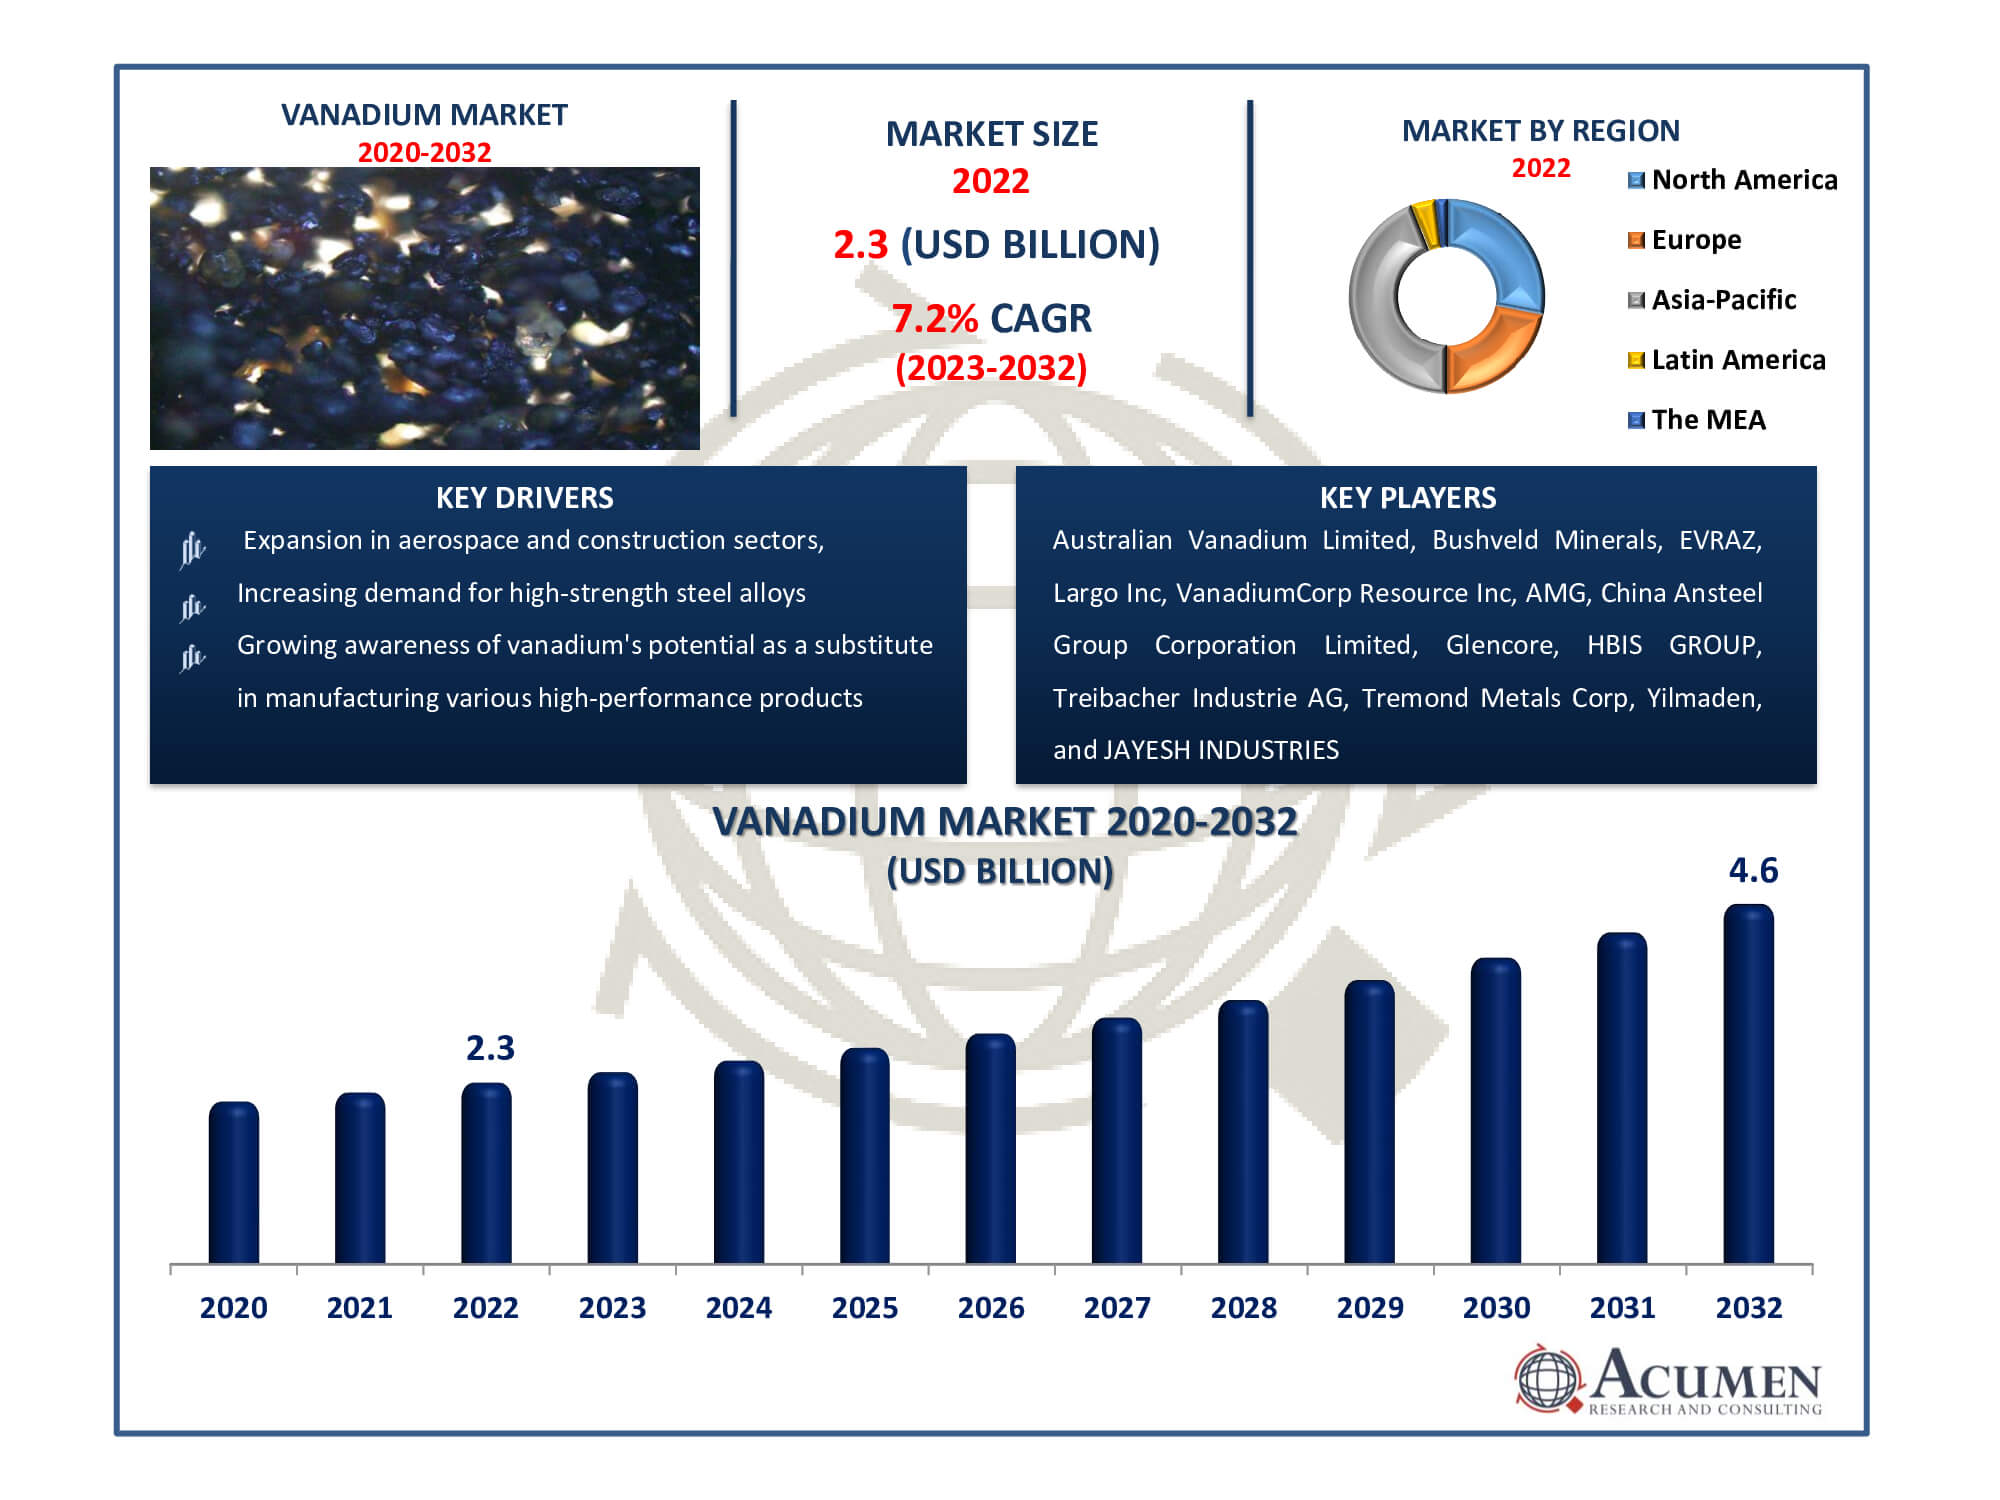
The Vanadium Market Size accounted for USD 2.3 Billion in 2022 and is estimated to achieve a market size of USD 4.6 Billion by 2032 growing at a CAGR of 7.2% from 2023 to 2032.
Vanadium Market Highlights
- Global vanadium market revenue is poised to garner USD 4.6 billion by 2032 with a CAGR of 7.2% from 2023 to 2032
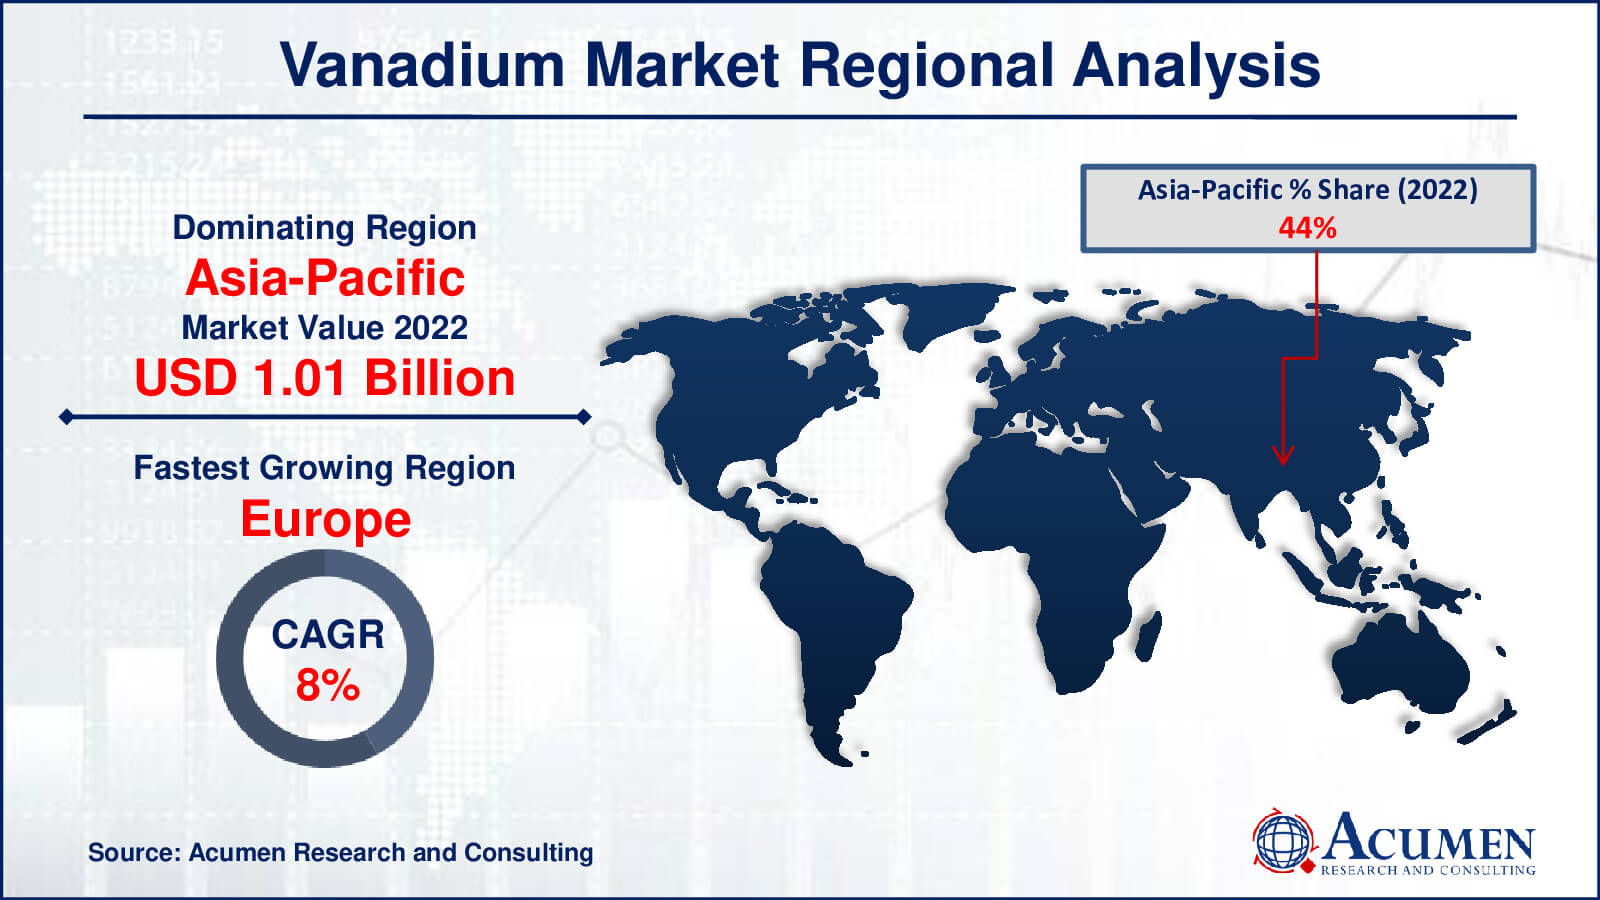
- Asia-Pacific vanadium market value occupied around USD 1.0 billion in 2022
- Europe vanadium market growth will record a CAGR of more than 8% from 2023 to 2032
- Among type, the vanadium pentoxide sub-segment generated over US$ 1.5 billion revenue in 2022
- Based on end-user, the automotive sub-segment generated around 35% share in 2022
- Collaborations for research to expand vanadium's applications in sustainable industries is a popular vanadium market trend that fuels the industry demand

The vanadium market, a key participant in several sectors, is showing promising growth. This versatile metal, which may be obtained through a variety of techniques including mining, is an important component in steel alloys and energy storage systems. Its demand is being pushed by rising government initiatives in energy generation, as well as a growing demand for vanadium-based alloys in construction and aerospace. Vanadium, as a manufacturing replacement, satisfies the growing demand for high-strength materials, particularly in wire production. Its significance in energy storage systems, such as vanadium redox flow batteries (VRFBs), also contributes to its market dominance. Despite periodic price fluctuations caused by supply constraints, the market's trajectory remains strong, fueled by its pivotal position in key industries such as renewable energy and steel manufacturing.
Global Vanadium Market Dynamics
Market Drivers
- Increasing demand for high-strength steel alloys
- Rising government initiatives toward green energy solutions
- Expansion in aerospace and construction sectors
- Growing awareness of vanadium's potential as a substitute in manufacturing various high-performance products
Market Restraints
- Price volatility due to supply limitations and market fluctuations
- Reliance on mining for a significant portion of vanadium supply
- Regulatory challenges and environmental concerns surrounding mining practices
Market Opportunities
- Advancements in vanadium redox flow batteries (VRFBs) for efficient energy storage solutions
- Increasing applications in emerging technologies like 5G infrastructure
- Exploration of recycling processes to mitigate supply constraints
Vanadium Market Report Coverage
| Market | Vanadium Market |
| Vanadium Market Size 2022 | USD 2.3 Billion |
| Vanadium Market Forecast 2032 | USD 4.6 Billion |
| Vanadium Market CAGR During 2023 - 2032 | 7.2% |
| Vanadium Market Analysis Period | 2020 - 2032 |
| Vanadium Market Base Year |
2022 |
| Vanadium Market Forecast Data | 2023 - 2032 |
| Segments Covered | By Type, By Grade Type, By Application, By End-User, And By Geography |
| Regional Scope | North America, Europe, Asia Pacific, Latin America, and Middle East & Africa |
| Key Companies Profiled | Australian Vanadium Limited, Bushveld Minerals, EVRAZ, Largo Inc, VanadiumCorp Resource Inc, AMG, China Ansteel Group Corporation Limited, Glencore, HBIS GROUP, Treibacher Industrie AG, Tremond Metals Corp, Yilmaden, JAYESH INDUSTRIES LTD., Core Metals LLC. |
| Report Coverage |
Market Trends, Drivers, Restraints, Competitive Analysis, Player Profiling, Covid-19 Analysis, Regulation Analysis |
Vanadium Market Insights
The global vanadium market is poised for substantial growth, obtained through diverse production methods. A significant portion of vanadium is acquired through mining. Factors driving this market include amplified government initiatives towards energy generation and a rising need for wires and various alloys. The market is rapidly expanding due to governmental incentives promoting green energy generation. Vanadium serves as a potential substitute for metals in wire manufacturing, witnessing escalated demand owing to rising energy prices and heightened concerns regarding energy consumption and emissions. This surge in demand is significantly propelling the market's growth trajectory.
However, being rare metal, continuous price fluctuations may hinder market growth. In recent year, vanadium prices spiked dramatically as the market moved into a structural deficit. Capacity reductions, diminishing global inventories and the introduction of new rebar regulations in China have affected metal pricing globally.
Vanadium market dynamics showcase its significant role in the energy sector, notably in battery technology, where vanadium redox flow batteries (VRFBs) are gaining traction due to their energy storage capabilities. Furthermore, advancements in steel manufacturing, especially for high-strength steel production, heavily rely on vanadium alloys, driving demand. The market's vulnerability to price fluctuations due to supply constraints remains a critical challenge, impacting its widespread adoption in various industries. Additionally, the ongoing research and development in vanadium-based technologies and the metal's applications in renewable energy sources are poised to reshape the market landscape.
Vanadium Market Segmentation
The worldwide market for vanadium is split based on type, grade type, application, end-user, and geography.
Vanadium Types
- Vanadium Chemicals
- Vanadium Pentoxide
- Vanadium Ferrovanadium
- Aluminium-Vanadium Alloys
- Others
Vanadium pentoxide's market dominance stems from its diverse applications in industries like steel and energy storage, fostering high demand as a critical precursor for alloys and catalysts. Its pivotal role in high-strength steel and vanadium redox flow batteries (VRFBs) amplifies its sway. Vanadium industry analysis underscores this, particularly with VRFBs gaining traction in renewable energy, elevating the continual demand for vanadium pentoxide in battery manufacturing. This sustained necessity positions vanadium pentoxide at the forefront of the vanadium market, reflecting its significant market share and continued growth prospects.
Vanadium Grade Types
- FeV40
- FeV50
- FeV60
- FeV80
FeV80 commands the largest market share owing to its higher vanadium concentration, preferred for alloy production. With an 80% vanadium composition, it enhances alloy strength and durability, meeting stringent industrial standards, particularly in steel manufacturing. The vanadium market forecast indicates sustained growth for FeV80 due to its ability to significantly improve steel properties. As demand rises for high-strength steel in various industries, FeV80's dominance in the vanadium alloy grades market is projected to persist, reflecting its integral role and anticipated continuous market expansion.
Vanadium Applications
- Iron & Steel
- Energy Storage
- Chemical
- Titanium Alloys
The iron & steel segment's dominance in the vanadium market is underscored by the metal's pivotal role in enhancing steel properties. Vanadium's incorporation into steel results in stronger, more durable alloys used across construction, manufacturing, and infrastructure. Its capacity to augment steel strength and toughness without compromising flexibility makes it highly coveted across various sectors. Given steel's foundational importance in construction and manufacturing, the consistent demand for vanadium within the Iron & Steel segment cements its market leadership. Vanadium industry analysis affirms this trend, projecting sustained reliance on vanadium for enhancing steel properties, ensuring its continued dominance in the market.
Vanadium End-Users
- Automotive
- Chemical
- Energy Storage
- Others
The automotive industry dominates the vanadium market due to the metal's critical role in the production of high-strength steel for cars. Steel is strengthened by vanadium, resulting in lighter, stronger, and more resilient alloys that fulfil strict safety and efficiency standards in automotive applications. As manufacturers prioritise lightweight yet durable materials to improve vehicle performance and safety, the prognosis suggests a continuous demand for vanadium in the production of high-strength steel for autos, cementing its market dominance in this segment.
Vanadium Market Regional Outlook
North America
- U.S.
- Canada
Europe
- U.K.
- Germany
- France
- Spain
- Rest of Europe
Asia-Pacific
- India
- Japan
- China
- Australia
- South Korea
- Rest of Asia-Pacific
Latin America
- Brazil
- Mexico
- Rest of Latin America
The Middle East & Africa
- South Africa
- GCC Countries
- Rest of the Middle East & Africa (ME&A)

Vanadium Market Regional Analysis
Geographically, the global vanadium market is segmented into North America, Europe, China, Japan, Southeast Asia, India, South America, and the Middle East and Africa.
Europe is estimated to be the fastest-growing region during the forecast period, driven by the lack of electricity in rural areas in emerging economies. The increasing investments by manufacturers, a well-developed manufacturing sector, and low labor costs in this region propel the market in Europe. In Europe market there is presence of huge manufacturers.
Europe is experiencing healthy growth during the forecast period. Proper government schemes, including feed-in tariffs (FIT) and financial support, are driving the market in this region. Investments by energy generation manufacturers, coupled with increasing demand for wires and chemicals from the energy sector, will propel the vanadium market's growth.
Asia-Pacific is expected to hold the major share of market growth due to the increasing demand for vanadium from various sectors, a well-developed industrial sector, and growing government support. The demand is mainly increasing because of the rising energy demand from industrial facilities, including refining, metals, chemicals, paper, and commercial facilities. The China and Japan are expected to hold the major share in the Asia-Pacific market.
LAMEA is expected to witness steady growth due to poor economic conditions and less government support.
Vanadium Market Players
Some of the top vanadium companies offered in our report includes Australian Vanadium Limited, Bushveld Minerals, EVRAZ, Largo Inc, VanadiumCorp Resource Inc, AMG, China Ansteel Group Corporation Limited, Glencore, HBIS GROUP, Treibacher Industrie AG, Tremond Metals Corp, Yilmaden, JAYESH INDUSTRIES LTD., and Core Metals LLC.
Frequently Asked Questions
How big is the vanadium market?
The vanadium market size was USD 2.3 billion in 2022.
What is the CAGR of the global vanadium market from 2023 to 2032?
The CAGR of vanadium is 7.2% during the analysis period of 2023 to 2032.
Which are the key players in the vanadium market?
The key players operating in the global market are including Australian Vanadium Limited, Bushveld Minerals, EVRAZ, Largo Inc, VanadiumCorp Resource Inc, AMG, China Ansteel Group Corporation Limited, Glencore, HBIS GROUP, Treibacher Industrie AG, Tremond Metals Corp, Yilmaden, JAYESH INDUSTRIES LTD., and Core Metals LLC.
Which region dominated the global vanadium market share?
Asia-Pacific held the dominating position in vanadium industry during the analysis period of 2023 to 2032.
Which region registered fastest CAGR from 2023 to 2032?
North America region exhibited fastest growing CAGR for market of vanadium during the analysis period of 2023 to 2032.
What are the current trends and dynamics in the global vanadium industry?
The current trends and dynamics in the vanadium industry include increasing demand for high-strength steel alloys, rising government initiatives toward green energy solutions, expansion in aerospace and construction sectors, and growing awareness of vanadium's potential as a substitute in manufacturing various high-performance products.
Which type held the maximum share in 2022?
The vanadium pentoxide type held the maximum share of the vanadium industry.


