Renewable Energy Market Size - Global Industry, Share, Analysis, Trends and Forecast 2024 - 2032
Published :
Report ID:
Pages :
Format :
Renewable Energy Market Size - Global Industry, Share, Analysis, Trends and Forecast 2024 - 2032
Report Coverage
- Industry Dynamics
- Market Size and Forecast Data
- Segment Analysis
- Competitive Landscape
- Regional Analysis with a Niche Focus on Country-Level Data
- High Level Analysis - Porter's, PESTEL, Value Chain, etc.
- Company Profiles of Key Players
- Option to Customize the Report As Per Your Specific Need
Request Sample Report
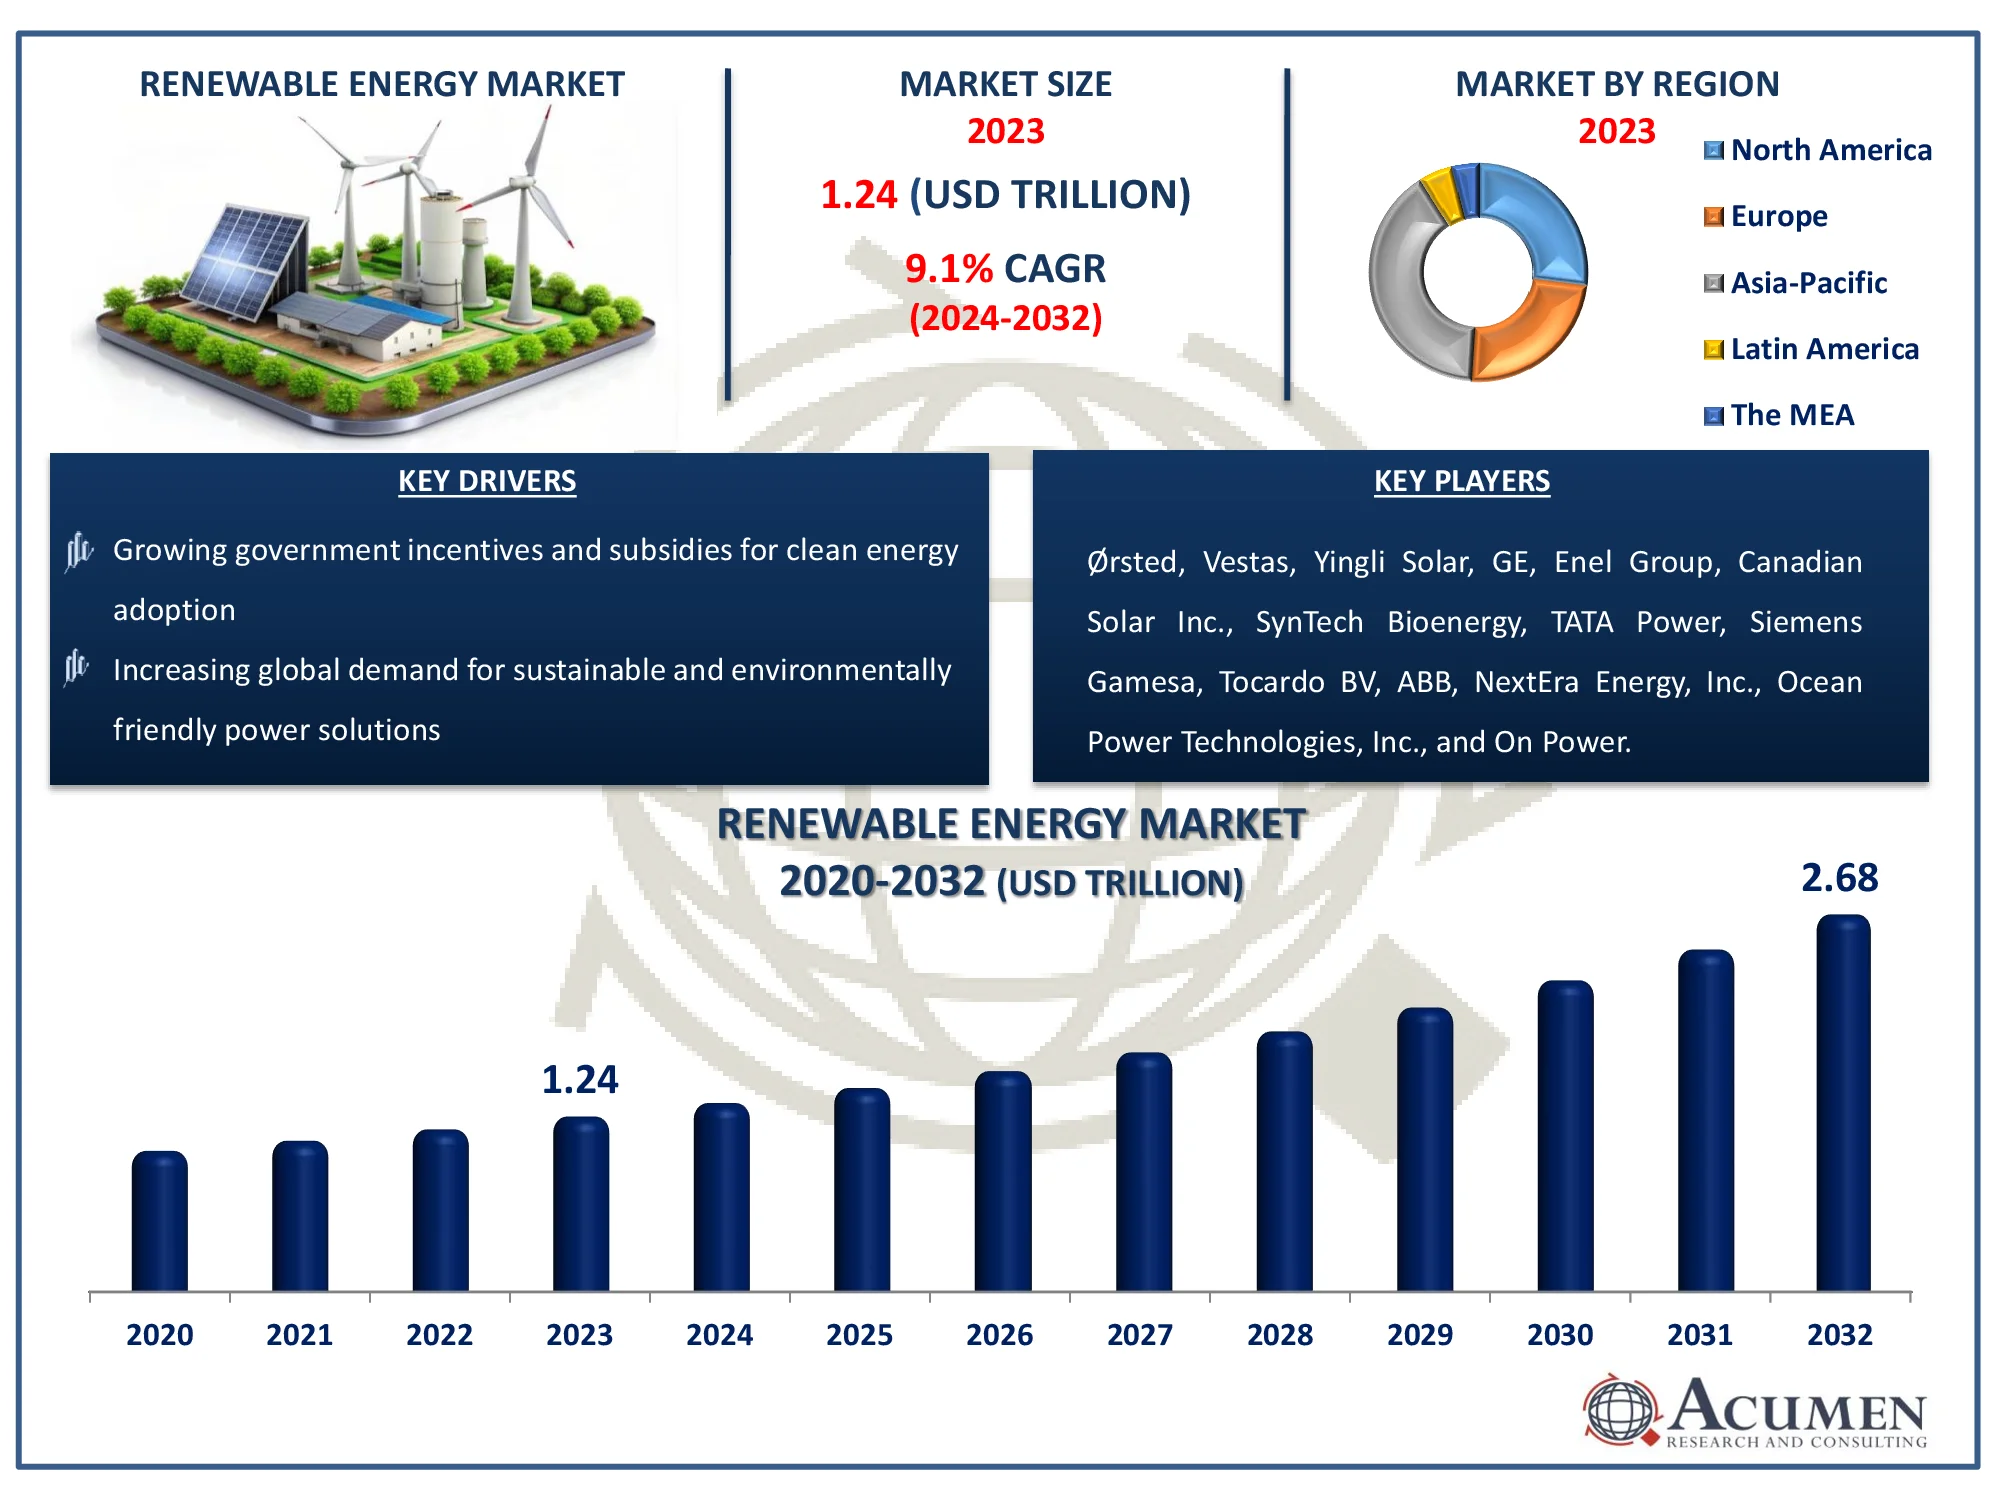
The Global Renewable Energy Market Size accounted for USD 1.24 Trillion in 2023 and is estimated to achieve a market size of USD 2.68 Trillion by 2032 growing at a CAGR of 9.1% from 2024 to 2032.
Renewable Energy Market Highlights
- Global renewable energy market revenue is poised to garner USD 2.68 Trillion by 2032 with a CAGR of 9.1% from 2024 to 2032
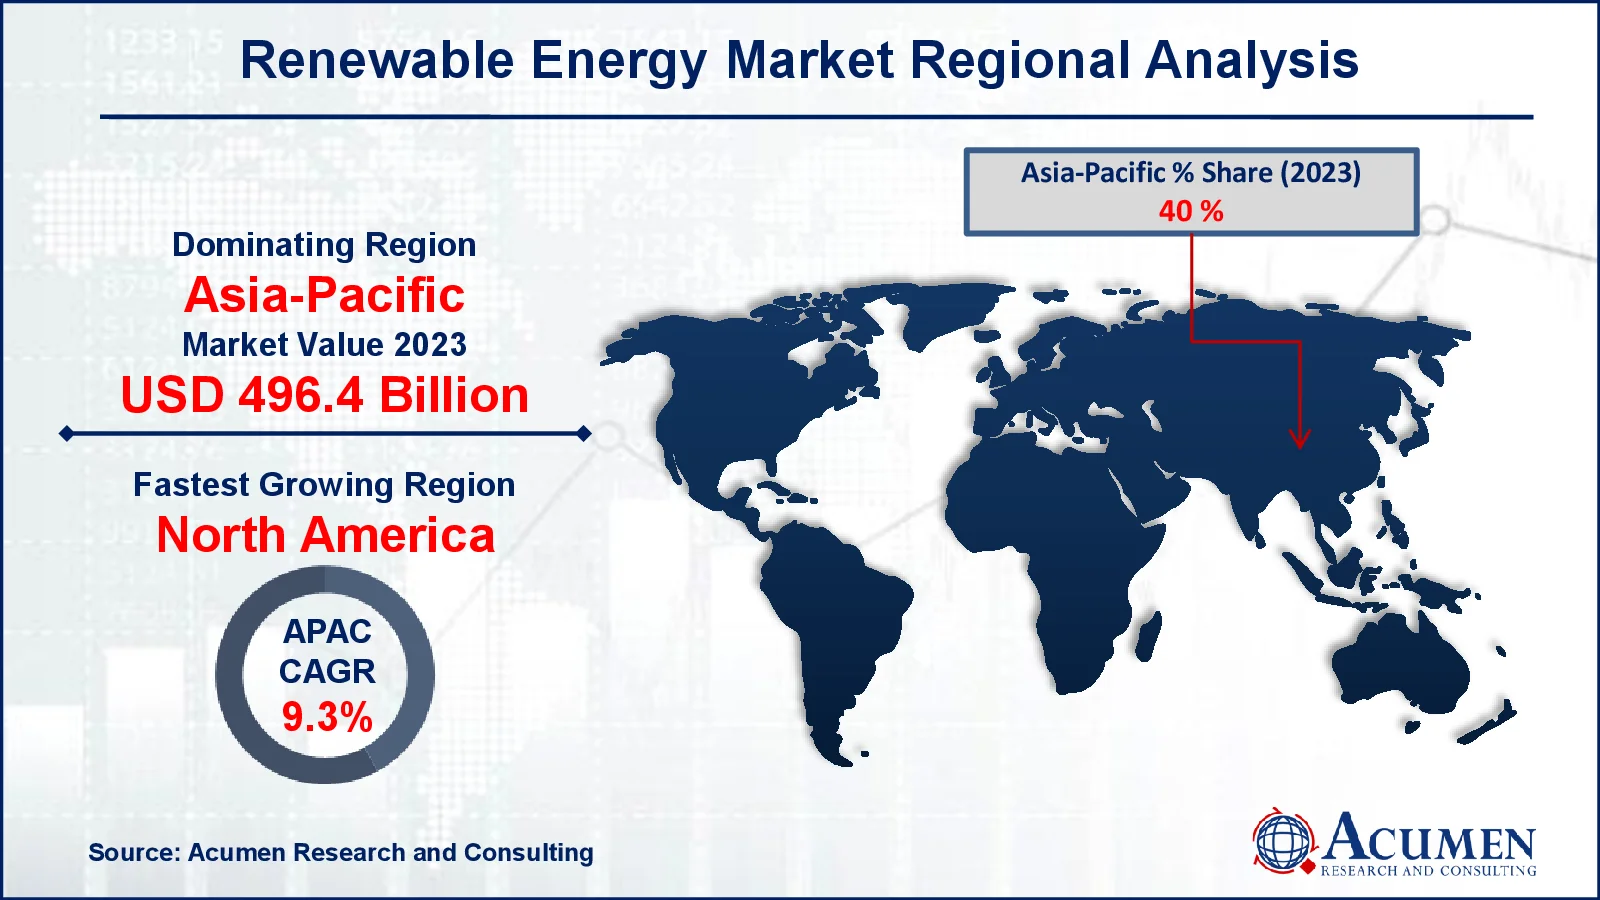
- Asia-Pacific renewable energy market value occupied around USD 496.4 billion in 2023
- North America renewable energy market growth will record a CAGR of more than 9.3% from 2024 to 2032
- Among product, the solar energy sub-segment generated USD 397.1 billion revenue in 2023
- Based on application, the industrial sub-segment generated 61% renewable energy market share in 2023
- Increased R&D funding for innovation in renewable energy technologies is a popular renewable energy market trend that fuels the industry demand

Renewable energy is generated from naturally regenerated resources such as sunshine, wind, water, ocean currents, geothermal heat, and biomass. These energy sources are crucial for reducing greenhouse gas emissions and combating climate change because they provide a sustainable alternative to fossil fuels. Renewable energy is commonly utilized to generate power, heat and cool buildings, convey vehicles, and provide rural energy. Solar panels convert sunlight directly into electricity, but wind turbines use the strength of the wind to power generators. Geothermal plants employ subsurface heat, whereas hydropower uses flowing water. Renewable energy continues to grow as technology progresses, contributing to global energy security, environmental sustainability, and economic prosperity.
Global Renewable Energy Market Dynamics
Market Drivers
- Growing government incentives and subsidies for clean energy adoption
- Increasing global demand for sustainable and environmentally friendly power solutions
- Technological advancements in energy storage and efficiency
- Rising awareness about the impacts of climate change
Market Restraints
- High initial investment costs for renewable energy infrastructure
- Intermittency and reliability issues associated with sources like solar and wind
- Limited grid infrastructure for integrating renewable energy sources
Market Opportunities
- Expanding potential for renewable energy deployment in emerging economies
- Advancements in energy storage solutions to stabilize supply
- Rising corporate and industrial demand for renewable power sources
Renewable Energy Market Report Coverage
| Market | Renewable Energy Market |
| Renewable Energy Market Size 2022 |
USD 1.24 Trillion |
| Renewable Energy Market Forecast 2032 | USD 2.68 Trillion |
| Renewable Energy Market CAGR During 2023 - 2032 | 6.6% |
| Renewable Energy Market Analysis Period | 2020 - 2032 |
| Renewable Energy Market Base Year |
2022 |
| Renewable Energy Market Forecast Data | 2023 - 2032 |
| Segments Covered | By Type, By End Use, And By Geography |
| Regional Scope | North America, Europe, Asia Pacific, Latin America, and Middle East & Africa |
| Key Companies Profiled | Ørsted, Vestas, Yingli Solar, GE, Enel Group, Canadian Solar Inc., SynTech Bioenergy, TATA Power, Siemens Gamesa, Tocardo BV, ABB, NextEra Energy, Inc., Ocean Power Technologies, Inc., and O2 Power. |
| Report Coverage |
Market Trends, Drivers, Restraints, Competitive Analysis, Player Profiling, Covid-19 Analysis, Regulation Analysis |
Renewable Energy Market Insights
The global renewable energy market is expected to grow significantly due to increased greenhouse gas emissions, particularly CO2 from the use of fossil fuels to generate energy. Moreover, the dwindling existence of fossil fuel on Earth and its high costs powers the clean energy sector. However, renewable energy generation requires huge investment and this factor is expected to hamper growth in the renewable energy market forecast period.
Furthermore, fossil fuels are primarily used in the Middle East to produce electricity due to their cost-effectiveness relative to other countries. On the contrary, continuous technological advancement and increased government funding in the renewable energy sector offer lucrative growth opportunities during the evaluation period. The market scale of renewable energy is rising due to higher policy restrictions on climate change in industrialized and emerging economies.
Renewable Energy Market Segmentation
The worldwide market for renewable energy is split based on type, end use, and geography.
Renewable Energy Types
- Wind Power Energy
- Hydroelectric Energy
- Geothermal Energy
- Biomass Energy
- Solar Energy
- Ocean Energy
According to renewable energy industry analysis, solar energy is predicted to be the most dominant segment of the market due to its scalability, low cost, and broad use in residential, commercial, and industrial settings. Photovoltaic (PV) technology has improved rapidly, boosting efficiency and cutting production costs, making solar electricity more accessible globally. Solar installations also get government subsidies, tax credits, and net metering restrictions, which help to drive market adoption. Asia-Pacific and North America are the most active regions for solar deployment, with China, India, and the United States spending extensively in solar farms and rooftop installations. Solar energy's ability to generate power without emitting pollutants, combined with its appropriateness for decentralized energy generation, positions it as a key participant in the global transition to sustainable energy solutions.
Renewable Energy End Uses
- Commercial
- Industrial
- Residential
- Others
The industrial business is predicted to be the most important end-use group in the renewable energy market forecast period, due to its large energy consumption and greater dedication to sustainability. Manufacturing, mining, and chemical processing firms are shifting to renewable energy sources including solar, wind, and bioenergy to lower operational costs and carbon footprints. Renewable energy offers businesses a cost-effective and dependable alternative to traditional fossil fuels, particularly when energy costs rise.
Furthermore, large-scale renewable energy facilities, such as solar farms and wind turbines, are increasingly designed to fulfill industrial requirements. Regulatory frameworks requiring emission reductions and business sustainability goals are accelerating implementation. Key industrial hubs in Europe, North America, and Asia-Pacific are substantially investing in renewable energy projects, establishing the industrial sector as a critical driver of renewable energy expansion worldwide.
Renewable Energy Market Regional Outlook
North America
- U.S.
- Canada
Europe
- U.K.
- Germany
- France
- Spain
- Rest of Europe
Asia-Pacific
- India
- Japan
- China
- Australia
- South Korea
- Rest of Asia-Pacific
Latin America
- Brazil
- Mexico
- Rest of Latin America
The Middle East & Africa
- South Africa
- GCC Countries
- Rest of the Middle East & Africa (ME&A)

Renewable Energy Market Regional Analysis
Asia-Pacific dominates the renewable energy market as a result of large investments, abundant renewable resources, and favorable government laws. Countries such as China and India are setting the pace, making significant contributions to the region's leadership. China, the world leader in solar and wind energy capacity, has set lofty targets to achieve carbon neutrality by 2060. Its large-scale solar farms and wind energy projects, such as the Tengger Desert Solar Park, demonstrate its dedication. India's National Solar Mission seeks to develop 500 GW of renewable capacity by 2030. Southeast Asian countries such as Vietnam and Indonesia are also aggressively boosting their renewable energy investments. Rising energy demand, driven by industrialization and urbanization, stimulates the market even more. Furthermore, the region's lower manufacturing costs for renewable technology have made it a global industrial hub, ensuring long-term growth.
North America is the region with the quickest growth during the renewable energy market forecast period, due to technological improvements, more government assistance, and an emphasis on decarburization. The United States leads the region with the Inflation Reduction Act of 2022, which provides $369 billion in energy security and climate benefits. Solar and wind energy account for the majority of new capacity expansions, with projects like Texas wind farms and Nevada solar facilities showing significant development. Canada is supporting this growth with large investments in hydroelectricity and wind power, particularly in Quebec and Alberta. Collaboration between the public and commercial sectors, combined with a growing interest in corporate renewable energy purchases, is hastening regional growth.
Renewable Energy Market Players
Some of the top renewable energy companies offered in our report include Ørsted, Vestas, Yingli Solar, GE, Enel Group, Canadian Solar Inc., SynTech Bioenergy, TATA Power, Siemens Gamesa, Tocardo BV, ABB, NextEra Energy, Inc., Ocean Power Technologies, Inc., and O2 Power.
Frequently Asked Questions
How big is the renewable energy market?
The renewable energy market size was valued at USD 1.24 Trillion in 2023.
What is the CAGR of the global renewable energy market from 2024 to 2032?
The CAGR of renewable energy is 9.1% during the analysis period of 2024 to 2032.
Which are the key players in the renewable energy market?
The key players operating in the global market are including �rsted, Vestas, Yingli Solar, GE, Enel Group, Canadian Solar Inc., SynTech Bioenergy, TATA Power, Siemens Gamesa, Tocardo BV, ABB, NextEra Energy, Inc., Ocean Power Technologies, Inc., and On Power.
Which region dominated the global renewable energy market share?
Asia-Pacific held the dominating position in renewable energy industry during the analysis period of 2024 to 2032.
Which region registered fastest CAGR from 2024 to 2032?
North America region exhibited fastest growing CAGR for market of renewable energy during the analysis period of 2024 to 2032.
What are the current trends and dynamics in the global renewable energy industry?
The current trends and dynamics in the renewable energy industry include growing government incentives and subsidies for clean energy adoption, increasing global demand for sustainable and environmentally friendly power solutions, technological advancements in energy storage and efficiency, and rising awareness about the impacts of climate change.
Which application held the maximum share in 2023?
The industrial application held the maximum share of the renewable energy industry.


