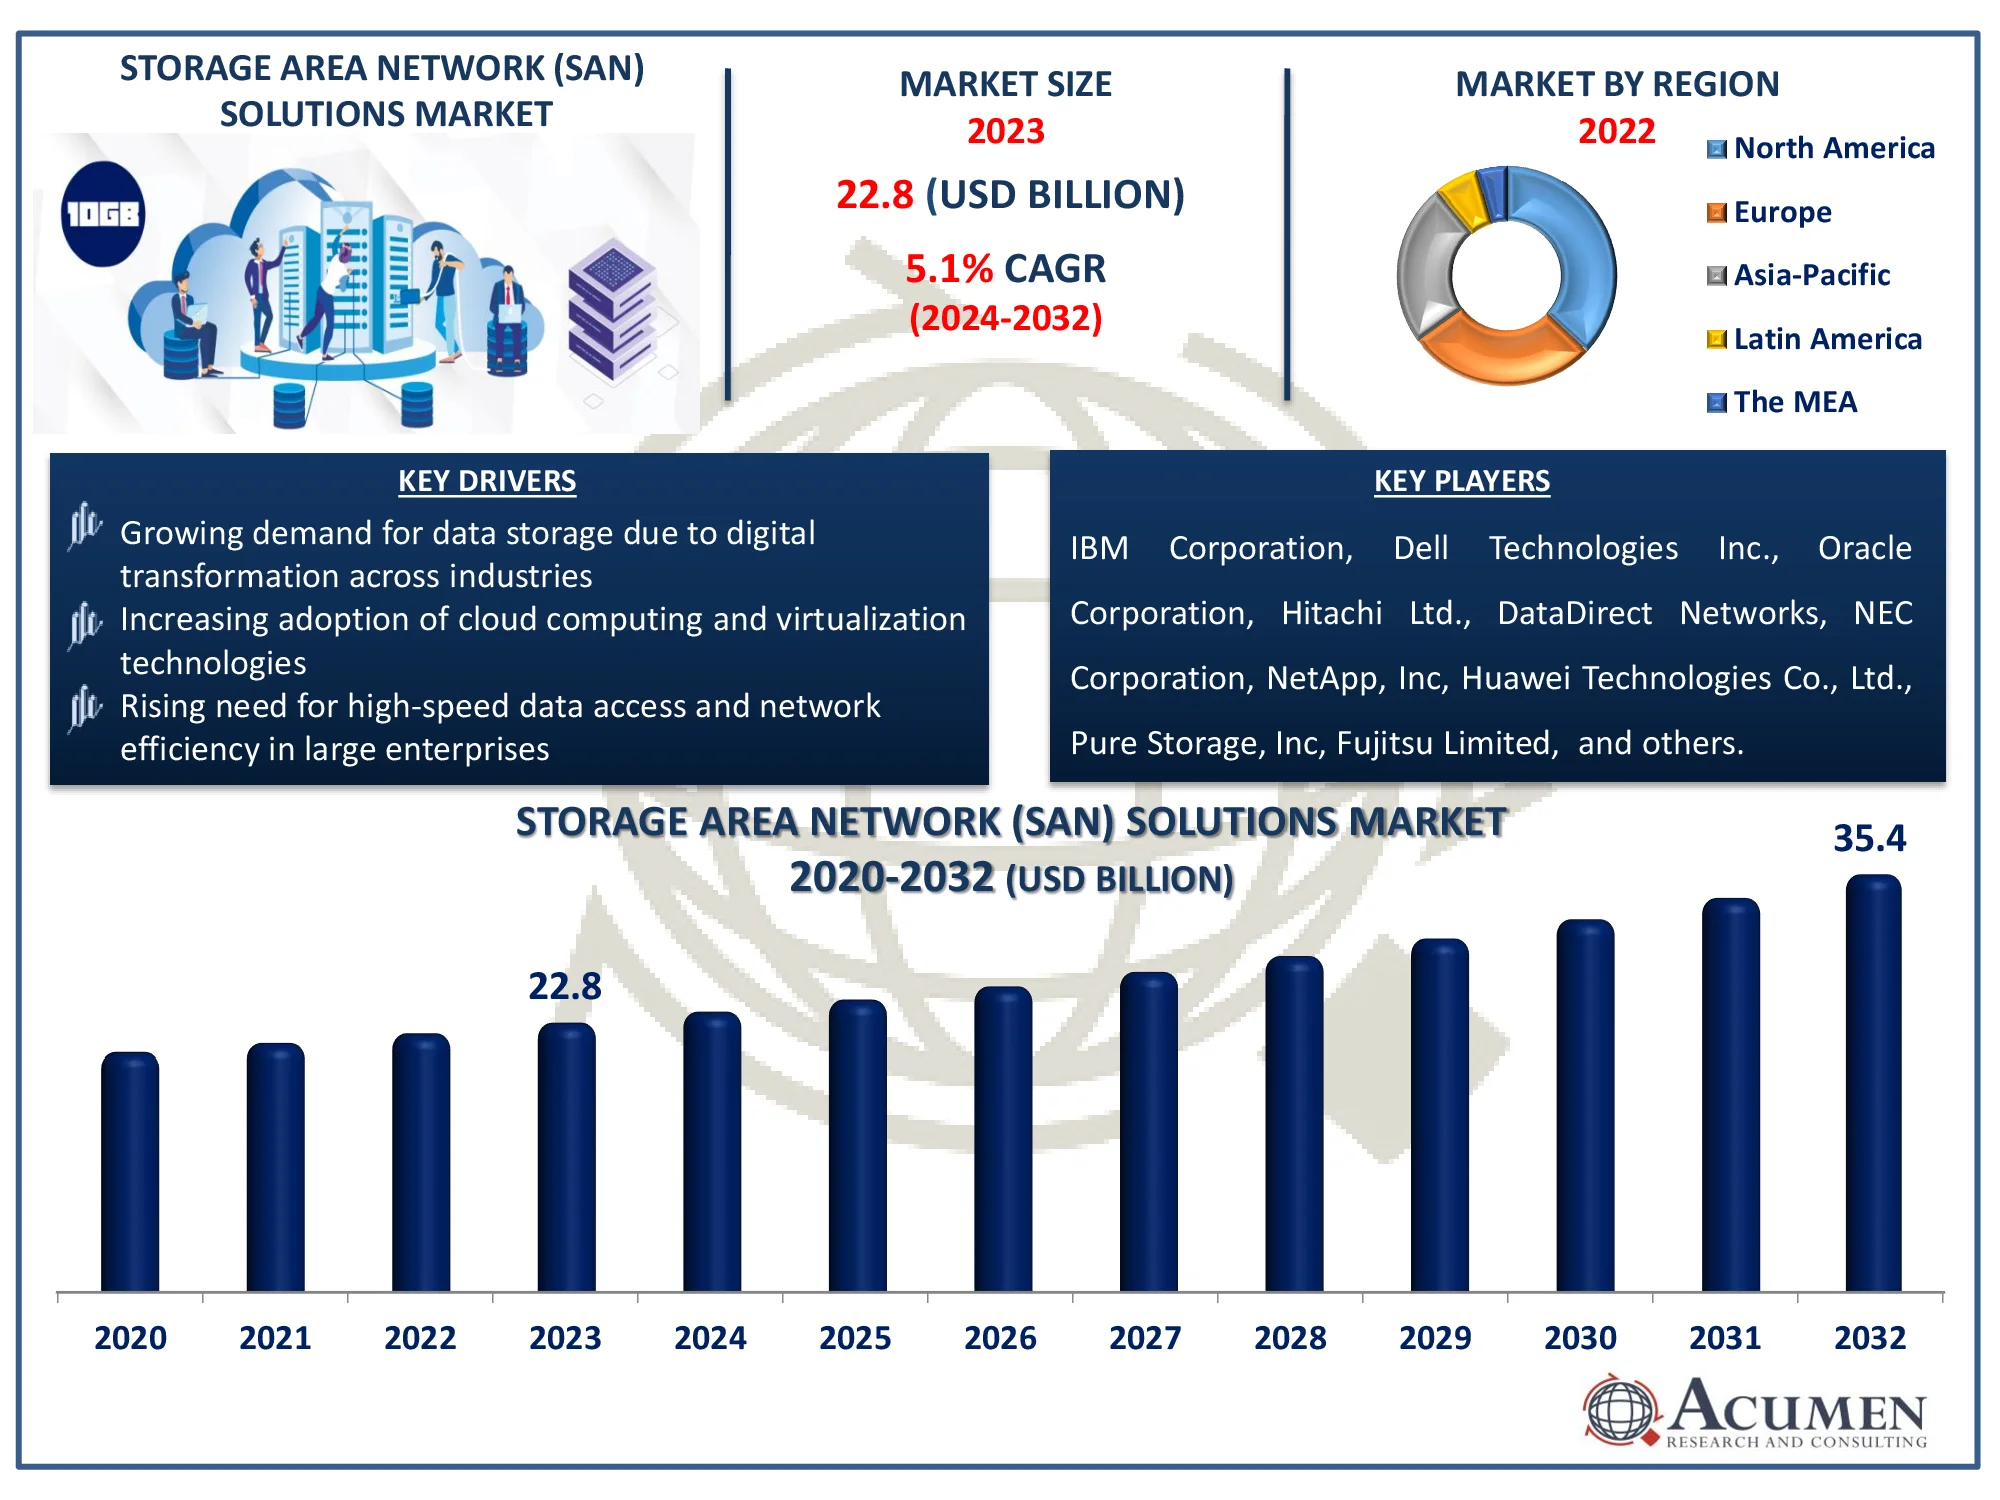
The global storage area network (SAN) solutions market is expected to grow at noteworthy CAGR around 4.5 % throughout the forecast period 2019 to 2026 and reach around US$ 24.4 billion by 2026.
The report provides analysis of global Storage area network (SAN) solutions market for the period 2016-2026, wherein 2019 to 2026 is the forecast period and 2017 is considered as the base year. Storage area network or SAN is a network of storing systems providing networked device block storage services. A storage area network is the solution used to provide high quality performance to many competitors. These solutions are used to store high volume transactional system or densely virtualized infrastructure. Technology and business advancement generates large amounts of data every day.
Industry Outlook
Stock area networks (SAN) are the most common networking storage architectures used by companies to provide high throughput and low latency for critical business applications. A SAN translates storage resources from the common user network and converts them to a high-performance, independent network. This allows every server to access shared storage as though it were a drive attached directly to the server. If a host wants access to a SAN storage device, it sends the storage device a block-based access request. A fast growing share of SAN deployments uses all-flash storage to achieve its high performance, consistently low latency and lower total cost than spinning disks. SANs allow companies to use consistent methodologies and tools for safety, data protection and disaster recovery through the storage of data in centralized shared storage. The growth of SAN solutions market is fuelled by growing cloud computing and data center solutions worldwide. In addition, fibre-optical solutions are expected to boost demand for fiber channels via SAN solutions based on Ethernet technology. In addition, increasing data center delivery by all types of companies is expected to contribute to market revenue growth. Likewise, in the technological segment of InfiniBand the forecast period is expected to see healthy growth. Probably because of the demand for high-performance Infini-Band technology and higher bandwidth offered by InfiniBand.
Market Dynamics
The progress of technology and business operations leads to excessive data generation on a daily basis. More servers, spaces, devices and associated hardware need to manage this large data efficiently, which requires a surcharge of costs for the data center infrastructure. The exponential growth of data is no longer possible thanks to redundant arrays of Inexpensive Disks (RAID) and other storage systems. SAN solutions are an effective solution to enable and accessibility of these enormous data. Focused data storage management solutions have opened doors for new entrants in the network solutions storage area market. The key factors responsible for driving the product within the small and medium-size business are the shared storage, centralized control and the flexibility to share capacity between multiple hostes. The global storage area network solutions market is expected to buckle higher ICT expenditures. These factors are likely to increase the demand for network solutions in storage areas and contribute to market growth in the forecast period. The low upgrade cost is also a major driver on the SAN server market. Massive amounts of data are produced daily to meet the needs for additional data center infrastructure. That creates complexity and additional infrastructure costs, as soon as a company achieves the maximum storage capacity. An infrastructure upgrade involves additional server costs, flash costs, storage subsystems, attached network storage costs or strong state drivers. The SAN technology minimizes these additional costs or upgrades as the storage of this system is based on low software costs and is independent from additional hardware storage.
Market of Storage Area Network (SAN) Solutions – Emergence of iSCSI
Fibre Channel (FC) SANs are complex and difficult to manage. iSCSI based on Ethernet reduce various challenges by encapsulating SCSI commands into non FC-connected IP packets. Due to the development of iSCSI, an organization can use its existing knowledge and infrastructure, both for LANs and for SANs, in place of learning, constructing and managing two networks–an Ethernet local area network (LAN) for user communication and a FC SAN for storage. In small and medium-sized enterprises with no funding or expertise for supporting a SAN fiber channel, this is particularly useful. These factors are expected to boost the global storage area network (SAN) solutions market during the forecast time frame.
Storage Area Network (SAN) Solutions Market- Regional Insights
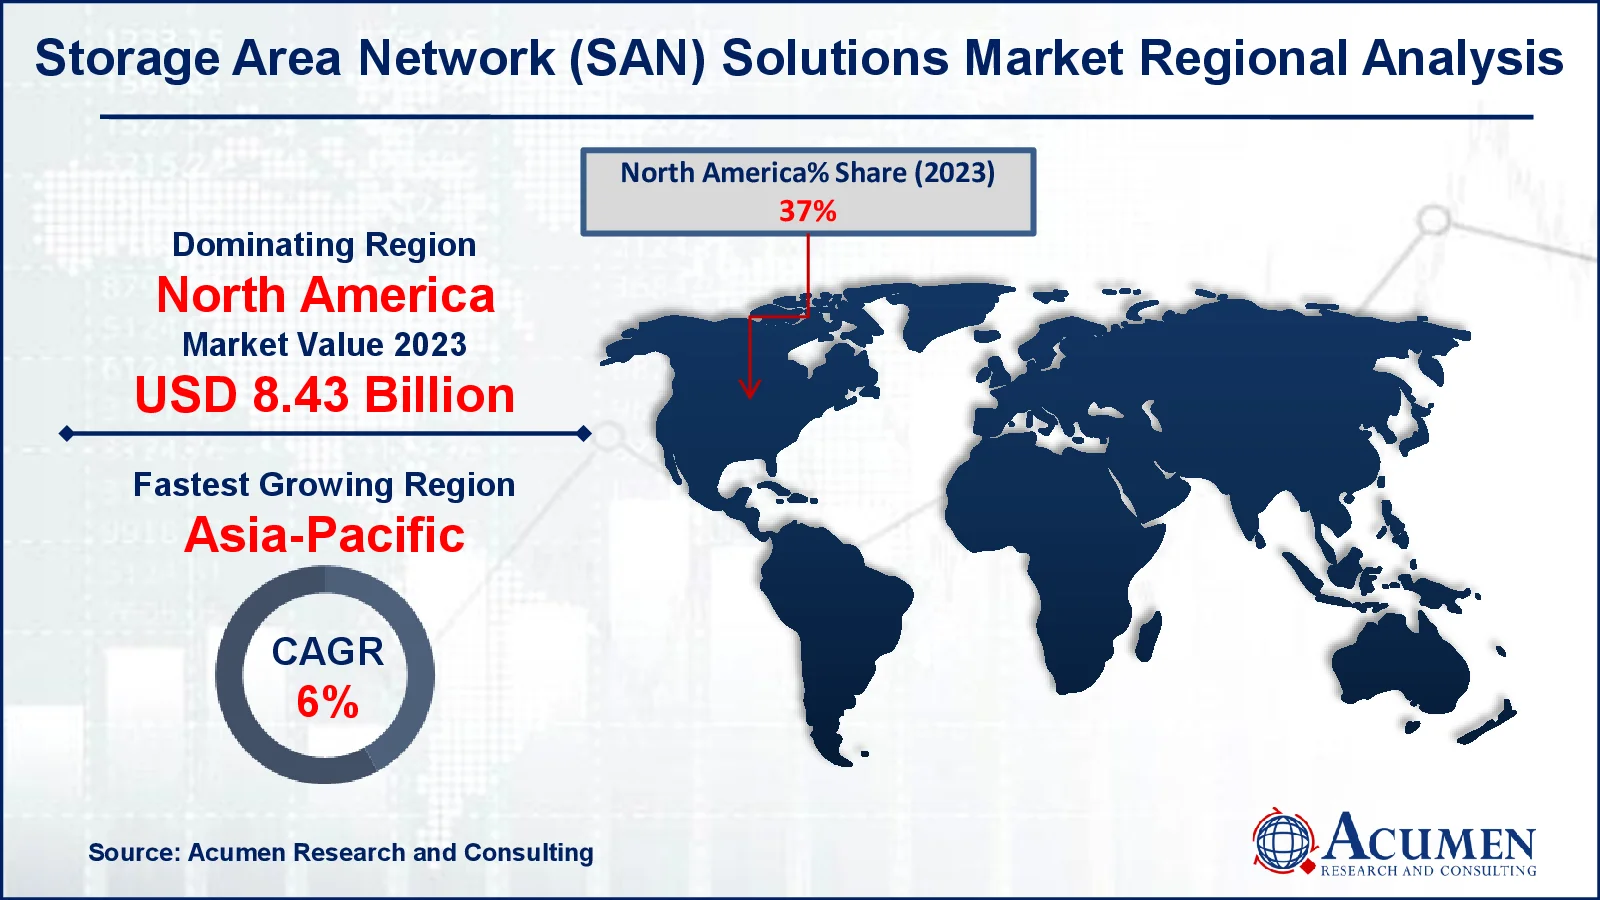
In the global SAN solutions market, North America holds a strong position with a significant market share in 2018. This is because SAN solutions are highly adopted in the region. The strong presence of SAN solution providers in the region also contributes to the sales growth of the market. Demand for SAN solutions is expected to grow in Europe, Asia-Pacific as a number of enterprises across these regions are growing, such as increasing technology adoption (cloud computing). Asia Pacific is expected to see growth in the SAN solutions market among these regions. This is mainly due, along with the increasing emphasis of SAN solution vendors on developing strong market presence, a strong increase in the IT investments of enterprises across industries. The forecast period also anticipates a significant increase in the markets in the Middle East & Africa (MEA) and South America.
Market Segmentation
Storage area network (SAN) solutions Market by Component
- Software
- Hardware
- Services
- Consulting
- System Integration
- Support
- Maintenance
Storage area network (SAN) solutions Market by Technology
- Fiber Channel (FC)
- Fiber Channel Over Ethernet (FCoE)
- InfiniBand
- iSCSI Protocol
Storage area network (SAN) solutions Market by End Use Industry
- BFSI
- Retail and E-commerce
- IT and Telecommunication
- Energy and Utility
- Government Offices
- Education
- Aerospace and Defense
- Healthcare
- Manufacturing
- Others (Transportation and Logistics)
Global Storage area network (SAN) solutions Market, by Geography
- Europe
- UK
- Germany
- France
- Rest of Europe
- Asia-Pacific
- China
- Japan
- India
- Australia
- Rest of Asia-Pacific
- Latin America
- Brazil
- Chile
- Rest of Latin America
- Middle East and Africa (MEA)
- South Africa
- Saudi Arabia
- Rest of MEA
The market research study on “Storage Area Network (SAN) Solutions Market (By Component: Software, Hardware, Services [Consulting, System Integration, Support, Maintenance], By Technology: Fiber Channel (FC), Fiber Channel Over Ethernet (FCoE), InfiniBand, iSCSI Protocol; By End Use Industry: BFSI, Retail and E-commerce, IT and Telecommunication, Energy and Utility, Government Offices, Education, Aerospace and Defense, Healthcare, Manufacturing, Others (Transportation and Logistics)) - Global Industry Analysis, Market Size, Opportunities and Forecast, 2019 - 2026” offers detailed insights on global storage area network (SAN) solutions market segments with market dynamics and their impact. The report provides insights on global Storage area network (SAN) solutions market by component, by technology, by end use industry and major geographic regions. The report also covers basic technology development policies.
The report offers an overview of the market and statistical diagrams to support the expected figures. Our analysts predict the market scope and future prospects in an insightful way. The Acumen Research and Consulting report contains a comprehensive analysis of the global market in Storage area network (SAN) solutions segmented. The report outlines numerous growth strategies implemented by companies as well as the latest market trends. The market share and current position of all leading players are discussed in detail. It analyzes players ' new revenue sources and highlights the different strategies.
Key Players and Strategies
The storage area network (SAN) solutions market is consolidated with large number of manufacturers. The company profiling of key players in the market includes major business strategies, company overview and revenues. The key players of the market are Dell Technologies Inc., IBM Corporation, Oracle Corporation, Hitachi Ltd., Huawei Technologies Co., Ltd., NetApp, Inc., NEC Corporation, Hewlett Packard Enterprise, Pure Storage, Inc., Fujitsu Limited, IDG Communications, Inc., DataDirect Networks and Cisco Systems, Inc.
With the attendance of many small and medium-sized manufacturers, the market is fragmented. The strong presence of local manufacturers and suppliers, particularly in China, is one of the main reasons for market fragmentation. In addition, companies focus on product adaptation, strategic partnerships and new customer acquisitions to gain more market shares.
A thorough study of the global Storage area network (SAN) solutions market is provided in a ARC report, while a rich analysis of the situation in the market is carried out, focusing on their drivers, opportunities, restrictions and trends. The report examines the outcome of the product in the industries and applications concerned. The global reports provide comprehensive data on procedures which current market vendors might try to gain momentum alongside an examination of new players ' entry points.
CHAPTER 1. INDUSTRY OVERVIEW
1.1. Definition and Scope
1.1.1. Definition of Storage Area Network (SAN) Solutions
1.1.2. Market Segmentation
1.1.3. List of Abbreviations
1.2. Summary
1.2.1. Market Snapshot
1.2.2. Storage Area Network (SAN) Solutions Market By Component
1.2.2.1. Global Storage Area Network (SAN) Solutions Market Revenue and Growth Rate Comparison By Component (2015-2026)
1.2.2.2. Global Storage Area Network (SAN) Solutions Market Revenue Share By Component in 2017
1.2.2.3. Software
1.2.2.4. Hardware
1.2.2.5. Services
1.2.2.5.1. Consulting
1.2.2.5.2. System Integration
1.2.2.5.3. Support
1.2.2.5.4. Maintenance
1.2.2.6. Others
1.2.3. Storage Area Network (SAN) Solutions Market By Technology
1.2.3.1. Global Storage Area Network (SAN) Solutions Market Revenue and Growth Rate Comparison By Technology (2015-2026)
1.2.3.2. Fiber Channel (FC)
1.2.3.3. Fiber Channel Over Ethernet (FCoE)
1.2.3.4. InfiniBand
1.2.3.5. ISCSI Protocol
1.2.3.6. Others
1.2.4. Storage Area Network (SAN) Solutions Market By End Use Industry
1.2.4.1. Global Storage Area Network (SAN) Solutions Market Revenue and Growth Rate Comparison By End Use Industry (2015-2026)
1.2.4.2. BFSI
1.2.4.3. Retail and E-commerce
1.2.4.4. IT and Telecommunication
1.2.4.5. Energy and Utility
1.2.4.6. Government Offices
1.2.4.7. Education
1.2.4.8. Aerospace and Defense
1.2.4.9. Healthcare
1.2.4.10. Manufacturing
1.2.4.11. Others (Transportation and Logistics)
1.2.5. Storage Area Network (SAN) Solutions Market by Geography
1.2.5.1. Global Storage Area Network (SAN) Solutions Market Revenue and Growth Rate Comparison by Geography (2015-2026)
1.2.5.2. North America Storage Area Network (SAN) Solutions Market Revenue and Growth Rate (2015-2026)
1.2.5.3. Europe Storage Area Network (SAN) Solutions Market Revenue and Growth Rate (2015-2026)
1.2.5.4. Asia-Pacific Storage Area Network (SAN) Solutions Market Revenue and Growth Rate (2015-2026)
1.2.5.5. Latin America Storage Area Network (SAN) Solutions Market Revenue and Growth Rate (2015-2026)
1.2.5.6. Middle East and Africa (MEA) Storage Area Network (SAN) Solutions Market Revenue and Growth Rate (2015-2026)
CHAPTER 2. MARKET DYNAMICS AND COMPETITION ANALYSIS
2.1. Market Drivers
2.2. Restraints and Challenges
2.3. Growth Opportunities
2.4. Porter’s Five Forces Analysis
2.4.1. Bargaining Power of Suppliers
2.4.2. Bargaining Power of Buyers
2.4.3. Threat of Substitute
2.4.4. Threat of New Entrants
2.4.5. Degree of Competition
2.5. Value Chain Analysis
2.6. Cost Structure Analysis
2.6.1. Raw Material and Suppliers
2.6.2. Manufacturing Process Analysis
2.7. Regulatory Compliance
2.8. Competitive Landscape, 2017
2.8.1. Player Positioning Analysis
2.8.2. Key Strategies Adopted By Leading Players
CHAPTER 3. MANUFACTURING PLANTS ANALYSIS
3.1. Capacity and Commercial Production Date of Global Storage Area Network (SAN) Solutions Major Manufacturers in 2017
3.2. Manufacturing Plants Distribution of Global Storage Area Network (SAN) Solutions Major Manufacturers in 2017
3.3. R&D Status and Technology Source of Global Storage Area Network (SAN) Solutions Major Manufacturers in 2017
3.4. Raw Materials Sources Analysis of Global Storage Area Network (SAN) Solutions Major Manufacturers in 2017
CHAPTER 4. STORAGE AREA NETWORK (SAN) SOLUTIONS MARKET BY COMPONENT
4.1. Global Storage Area Network (SAN) Solutions Revenue By Component
4.2. Software
4.2.1. Market Revenue and Growth Rate, 2015 - 2026 ($Million)
4.2.2. Market Revenue and Forecast, By Region, 2015 - 2026 ($Million)
4.3. Hardware
4.3.1. Market Revenue and Growth Rate, 2015 - 2026 ($Million)
4.3.2. Market Revenue and Forecast, By Region, 2015 - 2026 ($Million)
4.4. Services
4.4.1. Market Revenue and Growth Rate, 2015 - 2026 ($Million)
4.4.2. Market Revenue and Forecast, By Region, 2015 - 2026 ($Million)
4.4.2.1. Consulting
4.4.2.2. System Integration
4.4.2.3. Support
4.4.2.4. Maintenance
4.5. Other
4.5.1. Market Revenue and Growth Rate, 2015 - 2026 ($Million)
4.5.2. Market Revenue and Forecast, By Region, 2015 - 2026 ($Million)
CHAPTER 5. STORAGE AREA NETWORK (SAN) SOLUTIONS MARKET BY TECHNOLOGY
5.1. Global Storage Area Network (SAN) Solutions Revenue By Technology
5.2. Fiber Channel (FC)
5.2.1. Market Revenue and Growth Rate, 2015 - 2026 ($Million)
5.2.2. Market Revenue and Forecast, By Region, 2015 - 2026 ($Million)
5.3. Fiber Channel Over Ethernet (FCoE)
5.3.1. Market Revenue and Growth Rate, 2015 - 2026 ($Million)
5.3.2. Market Revenue and Forecast, By Region, 2015 - 2026 ($Million)
5.4. InfiniBand
5.4.1. Market Revenue and Growth Rate, 2015 - 2026 ($Million)
5.4.2. Market Revenue and Forecast, By Region, 2015 - 2026 ($Million)
5.5. ISCSI Protocol
5.5.1. Market Revenue and Growth Rate, 2015 - 2026 ($Million)
5.5.2. Market Revenue and Forecast, By Region, 2015 - 2026 ($Million)
5.6. Others
5.6.1. Market Revenue and Growth Rate, 2015 - 2026 ($Million)
5.6.2. Market Revenue and Forecast, By Region, 2015 - 2026 ($Million)
CHAPTER 6. STORAGE AREA NETWORK (SAN) SOLUTIONS MARKET BY END USE INDUSTRY
6.1. Global Storage Area Network (SAN) Solutions Revenue By End Use Industry
6.2. BFSI
6.2.1. Market Revenue and Growth Rate, 2015 - 2026 ($Million)
6.2.2. Market Revenue and Forecast, By Region, 2015 - 2026 ($Million)
6.3. Retail and E-commerce
6.3.1. Market Revenue and Growth Rate, 2015 - 2026 ($Million)
6.3.2. Market Revenue and Forecast, By Region, 2015 - 2026 ($Million)
6.4. IT and Telecommunication
6.4.1. Market Revenue and Growth Rate, 2015 - 2026 ($Million)
6.4.2. Market Revenue and Forecast, By Region, 2015 - 2026 ($Million)
6.5. Energy and Utility
6.5.1. Market Revenue and Growth Rate, 2015 - 2026 ($Million)
6.5.2. Market Revenue and Forecast, By Region, 2015 - 2026 ($Million)
6.6. Government Offices
6.6.1. Market Revenue and Growth Rate, 2015 - 2026 ($Million)
6.6.2. Market Revenue and Forecast, By Region, 2015 - 2026 ($Million)
6.7. Education
6.7.1. Market Revenue and Growth Rate, 2015 - 2026 ($Million)
6.7.2. Market Revenue and Forecast, By Region, 2015 - 2026 ($Million)
6.8. Aerospace and Defense
6.8.1. Market Revenue and Growth Rate, 2015 - 2026 ($Million)
6.8.2. Market Revenue and Forecast, By Region, 2015 - 2026 ($Million)
6.9. Healthcare
6.9.1. Market Revenue and Growth Rate, 2015 - 2026 ($Million)
6.9.2. Market Revenue and Forecast, By Region, 2015 - 2026 ($Million)
6.10. Manufacturing
6.10.1. Market Revenue and Growth Rate, 2015 - 2026 ($Million)
6.10.2. Market Revenue and Forecast, By Region, 2015 - 2026 ($Million)
6.11. Others (Transportation and Logistics)
6.11.1. Market Revenue and Growth Rate, 2015 - 2026 ($Million)
6.11.2. Market Revenue and Forecast, By Region, 2015 - 2026 ($Million)
CHAPTER 7. NORTH AMERICA STORAGE AREA NETWORK (SAN) SOLUTIONS MARKET BY COUNTRY
7.1. North America Storage Area Network (SAN) Solutions Market Revenue and Growth Rate, 2015 - 2026 ($Million)
7.2. North America Storage Area Network (SAN) Solutions Market Revenue Share Comparison, 2015 & 2026 (%)
7.3. U.S.
7.3.1. U.S. Storage Area Network (SAN) Solutions Market Revenue and Forecast By Component, 2015 - 2026 ($Million)
7.3.2. Market Revenue and Forecast By Technology, 2015 - 2026 ($Million)
7.3.3. Market Revenue and Forecast By End Use Industry, 2015 - 2026 ($Million)
7.4. Canada
7.4.1. Market Revenue and Forecast By Component, 2015 - 2026 ($Million)
7.4.2. Market Revenue and Forecast By Technology, 2015 - 2026 ($Million)
7.4.3. Market Revenue and Forecast By End Use Industry, 2015 - 2026 ($Million)
7.5. Mexico
7.5.1. Market Revenue and Forecast By Component, 2015 - 2026 ($Million)
7.5.2. Market Revenue and Forecast By Technology, 2015 - 2026 ($Million)
7.5.3. Market Revenue and Forecast By End Use Industry, 2015 - 2026 ($Million)
CHAPTER 8. EUROPE STORAGE AREA NETWORK (SAN) SOLUTIONS MARKET BY COUNTRY
8.1. Europe Storage Area Network (SAN) Solutions Market Revenue and Growth Rate, 2015 - 2026 ($Million)
8.2. Europe Storage Area Network (SAN) Solutions Market Revenue Share Comparison, 2015 & 2026 (%)
8.3. UK
8.3.1. Market Revenue and Forecast By Component, 2015 - 2026 ($Million)
8.3.2. Market Revenue and Forecast By Technology, 2015 - 2026 ($Million)
8.3.3. Market Revenue and Forecast By End Use Industry, 2015 - 2026 ($Million)
8.4. Germany
8.4.1. Market Revenue and Forecast By Component, 2015 - 2026 ($Million)
8.4.2. Market Revenue and Forecast By Technology, 2015 - 2026 ($Million)
8.4.3. Market Revenue and Forecast By End Use Industry, 2015 - 2026 ($Million)
8.5. France
8.5.1. Market Revenue and Forecast By Component, 2015 - 2026 ($Million)
8.5.2. Market Revenue and Forecast By Technology, 2015 - 2026 ($Million)
8.5.3. Market Revenue and Forecast By End Use Industry, 2015 - 2026 ($Million)
8.6. Spain
8.6.1. Market Revenue and Forecast By Component, 2015 - 2026 ($Million)
8.6.2. Market Revenue and Forecast By Technology, 2015 - 2026 ($Million)
8.6.3. Market Revenue and Forecast By End Use Industry, 2015 - 2026 ($Million)
8.7. Rest of Europe
8.7.1. Market Revenue and Forecast By Component, 2015 - 2026 ($Million)
8.7.2. Market Revenue and Forecast By Technology, 2015 - 2026 ($Million)
8.7.3. Market Revenue and Forecast By End Use Industry, 2015 - 2026 ($Million)
CHAPTER 9. ASIA-PACIFIC STORAGE AREA NETWORK (SAN) SOLUTIONS MARKET BY COUNTRY
9.1. Asia-Pacific Storage Area Network (SAN) Solutions Market Revenue and Growth Rate, 2015 - 2026 ($Million)
9.2. Asia-Pacific Storage Area Network (SAN) Solutions Market Revenue Share Comparison, 2015 & 2026 (%)
9.3. China
9.3.1. Market Revenue and Forecast By Component, 2015 - 2026 ($Million)
9.3.2. Market Revenue and Forecast By Technology, 2015 - 2026 ($Million)
9.3.3. Market Revenue and Forecast By End Use Industry, 2015 - 2026 ($Million)
9.4. Japan
9.4.1. Market Revenue and Forecast By Component, 2015 - 2026 ($Million)
9.4.2. Market Revenue and Forecast By Technology, 2015 - 2026 ($Million)
9.4.3. Market Revenue and Forecast By End Use Industry, 2015 - 2026 ($Million)
9.5. India
9.5.1. Market Revenue and Forecast By Component, 2015 - 2026 ($Million)
9.5.2. Market Revenue and Forecast By Technology, 2015 - 2026 ($Million)
9.5.3. Market Revenue and Forecast By End Use Industry, 2015 - 2026 ($Million)
9.6. Australia
9.6.1. Market Revenue and Forecast By Component, 2015 - 2026 ($Million)
9.6.2. Market Revenue and Forecast By Technology, 2015 - 2026 ($Million)
9.6.3. Market Revenue and Forecast By End Use Industry, 2015 - 2026 ($Million)
9.7. South Korea
9.7.1. Market Revenue and Forecast By Component, 2015 - 2026 ($Million)
9.7.2. Market Revenue and Forecast By Technology, 2015 - 2026 ($Million)
9.7.3. Market Revenue and Forecast By End Use Industry, 2015 - 2026 ($Million)
9.8. Rest of Asia-Pacific
9.8.1. Market Revenue and Forecast By Component, 2015 - 2026 ($Million)
9.8.2. Market Revenue and Forecast By Technology, 2015 - 2026 ($Million)
9.8.3. Market Revenue and Forecast By End Use Industry, 2015 - 2026 ($Million)
CHAPTER 10. LATIN AMERICA STORAGE AREA NETWORK (SAN) SOLUTIONS MARKET BY COUNTRY
10.1. Latin America Storage Area Network (SAN) Solutions Market Revenue and Growth Rate, 2015 - 2026 ($Million)
10.2. Latin America Storage Area Network (SAN) Solutions Market Revenue Share Comparison, 2015 & 2026 (%)
10.3. Brazil
10.3.1. Market Revenue and Forecast By Component, 2015 - 2026 ($Million)
10.3.2. Market Revenue and Forecast By Technology, 2015 - 2026 ($Million)
10.3.3. Market Revenue and Forecast By End Use Industry, 2015 - 2026 ($Million)
10.4. Argentina
10.4.1. Market Revenue and Forecast By Component, 2015 - 2026 ($Million)
10.4.2. Market Revenue and Forecast By Technology, 2015 - 2026 ($Million)
10.4.3. Market Revenue and Forecast By End Use Industry, 2015 - 2026 ($Million)
10.5. Rest of Latin America
10.5.1. Market Revenue and Forecast By Component, 2015 - 2026 ($Million)
10.5.2. Market Revenue and Forecast By Technology, 2015 - 2026 ($Million)
10.5.3. Market Revenue and Forecast By End Use Industry, 2015 - 2026 ($Million)
CHAPTER 11. MIDDLE EAST STORAGE AREA NETWORK (SAN) SOLUTIONS MARKET BY COUNTRY
11.1. Middle East Storage Area Network (SAN) Solutions Market Revenue and Growth Rate, 2015 - 2026 ($Million)
11.2. Middle East Storage Area Network (SAN) Solutions Market Revenue Share Comparison, 2015 & 2026 (%)
11.3. Saudi Arabia
11.3.1. Market Revenue and Forecast By Component, 2015 - 2026 ($Million)
11.3.2. Market Revenue and Forecast By Technology, 2015 - 2026 ($Million)
11.3.3. Market Revenue and Forecast By End Use Industry, 2015 - 2026 ($Million)
11.4. UAE
11.4.1. Market Revenue and Forecast By Component, 2015 - 2026 ($Million)
11.4.2. Market Revenue and Forecast By Technology, 2015 - 2026 ($Million)
11.4.3. Market Revenue and Forecast By End Use Industry, 2015 - 2026 ($Million)
11.5. Rest of Middle East
11.5.1. Market Revenue and Forecast By Component, 2015 - 2026 ($Million)
11.5.2. Market Revenue and Forecast By Technology, 2015 - 2026 ($Million)
11.5.3. Market Revenue and Forecast By End Use Industry, 2015 - 2026 ($Million)
CHAPTER 12. AFRICA STORAGE AREA NETWORK (SAN) SOLUTIONS MARKET BY COUNTRY
12.1. Africa Storage Area Network (SAN) Solutions Market Revenue and Growth Rate, 2015 - 2026 ($Million)
12.2. Africa Storage Area Network (SAN) Solutions Market Revenue Share Comparison, 2015 & 2026 (%)
12.3. South Africa
12.3.1. Market Revenue and Forecast By Component, 2015 - 2026 ($Million)
12.3.2. Market Revenue and Forecast By Technology, 2015 - 2026 ($Million)
12.3.3. Market Revenue and Forecast By End Use Industry, 2015 - 2026 ($Million)
12.4. Egypt
12.4.1. Market Revenue and Forecast By Component, 2015 - 2026 ($Million)
12.4.2. Market Revenue and Forecast By Technology, 2015 - 2026 ($Million)
12.4.3. Market Revenue and Forecast By End Use Industry, 2015 - 2026 ($Million)
12.5. Rest of Africa
12.5.1. Market Revenue and Forecast By Component, 2015 - 2026 ($Million)
12.5.2. Market Revenue and Forecast By Technology, 2015 - 2026 ($Million)
12.5.3. Market Revenue and Forecast By End Use Industry, 2015 - 2026 ($Million)
CHAPTER 13. COMPANY PROFILE
13.1. Dell Technologies Inc.
13.1.1. Company Snapshot
13.1.2. Overview
13.1.3. Financial Overview
13.1.4. Type Portfolio
13.1.5. Key Developments
13.1.6. Strategies
13.2. IBM Corporation
13.2.1. Company Snapshot
13.2.2. Overview
13.2.3. Financial Overview
13.2.4. Type Portfolio
13.2.5. Key Developments
13.2.6. Strategies
13.3. Oracle Corporation
13.3.1. Company Snapshot
13.3.2. Overview
13.3.3. Financial Overview
13.3.4. Type Portfolio
13.3.5. Key Developments
13.3.6. Strategies
13.4. Hitachi Ltd.
13.4.1. Company Snapshot
13.4.2. Overview
13.4.3. Financial Overview
13.4.4. Type Portfolio
13.4.5. Key Developments
13.4.6. Strategies
13.5. Huawei Technologies Co., Ltd.
13.5.1. Company Snapshot
13.5.2. Overview
13.5.3. Financial Overview
13.5.4. Type Portfolio
13.5.5. Key Developments
13.5.6. Strategies
13.6. NetApp, Inc.
13.6.1. Company Snapshot
13.6.2. Overview
13.6.3. Financial Overview
13.6.4. Type Portfolio
13.6.5. Key Developments
13.6.6. Strategies
13.7. NEC Corporation
13.7.1. Company Snapshot
13.7.2. Overview
13.7.3. Financial Overview
13.7.4. Type Portfolio
13.7.5. Key Developments
13.7.6. Strategies
13.8. Hewlett Packard Enterprise
13.8.1. Company Snapshot
13.8.2. Overview
13.8.3. Financial Overview
13.8.4. Type Portfolio
13.8.5. Key Developments
13.8.6. Strategies
13.9. Pure Storage, Inc.
13.9.1. Company Snapshot
13.9.2. Overview
13.9.3. Financial Overview
13.9.4. Type Portfolio
13.9.5. Key Developments
13.9.6. Strategies
13.10. Fujitsu Limited
13.10.1. Company Snapshot
13.10.2. Overview
13.10.3. Financial Overview
13.10.4. Type Portfolio
13.10.5. Key Developments
13.10.6. Strategies
13.11. IDG Communications, Inc.
13.11.1. Company Snapshot
13.11.2. Overview
13.11.3. Financial Overview
13.11.4. Type Portfolio
13.11.5. Key Developments
13.11.6. Strategies
13.12. DataDirect Networks
13.12.1. Company Snapshot
13.12.2. Overview
13.12.3. Financial Overview
13.12.4. Type Portfolio
13.12.5. Key Developments
13.12.6. Strategies
13.13. Cisco Systems, Inc.
13.13.1. Company Snapshot
13.13.2. Overview
13.13.3. Financial Overview
13.13.4. Type Portfolio
13.13.5. Key Developments
13.13.6. Strategies
13.14. Others
13.14.1. Company Snapshot
13.14.2. Overview
13.14.3. Financial Overview
13.14.4. Type Portfolio
13.14.5. Key Developments
13.14.6. Strategies
CHAPTER 14. RESEARCH APPROACH
14.1. Research Methodology
14.1.1. Initial Data Search
14.1.2. Secondary Research
14.1.3. Primary Research
14.2. Assumptions and Scope