Software-Defined Wide Area Network Market Size - Global Industry, Share, Analysis, Trends and Forecast 2024 - 2032
Published :
Report ID:
Pages :
Format :
Software-Defined Wide Area Network Market Size - Global Industry, Share, Analysis, Trends and Forecast 2024 - 2032
Report Coverage
- Industry Dynamics
- Market Size and Forecast Data
- Segment Analysis
- Competitive Landscape
- Regional Analysis with a Niche Focus on Country-Level Data
- High Level Analysis - Porter's, PESTEL, Value Chain, etc.
- Company Profiles of Key Players
- Option to Customize the Report As Per Your Specific Need
Request Sample Report
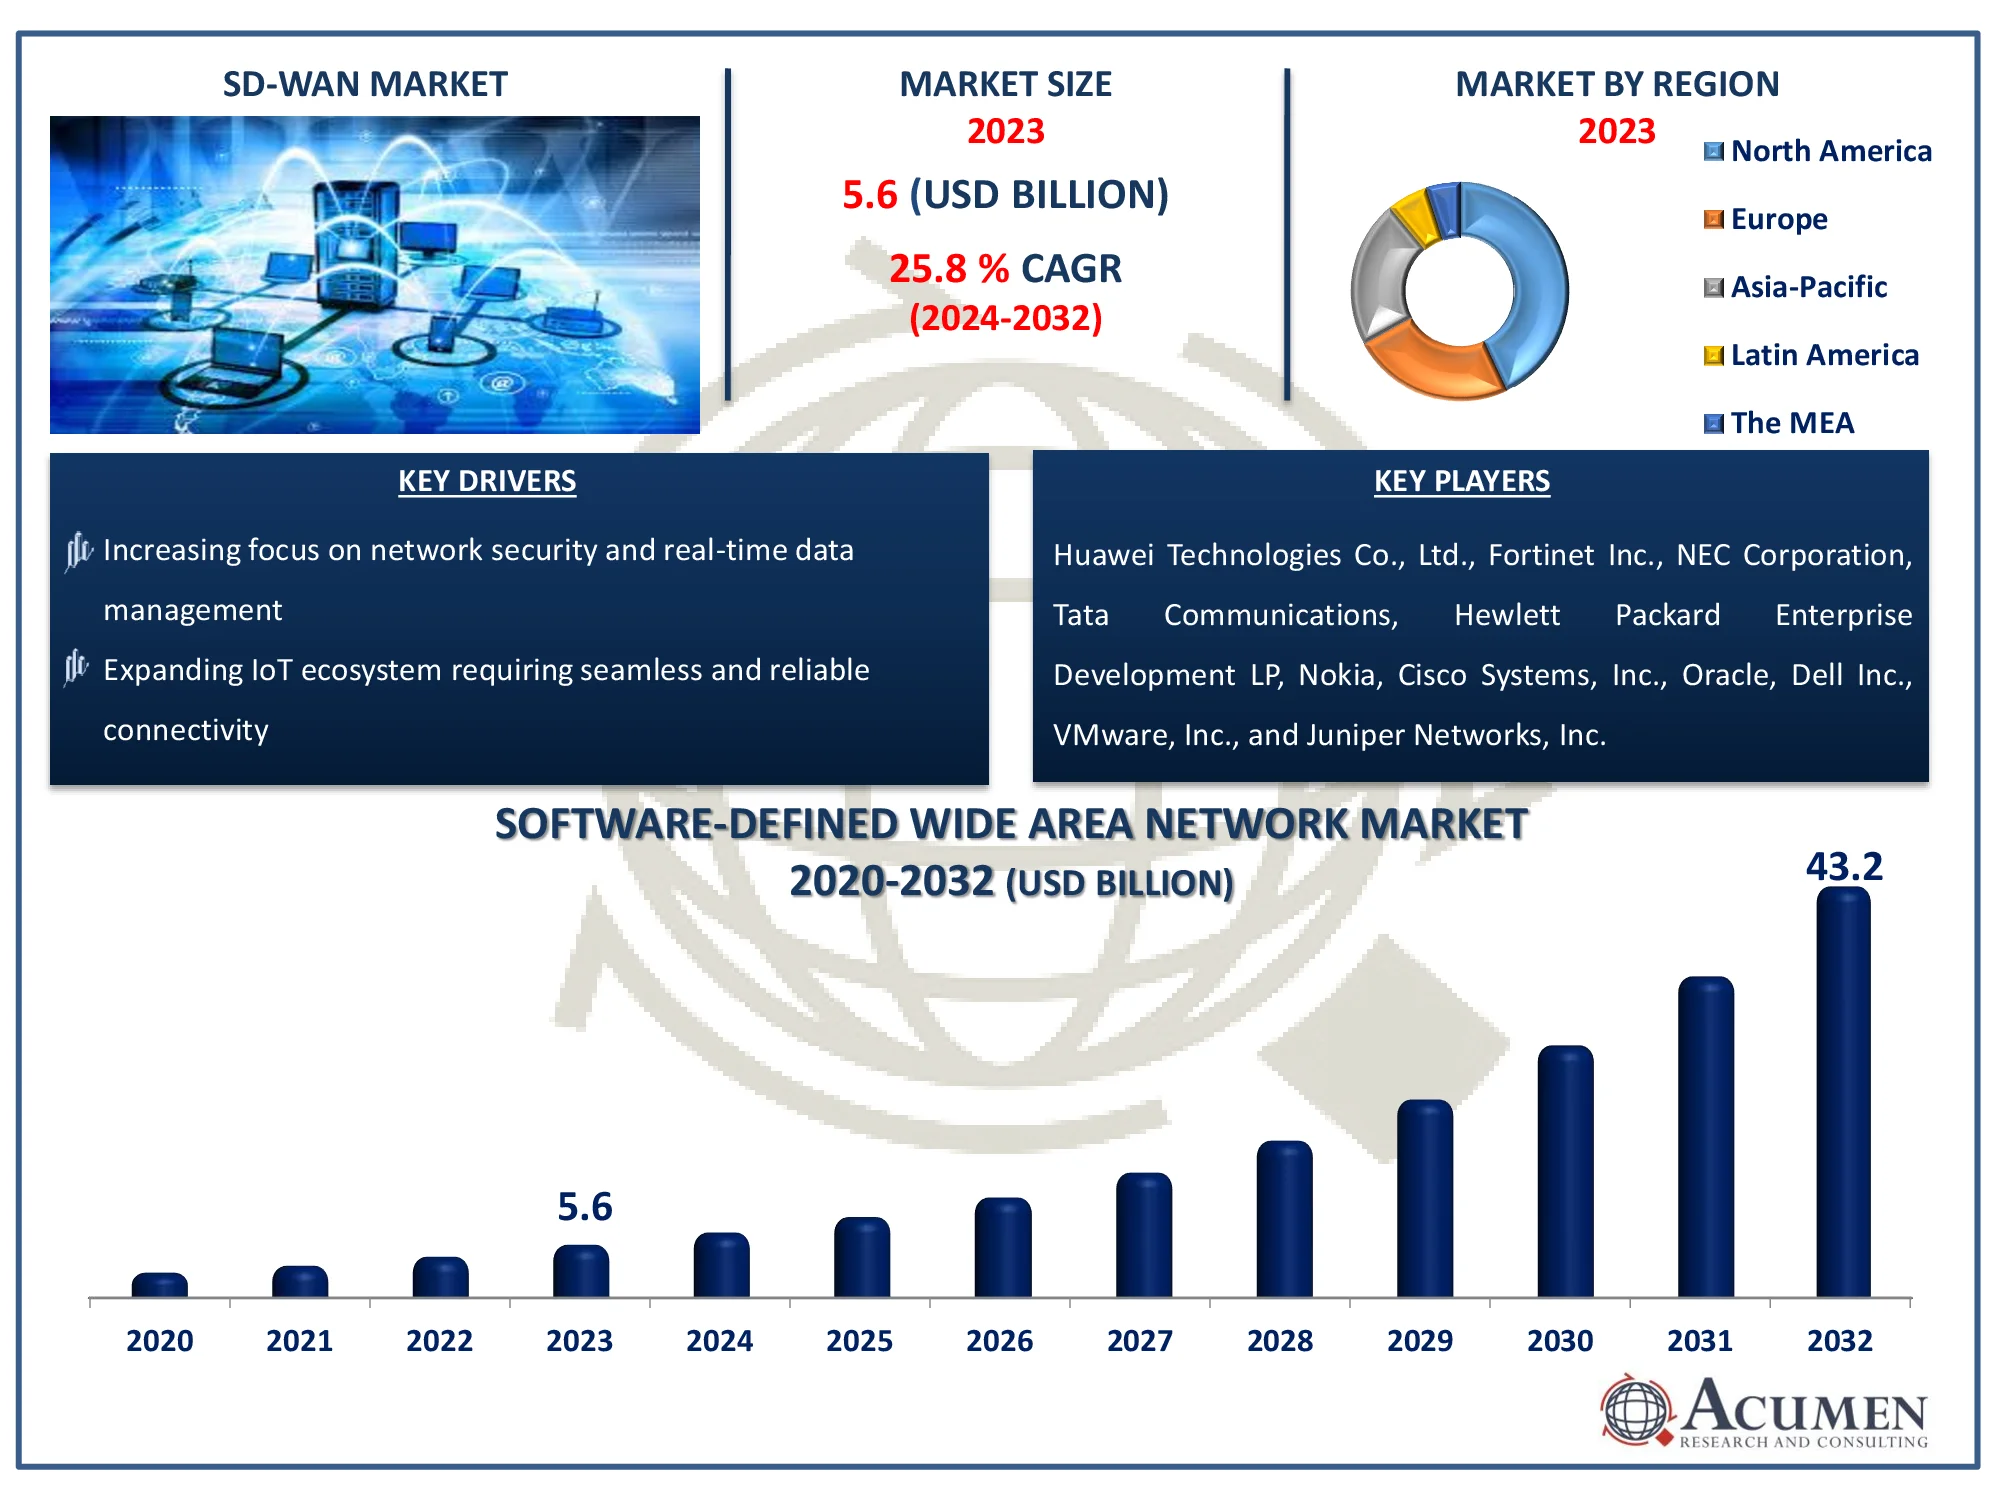
The Global Software-Defined Wide Area Network Market Size accounted for USD 5.6 Billion in 2023 and is estimated to achieve a market size of USD 43.2 Billion by 2032 growing at a CAGR of 25.8% from 2024 to 2032.
Software-Defined Wide Area Network Market Highlights
- Global software-defined wide area network market revenue is poised to garner USD 43.2 billion by 2032 with a CAGR of 25.8% from 2024 to 2032
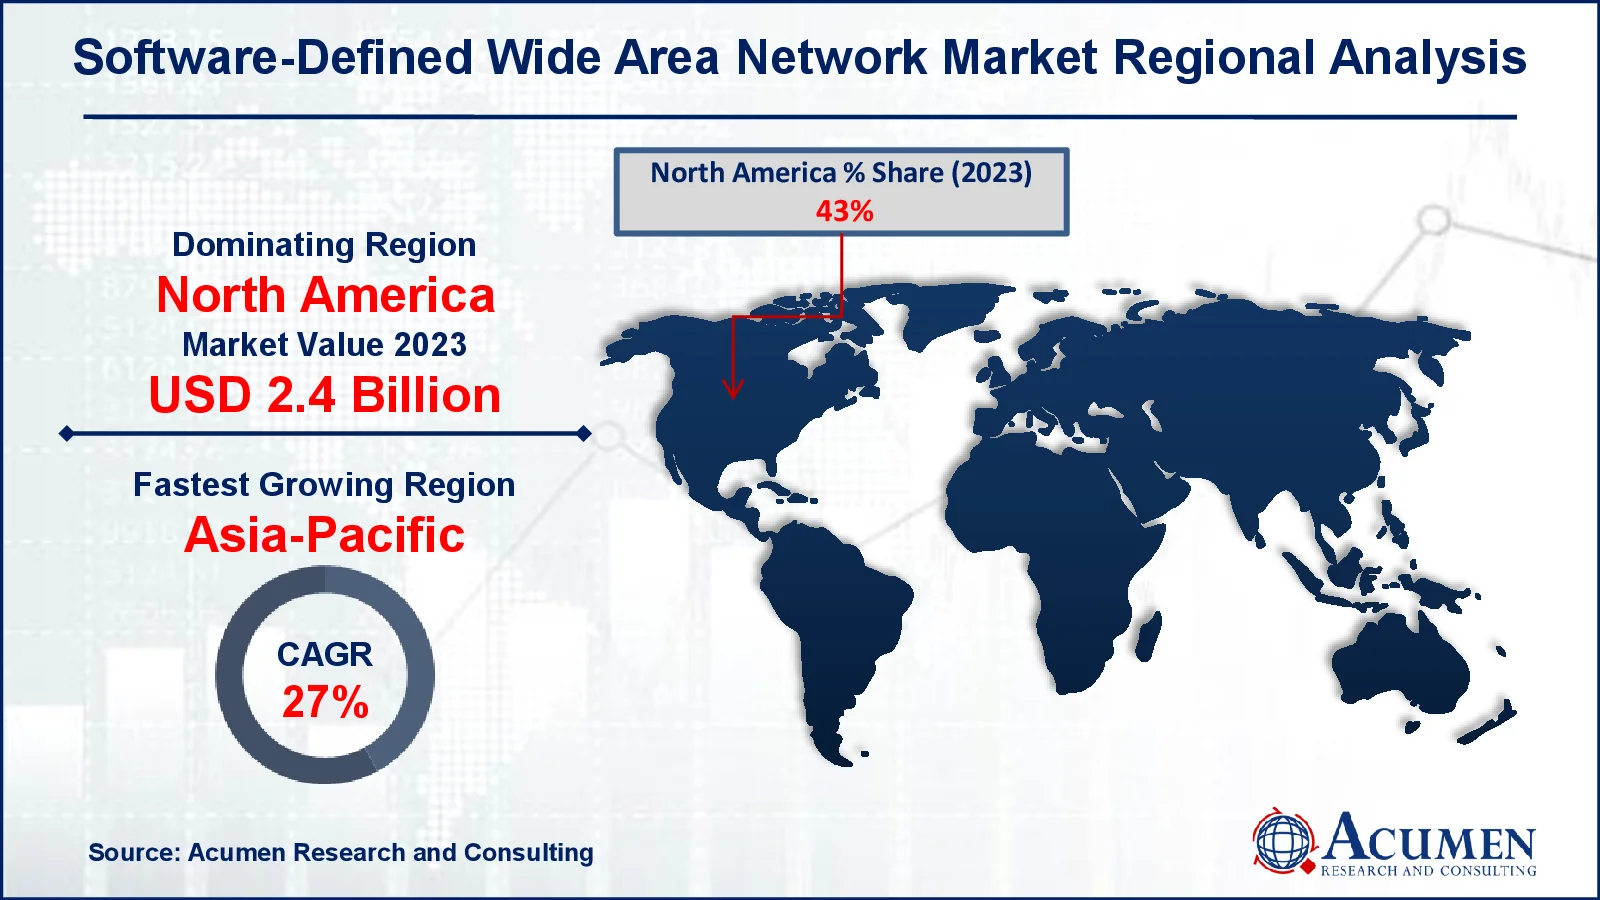
- North America software-defined wide area network market value occupied around USD 2.4 billion in 2023
- Asia-Pacific software-defined wide area network market growth will record a CAGR of more than 27% from 2024 to 2032
- Among component, the solution sub-segment generated more than USD 3.5 billion revenue in 2023
- Based on deployment, the on-premise sub-segment generated around 68% market share in 2023
- Development of innovative motor technologies for niche applications is a popular software-defined wide area network market trend that fuels the industry demand

SD-WAN is an SDN application that uses software and virtualization technologies to create a faster and more reliable WAN network. Whereas SDN concentrates more on the internal network, SD-WAN offers WAN connections between devices and networks. When businesses seek to meet their network infrastructure's changing needs in order to meet them, the market for SD-WAN is growing rapidly. The recent outbreak of COVID-19 allows companies to work from their home. The increase of home work is positive for the growth of the market because the technology is used to manage the growing use of the network and traffic efficiently.
Global Software-Defined Wide Area Network Market Dynamics
Market Drivers
- Growing adoption of cloud-based applications driving the need for enhanced network performance
- Rising demand for cost-efficient and scalable network solutions
- Increasing focus on network security and real-time data management
- Expanding IoT ecosystem requiring seamless and reliable connectivity
Market Restraints
- High initial implementation and integration costs
- Limited expertise and awareness among small and medium enterprises (SMEs)
- Security concerns associated with centralized network management
Market Opportunities
- Growing investments in 5G technology to enhance SD-WAN adoption
- Increasing demand for hybrid and multi-cloud environments
- Emergence of AI-driven network management solutions
- Expanding opportunities in emerging markets with rising internet penetration
Software-Defined Wide Area Network Market Report Coverage
|
Market |
Software-Defined Wide Area Network Market |
|
Software-Defined Wide Area Network Market Size 2023 |
USD 5.6 Billion |
|
Software-Defined Wide Area Network Market Forecast 2032 |
USD 43.2 Billion |
|
Software-Defined Wide Area Network Market CAGR During 2024 - 2032 |
25.8% |
|
Software-Defined Wide Area Network Market Analysis Period |
2020 - 2032 |
|
Software-Defined Wide Area Network Market Base Year |
2023 |
|
Software-Defined Wide Area Network Market Forecast Data |
2024 - 2032 |
|
Segments Covered |
By Component, By Deployment, By Organization Size, By End-user, and By Geography |
|
Regional Scope |
North America, Europe, Asia Pacific, Latin America, and Middle East & Africa |
|
Key Companies Profiled |
Huawei Technologies Co., Ltd., Fortinet Inc., NEC Corporation, Tata Communications, Hewlett Packard Enterprise Development LP, Nokia, Cisco Systems, Inc., Oracle, Dell Inc., VMware, Inc., and Juniper Networks, Inc. |
|
Report Coverage |
Market Trends, Drivers, Restraints, Competitive Analysis, Player Profiling, Covid-19 Analysis, Regulation Analysis |
Software-Defined Wide Area Network Market Insights
Globally, companies aim to increase the quality of operations. SDWAN allows companies with high speed internet and network coverage to achieve good operating performance. Enterprise connectivity is a significant component of SDWAN and is rapidly adopted by the global increase in the number of mobile employees. It helps to secure access to company records, consistency and scalability development, continuity of operation. Employees can also maintain a healthy balance of work and life through business mobility. The use of other devices including smartphones , tablets and notebooks has been increased to access the market for software platforms. Companies are increasing the market for SDWAN by bring your own device (BYOD) policies. With the help of SDWAN one can quickly convert traditional networks with complex architecture to simpler networks.
However, ventures can invest in new technologies, electronics, architecture and installation solutions, which raise total expense with the introduction of SDWAN. Implementation will however continue to reduce savings in the long run. Concerns regarding security could limit SDWAN market development as new legislation and technology for network management will not be tried and tested.
 Software-Defined Wide Area Network Market Segmentation
The worldwide market for software-defined wide area network is split based on component, deployment, organization size, end-user, and geography.
Software-Defined Wide Area Network (SD-WAN) Market By Components
- Solution
- Software
- Hardware
- Services
- Professional
- Managed
According to software-defined wide area network industry analysis, the solution segment dominates the software market because to its potential to improve network performance, lower costs, and simplify management. Solutions include advanced features such as centralized control, dynamic path selection, and integrated security, making them ideal for businesses looking to improve their wide area networks. The expanding use of cloud-based apps, combined with the need for real-time analytics, is driving demand for SD-WAN solutions. Enterprises like these solutions because of their scalability, simple integration with current systems, and support for hybrid deployments. As businesses embrace digital transformation, SD-WAN solutions have emerged as the foundation of contemporary network infrastructure, strengthening their position as a significant market driver.
Software-Defined Wide Area Network (SD-WAN) Market By Deployments
- On-Premise
- Cloud
The on-premise sector leads the SD-WAN market, owing to enterprises' need for greater control over their network infrastructure. Unlike cloud-based models, on-premise SD-WAN solutions are deployed directly within the company environment, allowing for more personalized configurations and security. This method is particularly popular in areas that deal with sensitive data, such as banking, healthcare, and government, where stringent regulatory compliance is critical. The attraction for on-premise solutions arises from their ability to run independently of internet connectivity, resulting in reliable performance. Furthermore, organizations with established IT infrastructure frequently find on-premise solutions more aligned with their operational strategy, which reinforces their widespread acceptance across a variety of applications.
Software-Defined Wide Area Network (SD-WAN) Market By Organization Sizes
- Large Enterprises
- SMEs
Large enterprises account for a sizable portion of the market forecast period due to their complicated network requirements and expansive operational structures. These enterprises frequently span many sites around the world, demanding modern connectivity solutions to provide uninterrupted communication and data transfer. The ability of SD-WAN to optimize bandwidth, improve application performance, and provide strong security is perfectly suited to the needs of large companies. Furthermore, their large budgets enable the use of scalable and advanced SD-WAN technology, meeting their demand for high-speed, dependable, and secure networks. As digital transformation accelerates across industries, large businesses require SD-WAN to preserve agility, competitiveness, and operational efficiency in an increasingly linked world.
Software-Defined Wide Area Network (SD-WAN) Market By End-users
- Verticals
- BFSI
- IT & Telecom
- Manufacturing
- Healthcare
- Retail
- Government
- Energy & Utilities
- Transport & Logistics
- Others
- Service Providers
The verticals category generates the majority of revenue in the software-defined wide area network (SD-WAN) market, thanks to extensive adoption across several industries. Retail, healthcare, manufacturing, and finance industries use SD-WAN to improve operational efficiency and respond to changing digital needs. These industries require high-performance networks to facilitate cloud migration, real-time data processing, and secure communications across multiple branches or facilities. For example, shops utilize SD-WAN to improve point-of-sale systems and inventory management, whereas healthcare providers use it to secure patient data and provide telemedicine services. This broad applicability across industries assures that verticals continue to be the largest contributors to SD-WAN market revenue.
Software-Defined Wide Area Network Market Regional Outlook
North America
- U.S.
- Canada
Europe
- U.K.
- Germany
- France
- Spain
- Rest of Europe
Asia-Pacific
- India
- Japan
- China
- Australia
- South Korea
- Rest of Asia-Pacific
Latin America
- Brazil
- Mexico
- Rest of LATAM
The Middle East & Africa
- South Africa
- GCC Countries
- Rest of the Middle East & Africa (ME&A)

Software-Defined Wide Area Network Market Regional Analysis
North America hold large market share for software-defined wide area network market in 2023 due to presence of major companies in the region is regarded as the most mature in the software-defined wide area network market. Any of the leading well-known manufacturers and end-user verticals in this region is present in the global software-defined wide area network market. The main drivers of software-defined wide area network products in North America are projected to be companies transitioning into software-defined data center technologies and services and expanded adoption of modern market strategies.
On the other hand, the Asia-Pacific software-defined wide area network market is projected to be the fastest-growing region with exponential growth. The increasing awareness of data management via a common interface with low ownership, the rising focus on server virtualization, and the increasing popularity of using infrastructure-as-a-service solutions are the main drivers of growth on the Asia Pacific market.
Software-Defined Wide Area Network Market Players
Some of the top software-defined wide area network companies offered in our report includes Huawei Technologies Co., Ltd., Fortinet Inc., NEC Corporation, Tata Communications, Hewlett Packard Enterprise Development LP, Nokia, Cisco Systems, Inc., Oracle, Dell Inc., VMware, Inc., and Juniper Networks, Inc.
Frequently Asked Questions
How big is the software-defined wide area network market?
The software-defined wide area network market size was valued at USD 5.6 Billion in 2023.
What is the CAGR of the global software-defined wide area network market from 2024 to 2032?
The CAGR of Software-Defined Wide Area Network is 25.8% during the analysis period of 2024 to 2032.
Which are the key players in the software-defined wide area network market?
The key players operating in the global market are including Huawei Technologies Co., Ltd., Fortinet Inc., NEC Corporation, Tata Communications, Hewlett Packard Enterprise Development LP, Nokia, Cisco Systems, Inc., Oracle, Dell Inc., VMware, Inc., and Juniper Networks, Inc.
Which region dominated the global software-defined wide area network market share?
North America held the dominating position in software-defined wide area network industry during the analysis period of 2024 to 2032.
Which region registered fastest CAGR from 2024 to 2032?
Asia-Pacific region exhibited fastest growing CAGR for market of software-defined wide area network during the analysis period of 2024 to 2032.
What are the current trends and dynamics in the global software-defined wide area network industry?
The current trends and dynamics in the software-defined wide area network industry include increasing focus on network security and real-time data management, and expanding IoT ecosystem requiring seamless and reliable connectivity.
Which organization size held the maximum share in 2023?
The large enterprises organization size held the maximum share of the software-defined wide area network industry.


