Ovarian Cancer Diagnostics Market Size - Global Industry, Share, Analysis, Trends and Forecast 2024 - 2032
Published :
Report ID:
Pages :
Format :
Ovarian Cancer Diagnostics Market Size - Global Industry, Share, Analysis, Trends and Forecast 2024 - 2032
Report Coverage
- Industry Dynamics
- Market Size and Forecast Data
- Segment Analysis
- Competitive Landscape
- Regional Analysis with a Niche Focus on Country-Level Data
- High Level Analysis - Porter's, PESTEL, Value Chain, etc.
- Company Profiles of Key Players
- Option to Customize the Report As Per Your Specific Need
Request Sample Report
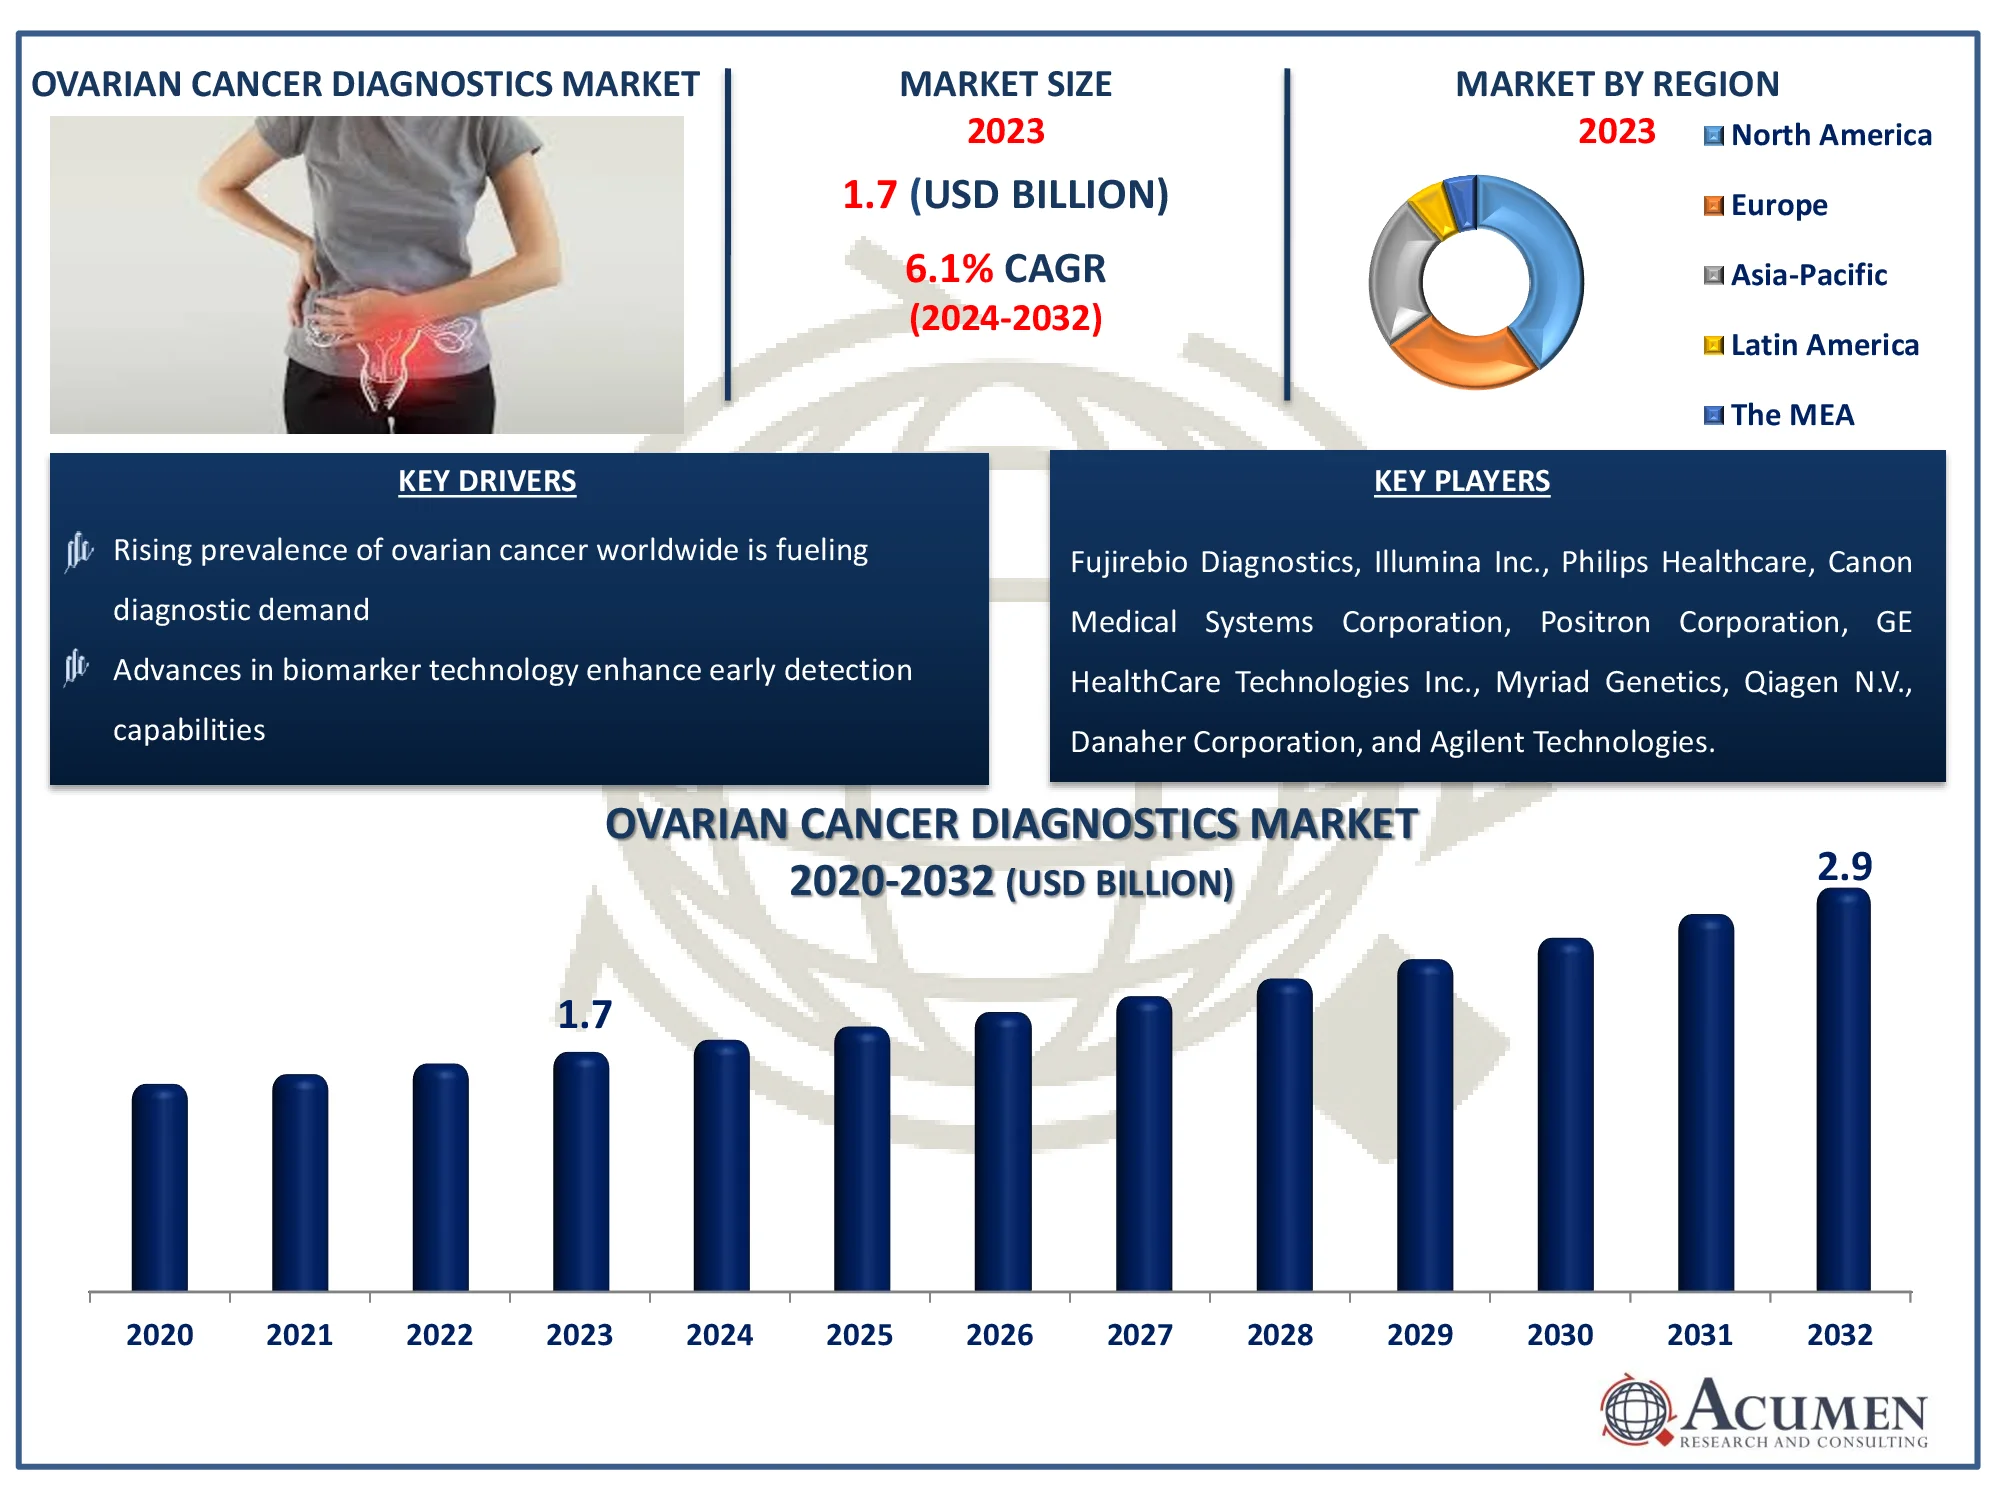
The Global Ovarian Cancer Diagnostics Market Size accounted for USD 1.7 Billion in 2023 and is estimated to achieve a market size of USD 2.9 Billion by 2032 growing at a CAGR of 6.1% from 2024 to 2032.
Ovarian Cancer Diagnostics Market Highlights
- Global ovarian cancer diagnostics market revenue is poised to garner USD 2.9 billion by 2032 with a CAGR of 6.1% from 2024 to 2032
- As per the World Ovarian Cancer Coalition data, 313,959 women worldwide were diagnosed with ovarian cancer in 2020 and are predicted to rise up to 445,721 by 2040
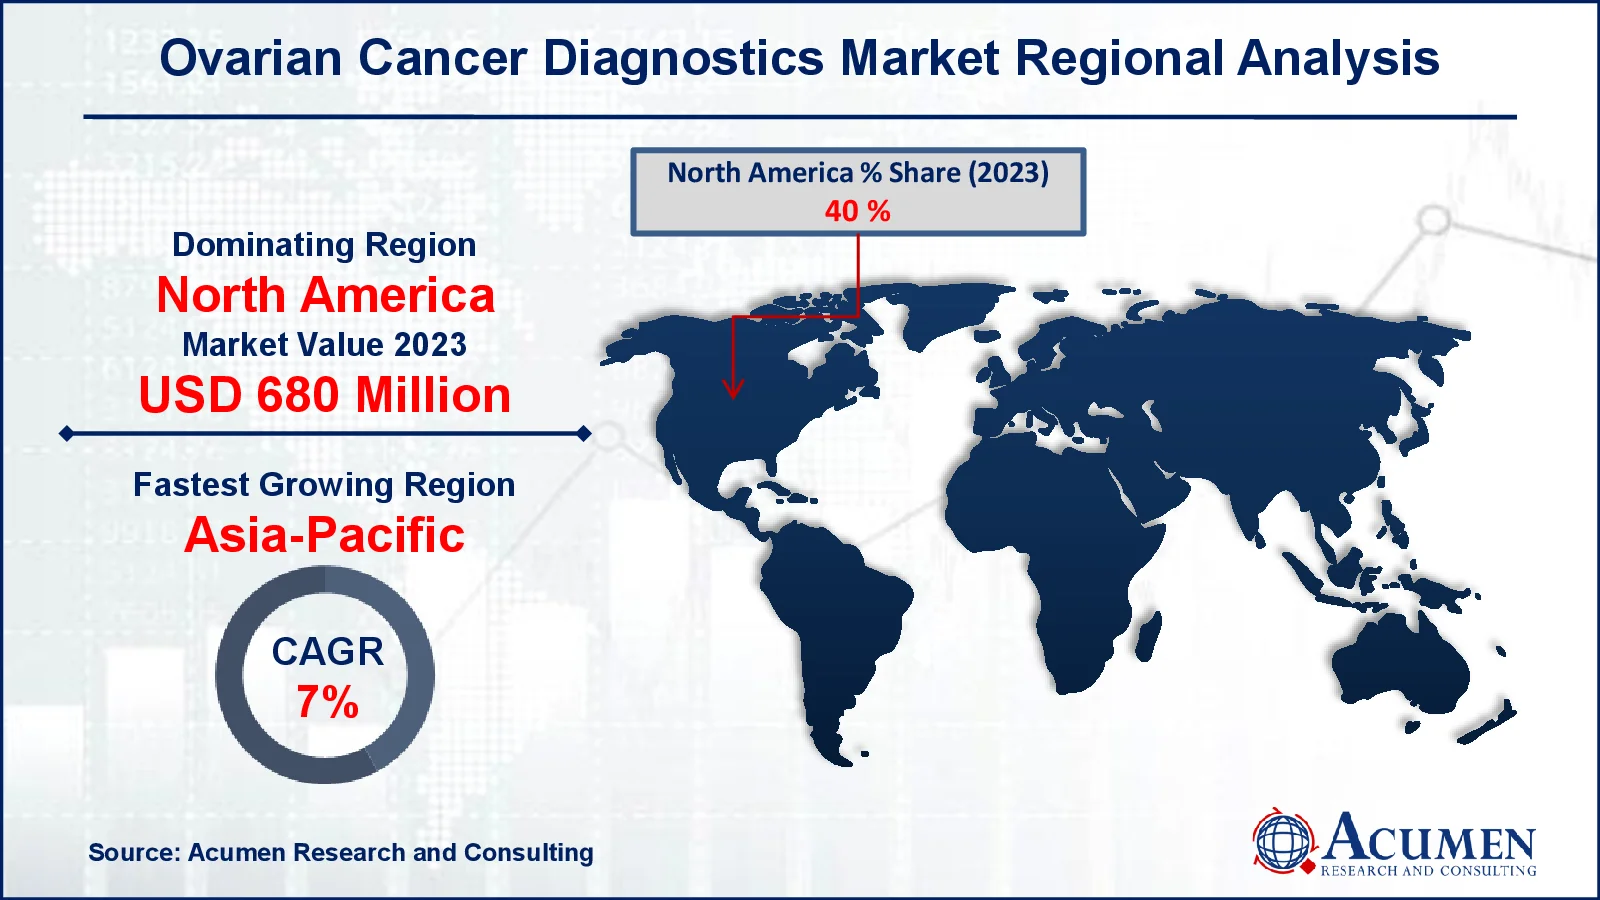
- North America ovarian cancer diagnostics market value occupied around USD 680 million in 2023
- Asia-Pacific ovarian cancer diagnostics market growth will record a CAGR of more than 7% from 2024 to 2032
- Among cancer type, the epithelial tumor sub-segment generated more than USD 1.5 billion revenue in 2023
- Based on diagnosis type, the imaging sub-segment generated around 41% ovarian cancer diagnostics market share in 2023
- Partnerships with healthcare institutions enable broader test distribution and accessibility is a popular ovarian cancer diagnostics market trend that fuels the industry demand

One of the most prevalent kinds of cancer in females is ovarian cancer. It is a cancer which begins in the ovaries. Ovary is a woman reproductive organ that contains eggs or ova. There are two ovaries in the woman reproductive scheme: one on either side of the uterus. Hormones include progesterone and estrogen is produced by ovaries. Eggs are also produced by ovaries. Ovarian cancer can only be detected when it reaches the abdomen and pelvis. The ovarian cancer is more deadly and difficult to cure at this point. In the initial stage, it can be treated more effectively if it is limited to the ovarian cells.
Global Ovarian Cancer Diagnostics Market Dynamics
Market Drivers
- Rising prevalence of ovarian cancer worldwide is fueling diagnostic demand
- Advances in biomarker technology enhance early detection capabilities
- Increased awareness campaigns drive patient and healthcare provider engagement
- Government funding and supportive health policies boost market growth
Market Restraints
- High costs of diagnostic tests limit accessibility in low-income regions
- Limited accuracy of existing diagnostic methods impacts early detection
- Stringent regulatory requirements delay the introduction of new diagnostics
Market Opportunities
- Expansion of telemedicine can improve access to diagnostics in remote areas
- Growth in artificial intelligence offers improved diagnostic accuracy and efficiency
- Increased R&D investments by key players open doors for innovative tests
Ovarian Cancer Diagnostics Market Report Coverage
| Market | Ovarian Cancer Diagnostics Market |
| Ovarian Cancer Diagnostics Market Size 2022 |
USD 1.7 Billion |
| Ovarian Cancer Diagnostics Market Forecast 2032 | USD 2.9 Billion |
| Ovarian Cancer Diagnostics Market CAGR During 2023 - 2032 | 6.1% |
| Ovarian Cancer Diagnostics Market Analysis Period | 2020 - 2032 |
| Ovarian Cancer Diagnostics Market Base Year |
2022 |
| Ovarian Cancer Diagnostics Market Forecast Data | 2023 - 2032 |
| Segments Covered | By Diagnosis Type, By Cancer Type, By End-Use, And By Geography |
| Regional Scope | North America, Europe, Asia Pacific, Latin America, and Middle East & Africa |
| Key Companies Profiled | Fujirebio Diagnostics, Illumina Inc., Philips Healthcare, Canon Medical Systems Corporation, Positron Corporation, GE HealthCare Technologies Inc., Myriad Genetics, Qiagen N.V., Danaher Corporation, Agilent Technologies, F. Hoffmann-La Roche Ltd., and Abbott Laboratories. |
| Report Coverage |
Market Trends, Drivers, Restraints, Competitive Analysis, Player Profiling, Covid-19 Analysis, Regulation Analysis |
Ovarian Cancer Diagnostics Market Insights
The growing incidence and emphasis on early diagnosis & therapy of ovarian disease should boost business development. The illness has generic signs, including bloating, menstruation abnormality, vaginal swelling, indigestion and tiredness. No specific symptoms make it increasingly difficult to diagnose the disease early. The prognosis of diseases continues low, since most patients are diagnosed in developed phases. So comprehensive study is essential to comprehend the biology of diseases so that efficient therapy choices are developed with the aim of overcoming opposition and minimizing toxicity. Further development of biomarkers could improve the identification of patients who require maintenance.
Factors such as an increase in government projects and financing for ovarian cancer research should fuel the industry. For example, the non-profit Ovarian Cancer Research Alliance (OCRA) focuses on the R&D of ovarian cancer. It promotes several study programs related to the diagnosis and therapy of this disease.
Some key factors restricting growth are lack of awareness of exact causative factors and late diagnosis of the disease. The fundamental molecular processes to recognize major genes or biochemical pathways that can be used for diagnosis & therapy are highly unmet. However, growing healthcare spending and technological advances create growth possibilities for the entire industry.
Ovarian Cancer Diagnostics Market Segmentation
The worldwide market for ovarian cancer diagnostics is split based on diagnosis type, cancer type, end-use, and geography.
Ovarian Cancer Diagnostics Market By Diagnosis Type
- Imaging
- CT Scan
- Ultrasound
- PET Scan
- MRI Scan
- Others
- Biopsy
- Blood Test
- BRCA
- CA125
- ER & PR
- HER2
- CEA
- KRAS Mutation
- Others
- Others
According to ovarian cancer diagnostics industry analysis, imaging methods accounted for the greatest share in 2023 due to the growing significance of early treatment and cancer staging. The preliminary imaging technique for internally viewing and measurement of a tumor remains the transvaginal ultrasound. CT scans are chosen for the stadium of cancer, but are restricted to tiny tumors. Advanced imagery techniques, like MRI and PET, are used to detect metastases and severity of diseases.
The blood test industry is predicted to see steady growth in technology and increased customer consciousness throughout the forecast period. Ovarian cancer can contribute to high concentrations of some biomarkers that can function as tumor markers for diagnosis. For example, for this illness,CA-125 is the most prevalent blood exam. A greater market penetration for HER2, BRCA and KRAS mutation studies led to increased focus on genetic consulting and testing.
Ovarian Cancer Diagnostics Market By Cancer Type
- Germ Cell Tumor
- Stromal Cell Tumor
- Epithelial Tumor
- Others
The sort of ovarian cancer depends on where cancer cells develop. In this section, epithel tumors stayed a precursor, representing more than 91% of all ovarian malignancies, in 2023. Serous, mucinous, endometrioid, or clear cell can be epithelial tumors. After the cancer has metastasized within the peritoneal nucleus, most individuals with epithelial cell carcinoma are identified. In the developed phase, 70% to 80% of people are diagnosed and the therapy choices and survival rate are reduced considerably. Collectively, germ and stromal cell tumors are capturing a lower share of this industry. Stromal cells grow in hormones such as estrogen, progesterone and testosterone in the organs accountable for generating them. Although common, germ cell tumors are most common in females between the ages of 20 and 30 years.
Ovarian Cancer Diagnostics Market By End-Use
- Cancer Diagnostic Centers
- Hospital Laboratories
- Research Institutes
- Others
The biggest share in 2023 was retained by end-use labs of hospitals. This sector development can be ascribed to increased patient inflow for cancer treatment in clinics, increased customer consciousness and increased infrastructure expenditure in emerging and underdeveloped nations. Due to increased financing for cancer studies globally, the market for study institutes is anticipated to develop at the largest pace during the prediction era. The Fred Hutchinson Cancer Research Center, for example, is devoted to biomarkers and ovarian cancer screening.
Ovarian Cancer Diagnostics Market Regional Outlook
North America
- U.S.
- Canada
Europe
- U.K.
- Germany
- France
- Spain
- Rest of Europe
Asia-Pacific
- India
- Japan
- China
- Australia
- South Korea
- Rest of Asia-Pacific
Latin America
- Brazil
- Mexico
- Rest of Latin America
The Middle East & Africa
- South Africa
- GCC Countries
- Rest of the Middle East & Africa (ME&A)

Ovarian Cancer Diagnostics Market Regional Analysis
North America accounted for over 40% of the total industry in 2023 due to the powerful business performance of US ovarian diagnostics. Some other variables contributing to ovarian cancer diagnostics market growth in this region are favorable public policies, increased healthcare spending and the existence of important producers. During the forecast period, Asia-Pacific is anticipated to develop at the most high level because of variables such as general economic development, improved health infrastructure, increased disposable income and increasing customer consciousness. Ovarian cancer diagnostics are anticipated to grow rapidly in emerging countries like China, India and Indonesia during the ovarian cancer diagnostics market forecast period. This is attributed to the significant rise of ovarina cancer patients in China (61,060), India (47,333), and Indonesia (15,130) as per the data reveled from the World Cancer Research Fund 2022.
Ovarian Cancer Diagnostics Market Players
Some of the top ovarian cancer diagnostics companies offered in our report includes Fujirebio Diagnostics, Illumina Inc., Philips Healthcare, Canon Medical Systems Corporation, Positron Corporation, GE HealthCare Technologies Inc., Myriad Genetics, Qiagen N.V., Danaher Corporation, Agilent Technologies, F. Hoffmann-La Roche Ltd., and Abbott Laboratories.
Frequently Asked Questions
How big is the ovarian cancer diagnostics market?
The ovarian cancer diagnostics market size was valued at USD 1.7 billion in 2023.
What is the CAGR of the global ovarian cancer diagnostics market from 2024 to 2032?
The CAGR of ovarian cancer diagnostics is 6.1% during the analysis period of 2024 to 2032.
Which are the key players in the ovarian cancer diagnostics market?
The key players operating in the global market are including Fujirebio Diagnostics, Illumina Inc., Philips Healthcare, Canon Medical Systems Corporation, Positron Corporation, GE HealthCare Technologies Inc., Myriad Genetics, Qiagen N.V., Danaher Corporation, Agilent Technologies, F. Hoffmann-La Roche Ltd., and Abbott Laboratories.
Which region dominated the global ovarian cancer diagnostics market share?
North America held the dominating position in ovarian cancer diagnostics industry during the analysis period of 2024 to 2032.
Which region registered fastest CAGR from 2024 to 2032?
Asia-Pacific region exhibited fastest growing CAGR for market of ovarian cancer diagnostics during the analysis period of 2024 to 2032.
What are the current trends and dynamics in the global ovarian cancer diagnostics industry?
The current trends and dynamics in the ovarian cancer diagnostics industry include rising prevalence of ovarian cancer worldwide is fueling diagnostic demand, advances in biomarker technology enhance early detection capabilities, increased awareness campaigns drive patient and healthcare provider engagement, and government funding and supportive health policies boost market growth.
Which cancer type held the maximum share in 2023?
The epithelial tumor cancer type held the maximum share of the ovarian cancer diagnostics industry.


