Angiography Devices Market Size - Global Industry, Share, Analysis, Trends and Forecast 2024 - 2032
Published :
Report ID:
Pages :
Format :
Angiography Devices Market Size - Global Industry, Share, Analysis, Trends and Forecast 2024 - 2032
Report Coverage
- Industry Dynamics
- Market Size and Forecast Data
- Segment Analysis
- Competitive Landscape
- Regional Analysis with a Niche Focus on Country-Level Data
- High Level Analysis - Porter's, PESTEL, Value Chain, etc.
- Company Profiles of Key Players
- Option to Customize the Report As Per Your Specific Need
Request Sample Report
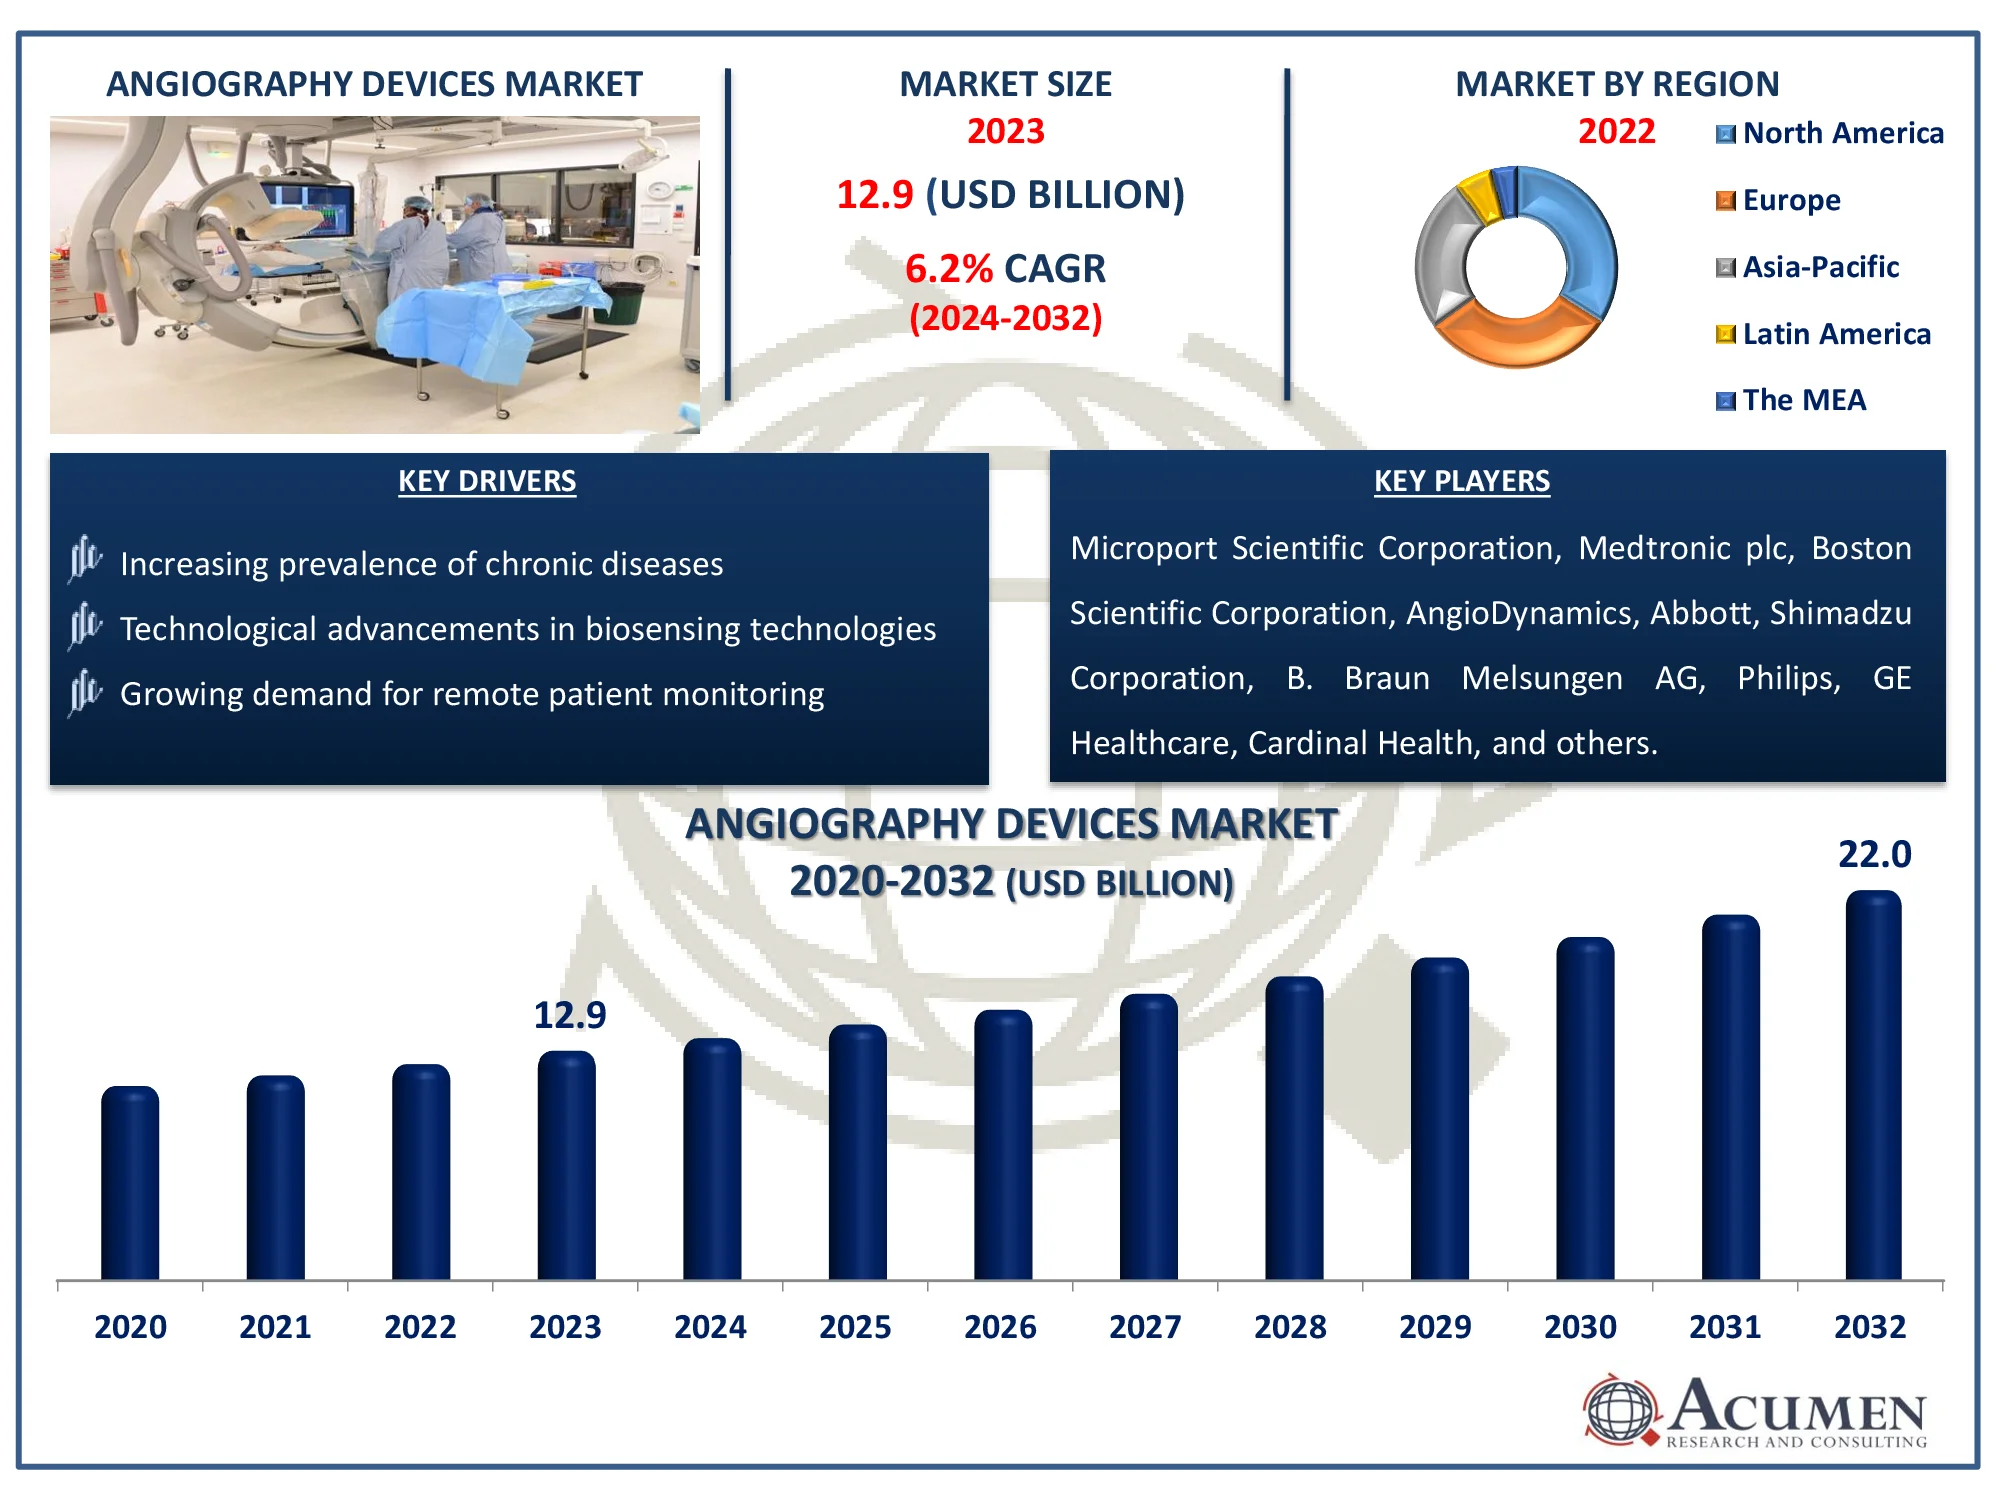
The Global Angiography Devices Market Size accounted for USD 12.9 Billion in 2023 and is estimated to achieve a market size of USD 22.0 Billion by 2032 growing at a CAGR of 6.2% from 2024 to 2032.
Angiography Devices Market (By Function: Catheters, Contrast Media, Angiography Systems, Balloons, Guidewire, Vascular Closure Devices, Angiography Accessories; By Technology: X-Ray Angiography, CT Angiography, MR Angiography; By Procedure: Endovascular, Coronary, Neurovascular; By Application: Therapeutic, Diagnostic; and By Region: North America, Europe, Asia-Pacific, Latin America, and MEA)
Angiography Devices Market Highlights
- The global angiography devices market is projected to reach USD 22.0 billion by 2032, growing at a CAGR of 6.2% from 2024 to 2032
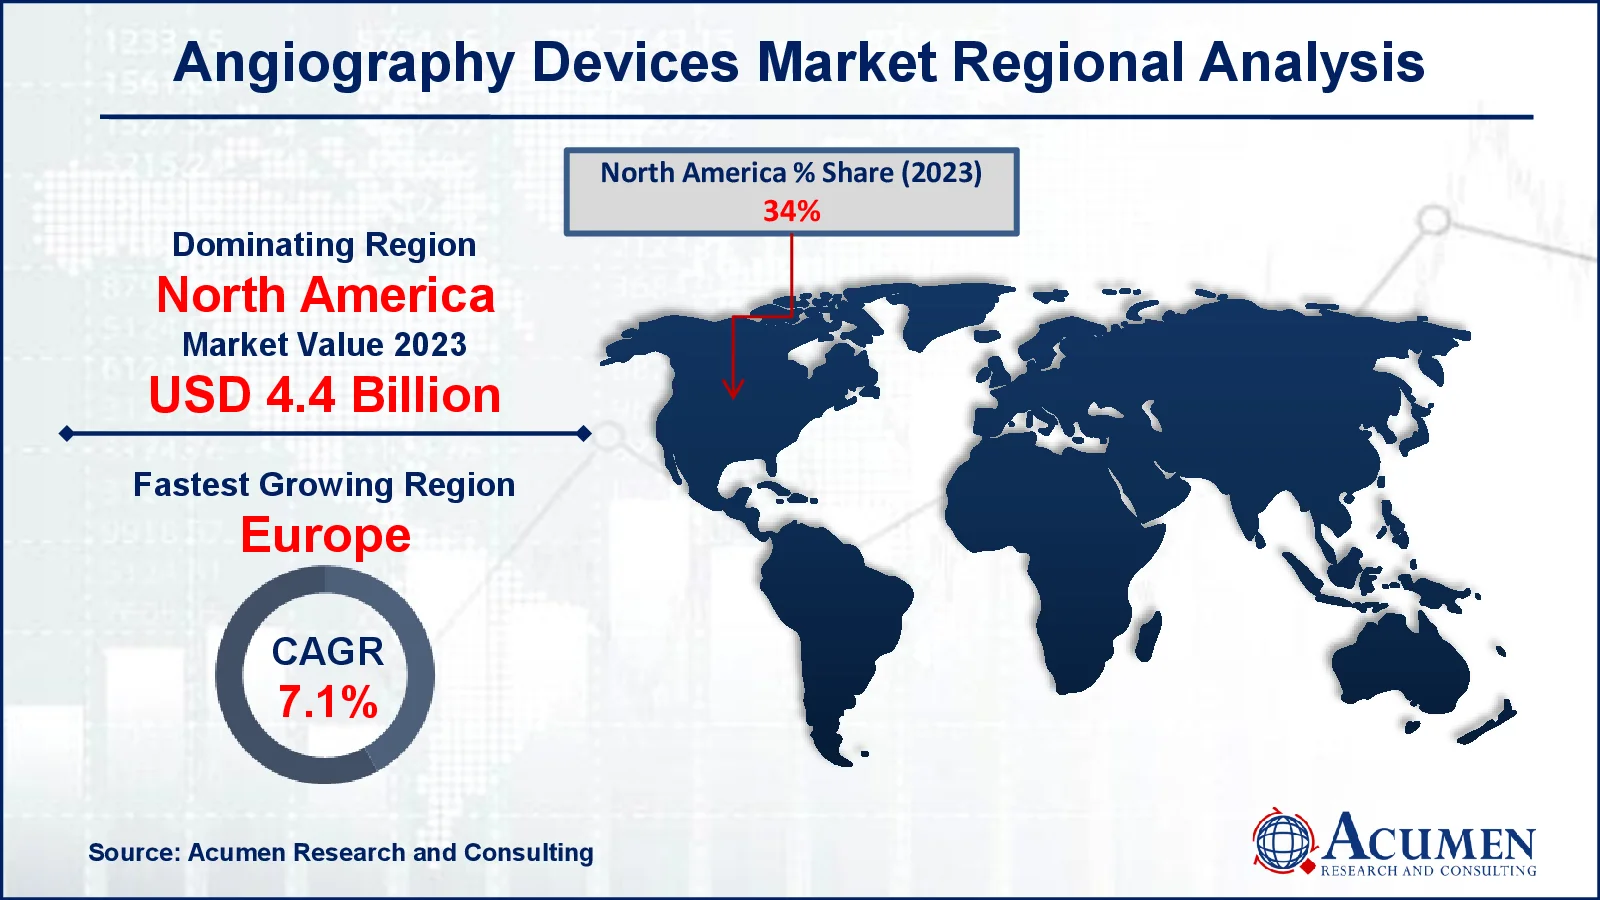
- In 2023, the North American angiography devices market was valued at approximately USD 4.4 billion
- The European angiography devices market is expected to grow at a CAGR of over 7.1% from 2024 to 2032
- The angiography systems sub-segment accounted for 26% of the total market share in 2023
- X-ray angiography technology held a 36% market share in 2023
- Advancements in 3D and digital subtraction angiography technologies is the angiography devices market trend that fuels the industry demand

Angiography devices are medical imaging instruments used to see blood vessels in the body, namely arteries, veins, and heart chambers. They work by injecting a contrast dye into the circulation and then taking precise X-ray images to evaluate blood flow and detect blockages or irregularities. Angiography is routinely used to diagnose coronary artery disease, aneurysms, and peripheral artery disease. It also helps to plan treatments like angioplasty and stent implantation. These technologies are critical in guiding minimally invasive surgical operations, hence eliminating the necessity for open surgeries. Additionally, angiography is utilized in neurological examinations to assist detect strokes or brain aneurysms.
Global Angiography Devices Market Dynamics
Market Drivers
- Increasing prevalence of chronic diseases
- Technological advancements in biosensing technologies
- Growing demand for remote patient monitoring
Market Restraints
- High cost of angiography devices
- Data privacy and security concerns
- Limited awareness in emerging markets
Market Opportunities
- Expansion into untapped markets in developing regions
- Integration of AI for enhanced diagnostics
- Rising investments in healthcare infrastructure
Angiography Devices Market Report Coverage
| Market | Angiography Devices Market |
| Angiography Devices Market Size 2022 |
USD 12.9 Billion |
| Angiography Devices Market Forecast 2032 | USD 22.0 Billion |
| Angiography Devices Market CAGR During 2023 - 2032 | 6.2% |
| Angiography Devices Market Analysis Period | 2020 - 2032 |
| Angiography Devices Market Base Year |
2022 |
| Angiography Devices Market Forecast Data | 2023 - 2032 |
| Segments Covered | By Product, By Technology, By Procedure, By Application, And By Geography |
| Regional Scope | North America, Europe, Asia Pacific, Latin America, and Middle East & Africa |
| Key Companies Profiled | Microport Scientific Corporation, Medtronic plc, Boston Scientific Corporation, AngioDynamics, Abbott, Shimadzu Corporation, B. Braun Melsungen AG, Philips, GE Healthcare, Cardinal Health, and Siemens Healthcare GmbH. |
| Report Coverage |
Market Trends, Drivers, Restraints, Competitive Analysis, Player Profiling, Covid-19 Analysis, Regulation Analysis |
Angiography Devices Market Insights
Rising awareness of CVD and associated risk factors is projected to propel the market. For instance, according to the National NCD Portal, at least 220 Billion adults in India have high blood pressure, with only 12% under control. As of August 2023, 11 Billion hypertension and diabetes patients are receiving therapy. Globally, coronary artery disease causes the greatest number of fatalities and disability. The WHO and state governments' collaborative initiatives to raise awareness about heart disease and its underlying causes are projected to contribute to the growth of the angiography equipment market.
The continual progress of imaging technology, as well as the increased use of angiography devices for cardiovascular disorders, is prominent factors that will generate significant growth potential for leading medical device manufacturers in the worldwide angiography devices market. Furthermore, the firms are investing extensively in the development of breakthrough technologies, which are projected to help drive market expansion. Increased need for lower radiation doses, improved picture quality, and growing cath lab trends are all projected to drive the angiography device market.
The use of artificial intelligence in angiography devices improves diagnostic accuracy by interpreting complicated imaging data more effectively than traditional approaches. For instance, according to American Hospital Association, artificial intelligence (AI) has the potential to help health care providers obtain insights and enhance patient outcomes. AI is enhancing data processing, recognizing trends, and producing insights that would otherwise go undiscovered through a physician's manual effort. AI deployment that is well-thought-out provides limitless chances for improving clinical care. Human-centered AI design has the highest promise for AI during the next five years. AI algorithms can detect tiny irregularities in blood vessels, allowing for earlier identification of illnesses such as coronary artery disease or aneurysms. This minimizes human mistake and accelerates decision-making during important interventions. As a result, AI-driven angiography is increasing demand for more powerful, intelligent gadgets, opening up new business prospects.
Angiography Devices Market Segmentation
The worldwide market for angiography devices is split based on product, technology, procedure, application, and geography.
Angiography Device Market By Product
- Catheters
- Contrast Media
- Angiography Systems
- Balloons
- Guidewire
- Vascular Closure Devices
- Angiography Accessories
According to the angiography devices industry analysis, angiography systems market due to their extensive imaging capabilities and broad applicability in diagnosing cardiovascular, neurovascular, and peripheral vascular diseases. These systems give precise, real-time graphics that are vital for diagnosis and treatment planning, making them invaluable tools in hospitals and clinics. Their capacity to facilitate minimally invasive operations such as stent placements and angioplasties drives increasing their demand.
Angiography Device Market By Technology
- X-Ray Angiography
- Image Intensifiers
- Flat-panel Detectors
- CT Angiography
- MR Angiography
According to the angiography equipment market analysis, x-ray angiography technology leads market due to its long history of reliability and accuracy in viewing blood arteries and finding blockages. It is still the gold standard for operations like as coronary angiography, which produces high-resolution pictures that guide treatments like angioplasty or stent placement. Its capacity to provide real-time images makes it crucial for critical surgical procedures. This extensive use, combined with ongoing improvement, has kept it at the top of the angiography device market.
Angiography Device Market By Procedure
- Endovascular
- Coronary
- Neurovascular
According to the angiography devices market forecast, coronary procedures dominate market due to the high prevalence of cardiovascular disorders worldwide, particularly coronary artery disease. Angiography is vital for identifying and treating coronary artery blockages, as well as guiding procedures like stent implantation and angioplasty. With an aging population and increased risk factors such as hypertension and diabetes, demand for coronary angiography is increasing. These procedures provide less invasive alternatives to open-heart surgeries, making them the preferred option for both patients and doctors.
Angiography Device Market By Application
- Therapeutic
- Diagnostic
According to the angiography equipment market forecast, diagnostic applications dominate market because they play a key role in detecting vascular disorders such coronary artery disease, aneurysms, and peripheral artery disease. Angiography produces detailed images of blood vessels, allowing for early detection of blockages and abnormalities, which is critical for prompt and efficient treatment. As non-invasive and minimally invasive diagnostic methods gain popularity, angiography remains a cornerstone of modern diagnostics. The growing prevalence of cardiovascular and neurovascular illnesses increases the necessity for precise diagnostic imaging.
Angiography Devices Market Regional Outlook
North America
- U.S.
- Canada
Europe
- U.K.
- Germany
- France
- Spain
- Rest of Europe
Asia-Pacific
- India
- Japan
- China
- Australia
- South Korea
- Rest of Asia-Pacific
Latin America
- Brazil
- Mexico
- Rest of Latin America
The Middle East & Africa
- South Africa
- GCC Countries
- Rest of the Middle East & Africa (ME&A)

Angiography Devices Market Regional Analysis
For several reasons, the North American region is dominating the worldwide angiography devices market, due to an increase in the elderly population and an increase in cardiovascular illnesses. For instance, the number of Americans aged 60 and older increased by 29%, from 60.9 Billion to 78.9 Billion. In 2022, 31.9 Billion women and 25.9 Billion men were 65 or older. That is 123 women for every 100 men. This ratio has climbed to 184 women for every 100 males among those aged 85 and up.
The angiography devices market in Europe is predicted to grow rapidly due to its improved healthcare infrastructure and rising prevalence of cardiovascular illnesses. For instance, according to Government of U.K., there was a 2.9-fold differential in admission rates for coronary heart disease between counties and UAs in England in the fiscal year ending 2023. Tameside had the highest incidence (676.2 per 100,000 people), while Bath and North East Somerset had the lowest rate (233.5 per 100,000 population). Furthermore, aging populations in countries such as Germany and France are increasing demand for diagnostic and interventional procedures, accelerating market growth.
The Asia Pacific area is likely to grow rapidly in forecast year due to favorable government regulations in developing countries such as India, China, and Japan, which are expected to account for the majority of the Asia Pacific angiography device market. Furthermore, the growing countries in Asia Pacific are expected to provide profitable growth possibilities for important device manufacturers. This aspect is projected to fuel the expansion of the angiography device market.
Angiography Devices Market Players
Some of the top angiography devices companies offered in our report include Microport Scientific Corporation, Medtronic plc, Boston Scientific Corporation, AngioDynamics, Abbott, Shimadzu Corporation, B. Braun Melsungen AG, Philips, GE Healthcare, Cardinal Health, and Siemens Healthcare GmbH.
Frequently Asked Questions
How big is the angiography devices market?
The angiography devices market size was valued at USD 12.9 billion in 2023.
What is the CAGR of the global angiography devices market from 2024 to 2032?
The CAGR of angiography devices is 6.2% during the analysis period of 2024 to 2032.
Which are the key players in the angiography devices market?
The key players operating in the global market are including Microport Scientific Corporation, Medtronic plc, Boston Scientific Corporation, AngioDynamics, Abbott, Shimadzu Corporation, B. Braun Melsungen AG, Philips, GE Healthcare, Cardinal Health, and Siemens Healthcare GmbH.
Which region dominated the global angiography devices market share?
North America held the dominating position in angiography devices industry during the analysis period of 2024 to 2032.
Which region registered fastest CAGR from 2024 to 2032?
Europe region exhibited fastest growing CAGR for market of angiography devices during the analysis period of 2024 to 2032.
What are the current trends and dynamics in the global angiography devices industry?
The current trends and dynamics in the angiography devices industry include increasing prevalence of chronic diseases, technological advancements in biosensing technologies, and growing demand for remote patient monitoring.
Which product held the maximum share in 2023?
The angiography systems product held the maximum share of the angiography devices industry.


