Wheelchair Market | Acumen Research and Consulting
Wheelchair Market Size - Global Industry, Share, Analysis, Trends and Forecast 2024 - 2032
Published :
Report ID:
Pages :
Format :
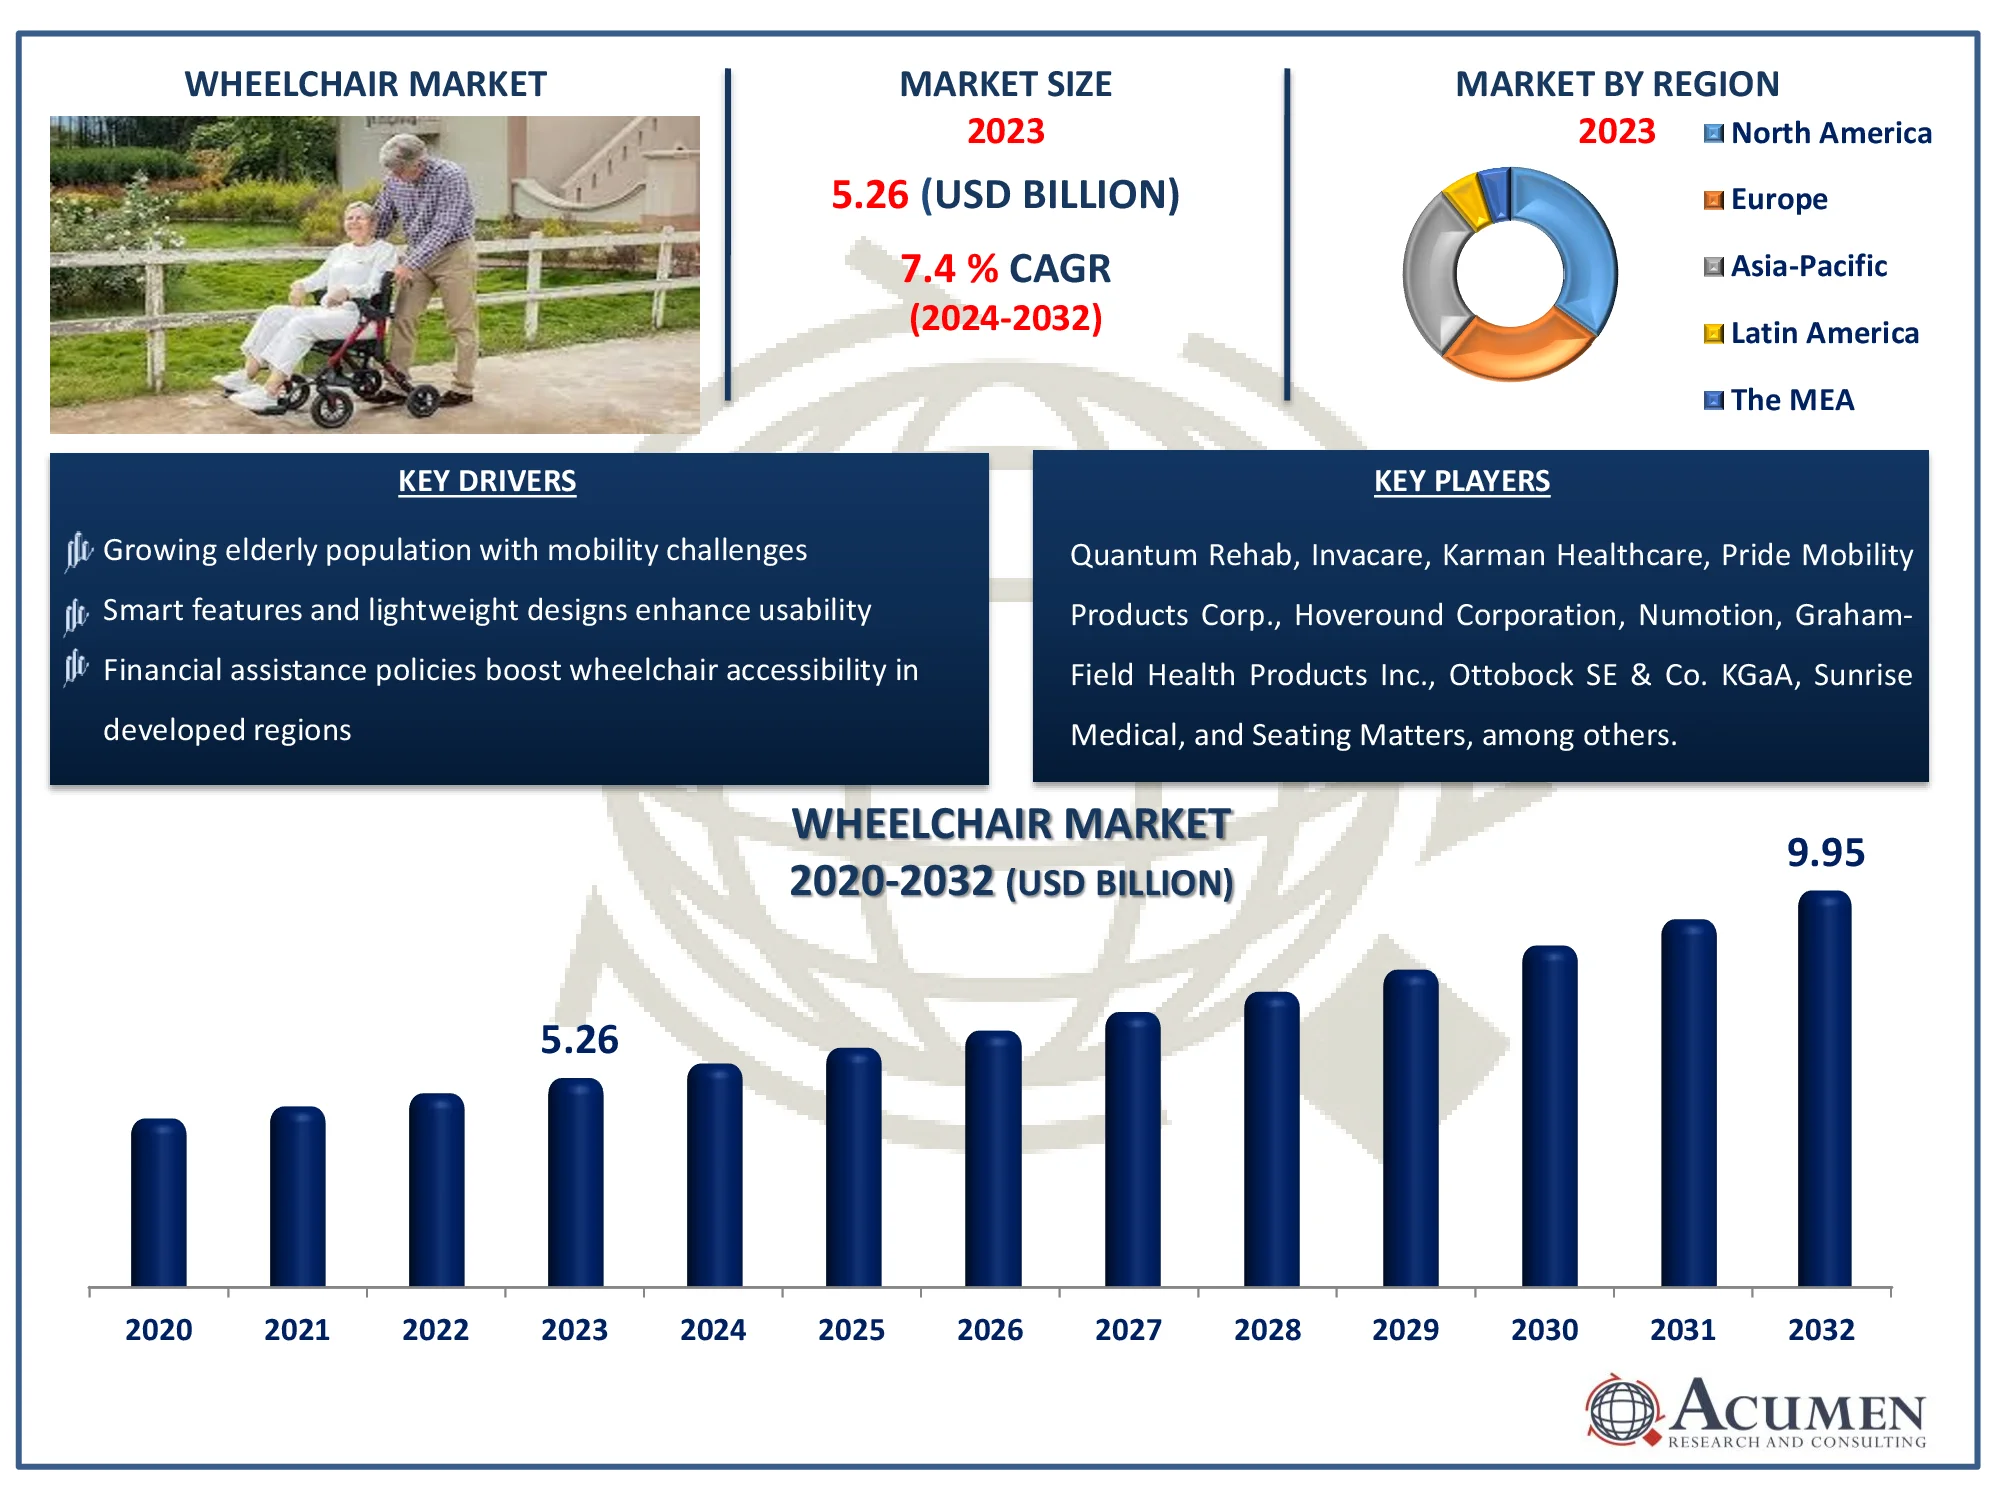
The Global Wheelchair Market Size accounted for USD 5.26 billion in 2023 and is estimated to achieve a market size of USD 9.95 Billion by 2032 growing at a CAGR of 7.4% from 2024 to 2032.
Wheelchair Market Highlights
- Global wheelchair market revenue is poised to garner USD 9.95 billion by 2032 with a CAGR of 7.4% from 2024 to 2032
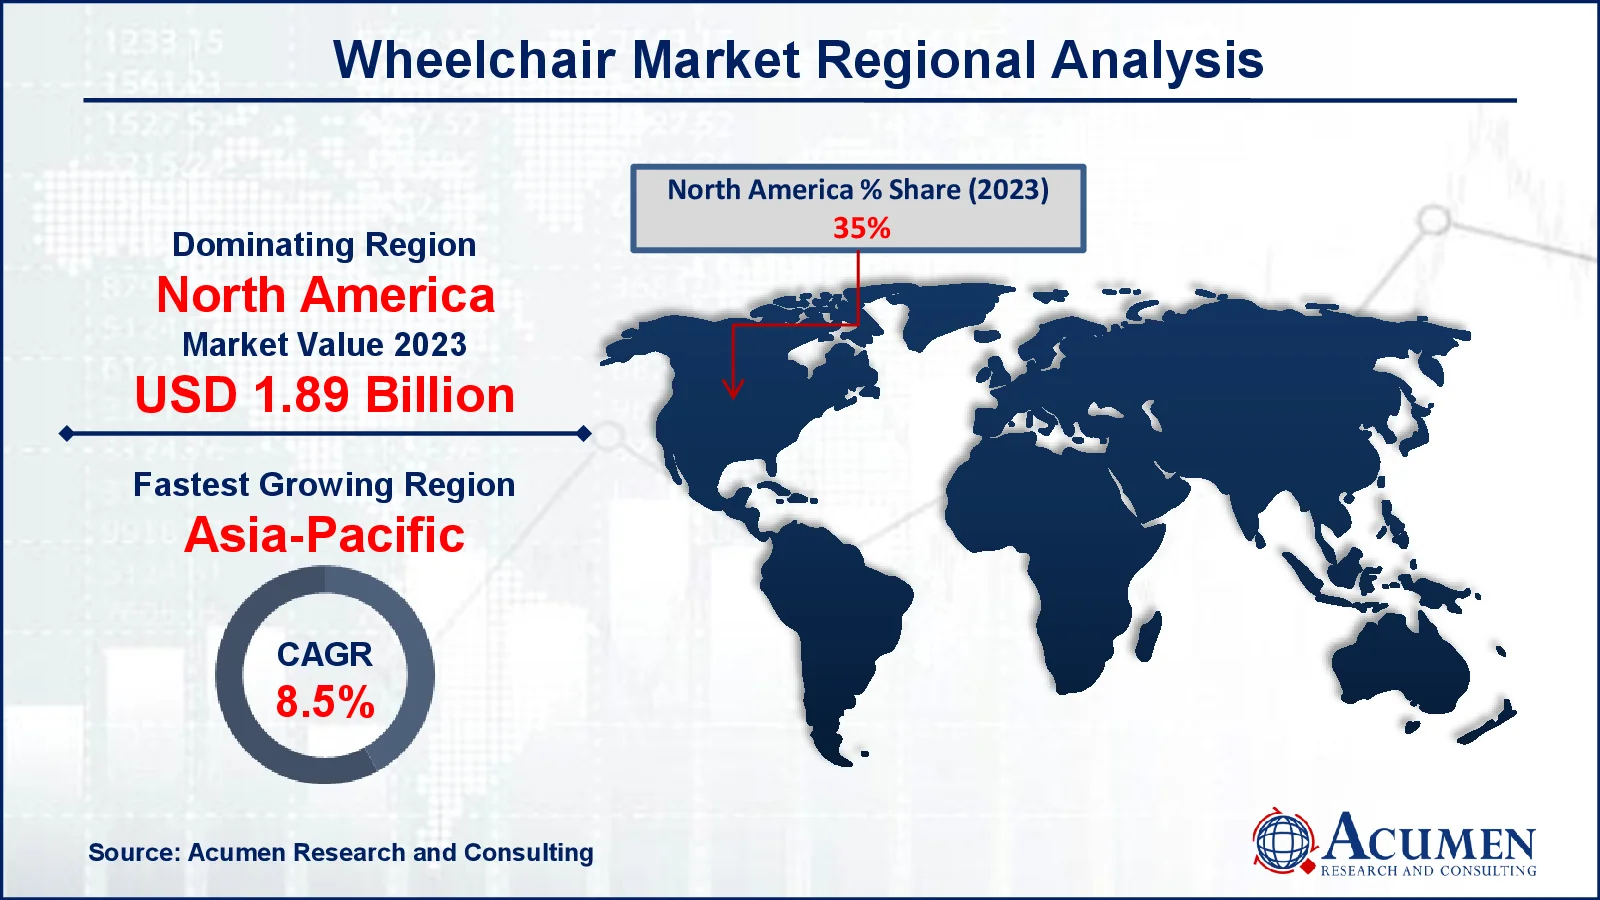
- North America wheelchair market value occupied around USD 1.89 billion in 2023
- Asia-Pacific wheelchair market growth will record a CAGR of more than 8.5% from 2024 to 2032
- Among category, the adults sub-segment generated more than USD 3.63 billion revenue in 2023
- Based on end-user, the rehabilitation centers sub-segment generated around 35% wheelchair market share in 2023
- Advancements in customization based on user-specific needs, including postural support and design is a popular wheelchair market trend that fuels the industry demand

Wheelchair refers to the chairs, which are integrated with the wheels. It's a designed solution for the transportation of a person with certain disabilities, which results in the inability to walk. Basically, it’s a mobility device, where a person sits with a walking disability. These are primarily made up of steel, plastic, titanium or aluminum. Steel is mostly used in wheelchairs with standard functioning, along with folding-frame mechanism. Along with this, aluminum is used across the wheelchair industry and especially in lightweight wheelchairs. Titanium is used in the manufacturing of ultra-lightweight frame. Wheelchairs are usually equipped with footplate made from polypropylene plastic with adjustable features, according to the user's size and disability.
Apart from this, manual and powered wheelchairs are available in the market, where manual wheelchairs are designed for the operation by the user itself. These are also equipped with an extra handle so that other person can also push the chair. On the other hand, a powered wheelchair is also termed as a motorized wheelchair, power chair, or electric-powered wheelchair (EPW). As the name suggests, these chairs don't need the efforts of the user or another person, these can be mobilized by the electric power.
Global Wheelchair Market Dynamics
Market Drivers
- Growing elderly population with mobility challenges drives wheelchair demand
- Smart features and lightweight designs enhance usability and attract users
- Financial assistance policies boost wheelchair accessibility in developed regions
- Awareness campaigns increase adoption among differently-abled individuals
Market Restraints
- Electric and customized wheelchairs remain unaffordable for many users, particularly in low-income regions
- Limited healthcare facilities and uneven terrain hinder wheelchair accessibility in rural areas
- Persistent stigma and lack of understanding about wheelchair use discourage adoption in some cultures
Market Opportunities
- Untapped markets in Asia-Pacific and Latin America present significant growth opportunities for manufacturers
- Increasing interest in adaptive sports creates demand for specialized sports wheelchairs
- E-commerce platforms offering a wide range of models at competitive prices make purchasing easier for consumers
Wheelchair Market Report Coverage
| Market | Wheelchair Market |
| Wheelchair Market Size 2022 |
USD 5.26 Billion |
| Wheelchair Market Forecast 2032 | USD 9.95 Billion |
| Wheelchair Market CAGR During 2023 - 2032 | 7.4% |
| Wheelchair Market Analysis Period | 2020 - 2032 |
| Wheelchair Market Base Year |
2022 |
| Wheelchair Market Forecast Data | 2024 - 2032 |
| Segments Covered | By Product, By Category, By End-User, And By Geography |
| Regional Scope | North America, Europe, Asia Pacific, Latin America, and Middle East & Africa |
| Key Companies Profiled | Quantum Rehab, Invacare, Karman Healthcare, Pride Mobility Products Corp., Hoveround Corporation, Numotion, Graham-Field Health Products Inc., Ottobock SE & Co. KGaA, Sunrise Medical, Seating Matters, Electric Mobility Euro Ltd, Kangyang Medical Technology Co., Ltd., Levo AG, and Merits Health Products Co., Ltd. |
| Report Coverage |
Market Trends, Drivers, Restraints, Competitive Analysis, Player Profiling, Covid-19 Analysis, Regulation Analysis |
Wheelchair Market Insights
The overall wheelchair market is growing owing to the increasing prevalence of diseases which causes walking disability among individuals coupled with the rising geriatric population. The increasing product portfolio with the incorporation of advanced features in existing products by the development of new products by key players is also propelling the demand in the market. The rising incidence of accidents, which causes permanent or temporary physical disability, is a factor boosting the market value. The constantly increasing obese population across the globe due to drastic changes in daily lifestyle is another factor accelerating the demand for wheelchairs. Along with these, the increasing spending on healthcare infrastructure in some emerging economies is likely to support the market growth.
On the flip side, the high cost associated with the advance wheelchair options is expected to hamper market demand over the forecast period. Along with this, the unavailability of proper healthcare solutions in several developing and underdeveloped economies is further expected to limit the growth of the wheelchair market during the forecast period. Whereas, the untapped market of developing and underdeveloped economies are anticipated to create potential opportunities during the wheelchair market forecast period.
Wheelchair Market Segmentation
The worldwide market for wheelchair is split based on product, category, end-user, and geography.
Wheelchair Market By Product
- Manual
- Electric
According to wheelchair industry analysis, electric wheelchairs are predicted to produce significant revenue in the product category due to their increased usefulness and attractiveness to people with severe mobility limitations. Electric wheelchairs provide motorized propulsion, customized controls, and increased comfort, making them suitable for users seeking independence and ease of movement. Demand is also being driven by technical developments like as smart navigation systems, AI integration, and lightweight designs that improve usability and appeal. Furthermore, the aging population and increased frequency of chronic illnesses requiring long-term mobility assistance are driving the segment's rise. While manual wheelchairs continue to be popular due to their low cost, electric wheelchairs' ease and efficiency make them the market's dominating revenue source.
Wheelchair Market By Category
- Pediatric
- Adults
Adults account for the largest segment of the wheelchair market due to the increasing prevalence of mobility issues among adults caused by age, chronic diseases, and disabilities. Adults, particularly the elderly, frequently need mobility aids to maintain their independence and quality of life. The segment benefits from the world's growing senior population and the increased prevalence of mobility-impairing illnesses such as arthritis, spinal cord injuries, and strokes. Furthermore, the availability of a diverse selection of wheelchair models, including motorized and customized solutions designed exclusively for adult users, increases market share. Government healthcare programs and reimbursement rules for adult mobility aids drive the segment's growth, cementing its market leadership.
Wheelchair Market By End-User
- Hospitals
- Homecare
- Rehabilitation Centers
- Ambulatory Surgical Centers
The rehabilitation centers category leads the wheelchair market, driven by the growing demand for specialized mobility aids in therapeutic and recovery settings. Rehabilitation facilities serve patients suffering from severe injuries, surgeries, or chronic ailments such as spinal cord injuries, strokes, and neuromuscular disorders, which frequently need the use of wheelchairs. These facilities require a variety of wheelchairs, including manual, electric, and customized versions, to support tailored treatment plans and mobility enhancement programs. Furthermore, the growing global emphasis on physical therapy and rehabilitation services to enhance patient outcomes is driving up demand. Investments in sophisticated rehabilitation facilities, as well as the usage of technologically advanced wheelchairs, contribute to the segment's wheelchairs market domination.
Wheelchair Market Regional Outlook
North America
- U.S.
- Canada
Europe
- U.K.
- Germany
- France
- Spain
- Rest of Europe
Asia-Pacific
- India
- Japan
- China
- Australia
- South Korea
- Rest of Asia-Pacific
Latin America
- Brazil
- Mexico
- Rest of Latin America
The Middle East & Africa
- South Africa
- GCC Countries
- Rest of the Middle East & Africa (ME&A)

Wheelchair Market Regional Analysis
North America is the world's largest wheelchair market, thanks to improved healthcare systems, an aging population, and major governmental and private investment in mobility aids. The United States dominates the region due to a high prevalence of chronic illnesses such as arthritis, obesity, and spinal cord injuries, which increase the demand for mobility solutions. Government reimbursement rules and subsidies for wheelchair users help to support the market. Furthermore, the region is a hotbed of innovation, with firms working on creating smart electric wheelchairs with AI and IoT capabilities. Canada also adds to the market with its universal healthcare services, which provide access to assistive equipment.
Asia-Pacific is emerging as a rapidly rising wheelchair market, driven by a large aging population and increased healthcare investments. Countries such as China, Japan, and India are propelling the region forward. In China, government efforts to enhance healthcare access and subsidize mobility aids have greatly increased demand. Japan's excellent healthcare system and emphasis on aged care contribute to its market dominance. Meanwhile, India is seeing increased usage as a result of expanding awareness, a growing middle-class population, and the expansion of healthcare services. However, obstacles like as affordability and a lack of infrastructure in rural areas continue to impede growth.
Wheelchair Market Players
Some of the top wheelchair companies offered in our report includes Quantum Rehab, Invacare, Karman Healthcare, Pride Mobility Products Corp., Hoveround Corporation, Numotion, Graham-Field Health Products Inc., Ottobock SE & Co. KGaA, Sunrise Medical, Seating Matters, Electric Mobility Euro Ltd, Kangyang Medical Technology Co., Ltd., Levo AG, and Merits Health Products Co., Ltd.
Frequently Asked Questions
How big is the wheelchair market?
The wheelchair market size was valued at USD 5.26 billion in 2023.
What is the CAGR of the global wheelchair market from 2024 to 2032?
The CAGR of wheelchair is 7.4% during the analysis period of 2024 to 2032.
Which are the key players in the wheelchair market?
The key players operating in the global market are including Quantum Rehab, Invacare, Karman Healthcare, Pride Mobility Products Corp., Hoveround Corporation, Numotion, Graham-Field Health Products Inc., Ottobock SE & Co. KGaA, Sunrise Medical, Seating Matters, Electric Mobility Euro Ltd, Kangyang Medical Technology Co., Ltd., Levo AG, and Merits Health Products Co., Ltd.
Which region dominated the global wheelchair market share?
North America held the dominating position in wheelchair industry during the analysis period of 2024 to 2032.
Which region registered fastest CAGR from 2024 to 2032?
Europe region exhibited fastest growing CAGR for market of wheelchair during the analysis period of 2024 to 2032.
What are the current trends and dynamics in the global wheelchair industry?
The current trends and dynamics in the wheelchair industry include increasing growing elderly population with mobility challenges drives wheelchair demand, smart features and lightweight designs enhance usability and attract users, and financial assistance policies boost wheelchair accessibility in developed regions.
Which category held the maximum share in 2023?
The adults category held the maximum share of the wheelchair industry.


