Surface Inspection Market Size - Global Industry, Share, Analysis, Trends and Forecast 2023 - 2032
Published :
Report ID:
Pages :
Format :
Surface Inspection Market Size - Global Industry, Share, Analysis, Trends and Forecast 2023 - 2032
Report Coverage
- Industry Dynamics
- Market Size and Forecast Data
- Segment Analysis
- Competitive Landscape
- Regional Analysis with a Niche Focus on Country-Level Data
- High Level Analysis - Porter's, PESTEL, Value Chain, etc.
- Company Profiles of Key Players
- Option to Customize the Report As Per Your Specific Need
Request Sample Report
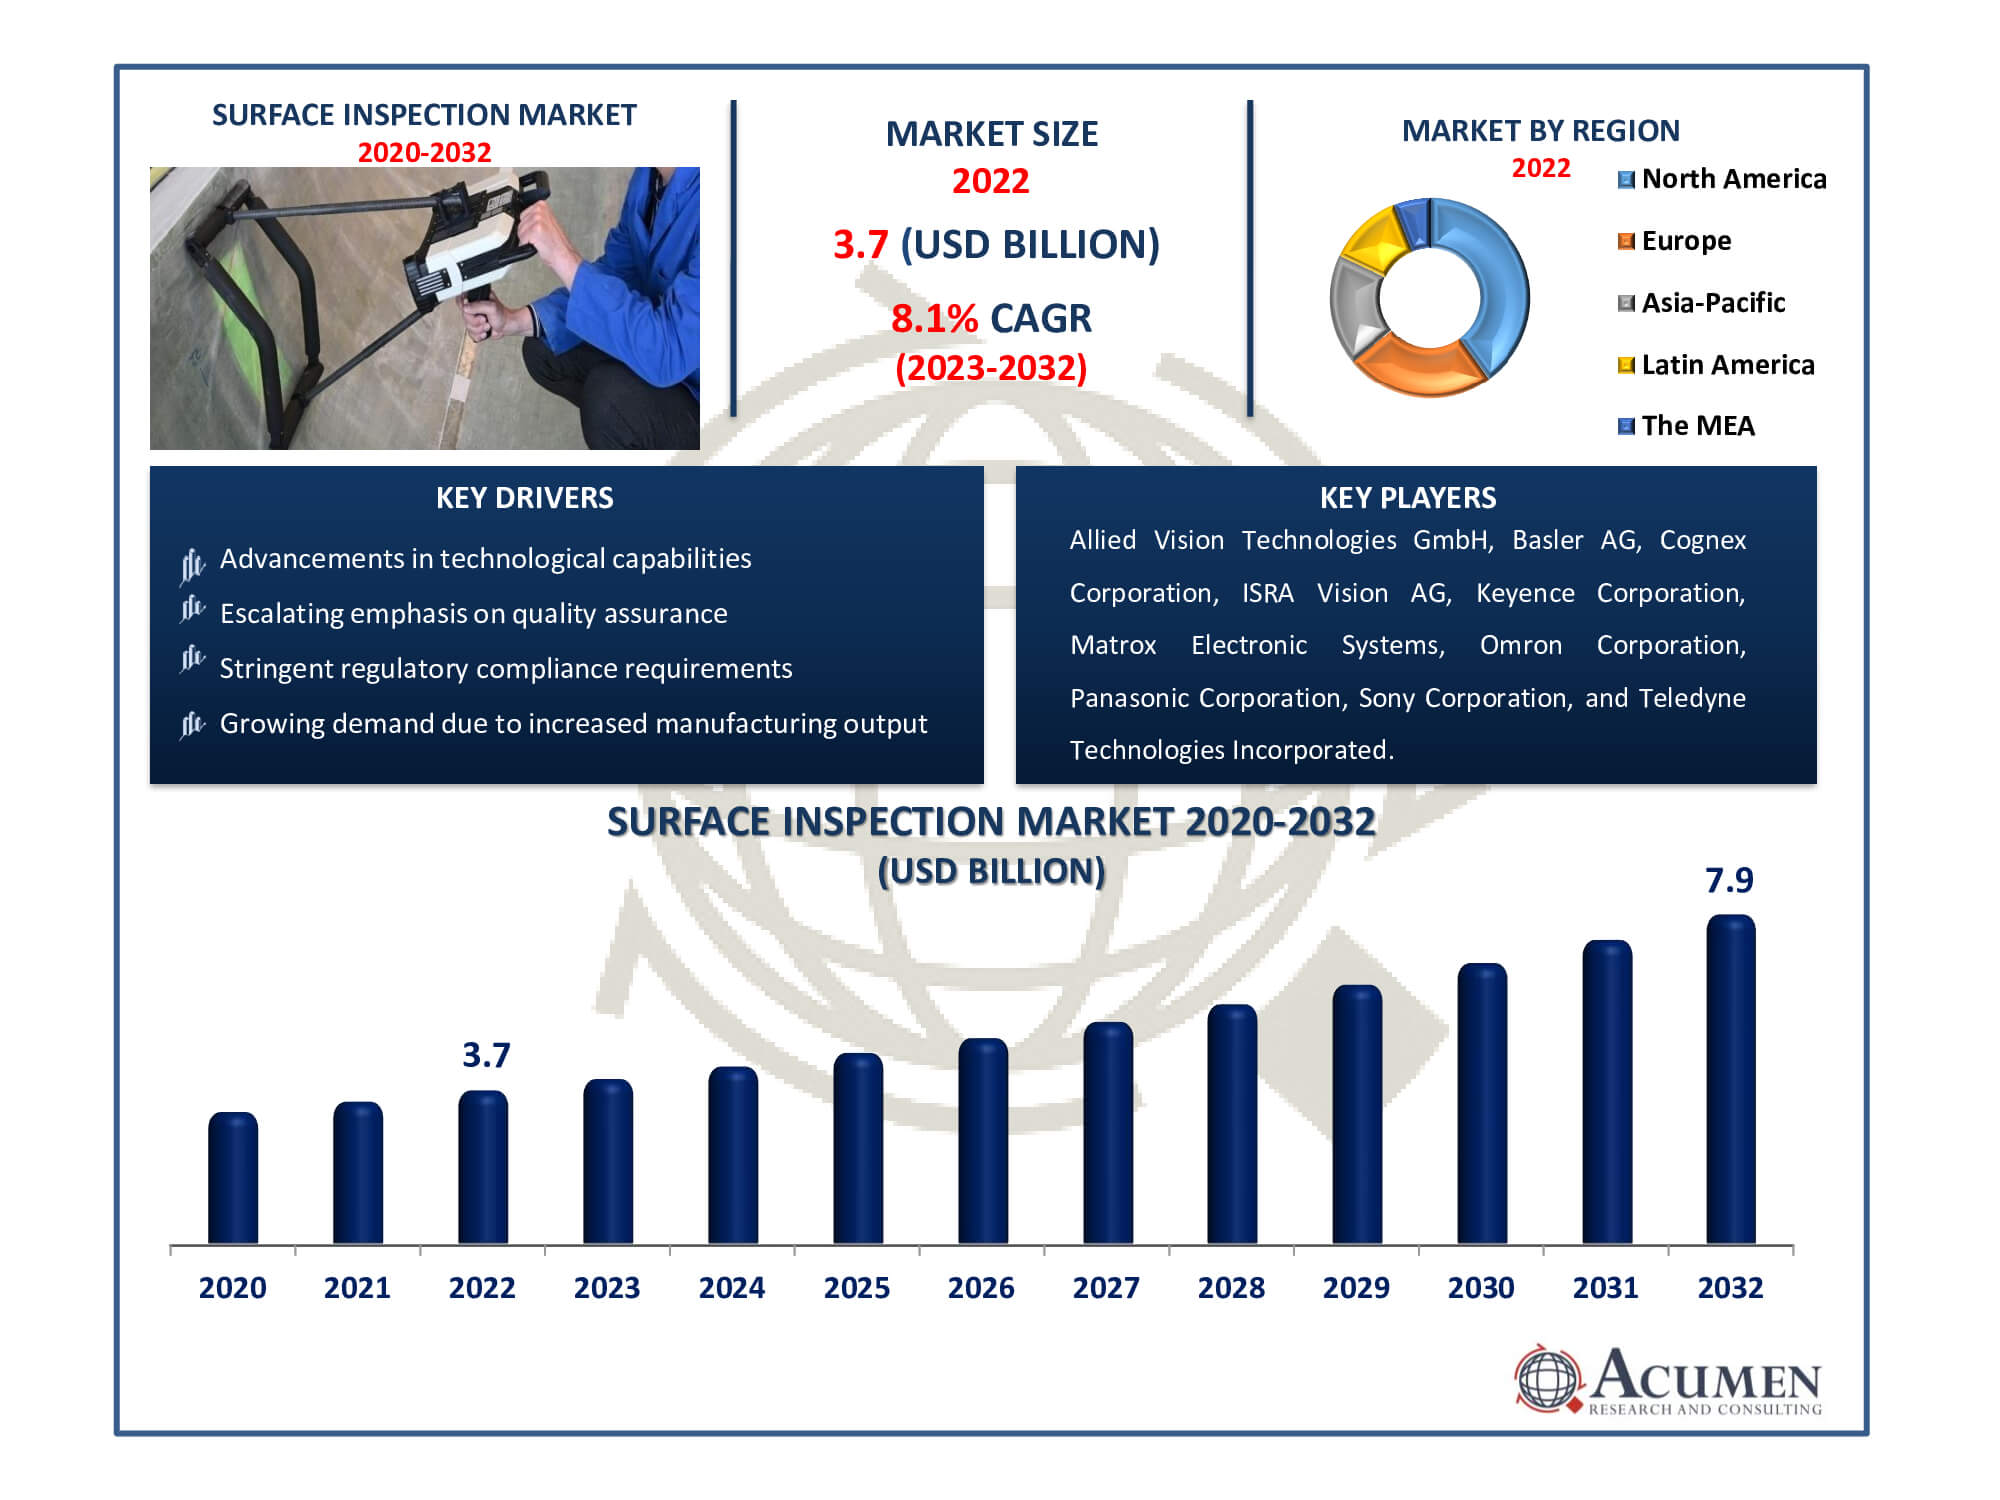
The Surface Inspection Market Size accounted for USD 3.7 Billion in 2022 and is estimated to achieve a market size of USD 7.9 Billion by 2032 growing at a CAGR of 8.1% from 2023 to 2032.
Surface Inspection Market Highlights
- Global surface inspection market revenue is poised to garner USD 7.9 billion by 2032 with a CAGR of 8.1% from 2023 to 2032
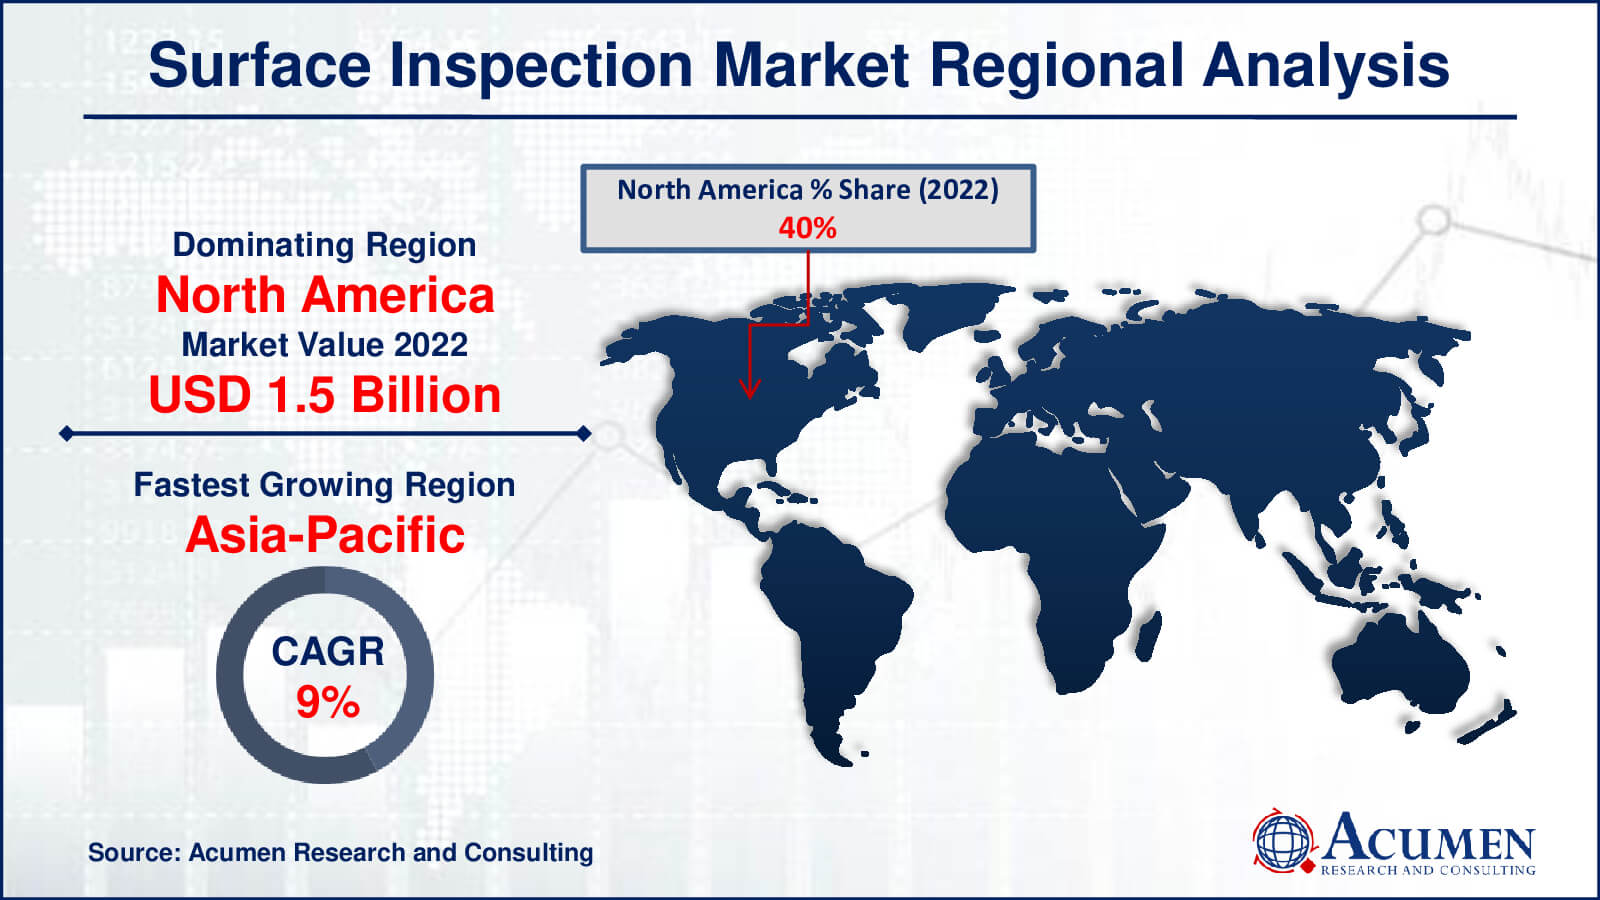
- North America surface inspection market value occupied around USD 1.5 billion in 2022
- Asia-Pacific surface inspection market growth will record a CAGR of more than 9% from 2023 to 2032
- Among type, the 3D sub-segment generated over US$ 2.0 billion revenue in 2022
- Based on application, the electronics sub-segment generated around 30% share in 2022
- Rapid innovation in technology enhancing capabilities is a popular surface inspection market trend that fuels the industry demand

Surface inspection is the automated assessment and study of surfaces with the goal of detecting defects, flaws, or irregularities in a variety of materials including metals, plastics, textiles, paper, and others. It employs specialized technologies, frequently based on machine vision technology, to inspect surfaces for flaws that could affect product quality or operation.
The surface inspection market is an important segment of the industrial quality control industry, covering technologies that maintain the integrity and consistency of surfaces in manufacturing processes. It uses cameras, sensors, and smart algorithms to thoroughly scan surfaces for defects such as scratches, cracks, dents, or irregularities. This market caters to a wide range of sectors, including automotive, electronics, textiles, packaging, and metals, by meeting the demand for high-quality, defect-free goods while improving production efficiency and minimizing waste. Surface inspection systems continue to change as technology advances, improving accuracy and enabling real-time flaw identification.
Global Surface Inspection Market Dynamics
Market Drivers
- Escalating emphasis on quality assurance
- Advancements in technological capabilities
- Stringent regulatory compliance requirements
- Growing demand due to increased manufacturing output
Market Restraints
- High initial investment costs
- Complexity in integrating systems
- Shortage of skilled workforce
Market Opportunities
- Integration with Industry 4.0 for efficiency
- Untapped potential in emerging markets
- Customization to diverse industry needs
Surface Inspection Market Report Coverage
| Market | Surface Inspection Market |
| Surface Inspection Market Size 2022 | USD 3.7 Billion |
| Surface Inspection Market Forecast 2032 | USD 7.9 Billion |
| Surface Inspection Market CAGR During 2023 - 2032 | 8.1% |
| Surface Inspection Market Analysis Period | 2020 - 2032 |
| Surface Inspection Market Base Year |
2022 |
| Surface Inspection Market Forecast Data | 2023 - 2032 |
| Segments Covered | By Type, By System, By Device, By Application, And By Geography |
| Regional Scope | North America, Europe, Asia Pacific, Latin America, and Middle East & Africa |
| Key Companies Profiled | Allied Vision Technologies GmbH, Basler AG, Cognex Corporation, ISRA Vision AG, Keyence Corporation, Matrox Electronic Systems, Omron Corporation, Panasonic Corporation, Sony Corporation, and Teledyne Technologies Incorporated. |
| Report Coverage |
Market Trends, Drivers, Restraints, Competitive Analysis, Player Profiling, Covid-19 Analysis, Regulation Analysis |
Surface Inspection Market Insights
Increased quality assurance emphasis the surface inspection market is being fueled by an increased emphasis on flawless product quality across sectors. Manufacturers prioritize perfect products as consumer expectations rise, encouraging the deployment of surface inspection devices. These technologies ensure that rigorous quality requirements are met by detecting even minor flaws, increasing customer satisfaction, and protecting brand reputation.
Rapid technological breakthroughs in machine vision, AI, and automation are propelling the industry. Surface inspection can now be more precise and efficient because to improved algorithms, high-resolution imagery, and AI-driven analysis. These technological advancements not only improve fault identification but also streamline production processes, eliminating waste and ensuring higher-quality output, fueling market growth.
High initial investment costs: One significant impediment is the high initial investment costs involved with installing sophisticated surface inspection equipment. The integration of complex technology requires significant cash, discouraging smaller businesses or industries with restricted budgets from quickly adopting these systems.
Potential for Industry 4.0 Integration: Surface inspection system integration with Industry 4.0 principles is a significant prospect. Connected, smart systems with real-time data analytics capabilities have the potential to revolutionize manufacturing lines by increasing efficiency, decreasing downtime, and optimizing quality control methods. Taking advantage of this opportunity allows manufacturers to not only increase productivity but also achieve more accuracy and consistency in their processes, hence driving market growth.
Surface Inspection Market Segmentation
The worldwide market for surface inspection is split based on type, system, device, application, and geography.
Surface Inspection Types
- 2D
- 3D
The 3D segment dominates the market according to surface inspection industry analysis due to its capacity to give more complete and detailed analysis than 2D inspection. With its depth perception capabilities, 3D surface inspection improves precision in finding faults, irregularities, and texture or shape changes across a wide range of materials and surfaces. This depth-enabled technique provides for a more thorough examination, which is especially important in complicated manufacturing processes that require precise volumetric measurements and detailed surface analysis. Because of its supremacy in capturing nuanced surface details, the 3D segment is the clear choice for businesses that require rigorous quality control and enhanced defect identification.
Surface Inspection Systems
- Computer Based System
- Camera Based System
In the surface inspection market analysis, the camera based system category has the highest share. Its prominence originates from its adaptability and applicability across multiple industries. Camera-based systems provide a low-cost solution by utilising advanced imaging technology to detect surface imperfections quickly and precisely. These systems address a wide range of production requirements, including automotive, electronics, and packaging, and provide real-time inspection capabilities that improve quality control. The camera based system segment's simplicity of integration and capacity to cover a wide range of surfaces propels it to the forefront of surface inspection solutions, pushing its market dominance.
Surface Inspection Devices
- Software
- Camera
- Fragrabber
- Optics
- Processor
The camera sector is the largest in the market and it is expected to hold position throughout the surface inspection market forecast period. Cameras are critical because they are the principal sensory devices that capture surface data. Their broad application in areas such as manufacturing, automotive, and electronics reinforces their supremacy. Cameras offer precise imaging, which is critical for defect detection and quality control. Their adaptability in handling various surfaces, as well as their connection with advanced software and computers, make them indispensable. As businesses prioritise high-quality production, the demand for camera equipment for thorough surface analysis continues to fuel this segment's market leadership.
Surface Inspection Applications
- Automotive
- Electronics
- Medical and Pharmaceutical
- Semiconductor
- Other
The electronics category is the largest in the surface inspection market. Because of the sensitivity of the components, electronic manufacturing necessitates rigorous surface examination. Surface flaws can have an impact on functionality and dependability. The industry requires high precision in detecting faults such as scratches, cracks, or other errors. Because electronics include a wide range of products, from consumer electronics to complex circuitry, the necessity for immaculate surfaces pushes the deployment of advanced inspection tools. The emphasis on quality and dependability in this sector reinforces the Electronics segment's dominance in the surface inspection market.
Surface Inspection Market Regional Outlook
North America
- U.S.
- Canada
Europe
- U.K.
- Germany
- France
- Spain
- Rest of Europe
Asia-Pacific
- India
- Japan
- China
- Australia
- South Korea
- Rest of Asia-Pacific
Latin America
- Brazil
- Mexico
- Rest of Latin America
The Middle East & Africa
- South Africa
- GCC Countries
- Rest of the Middle East & Africa (ME&A)

Surface Inspection Market Regional Analysis
North America dominates the surface inspection market due to a variety of factors. The region has a dynamic technological environment and a substantial presence of businesses that rely heavily on tight quality control techniques, such as automotive, electronics, and aerospace. With a focus on innovation and quality assurance, North American industries were early adopters of new surface inspection technologies. Furthermore, the region's tight regulatory structure and dedication to maintaining top product quality drive adoption of these technologies. Furthermore, a mature industrial sector and large investments in R&D contribute to North America's leadership position in the surface inspection industry, ensuring cutting-edge technology and sustaining high production standards.
The rapid economic expansion and increased manufacturing activities in Asia-Pacific place it as the fastest-growing region in the surface inspection market. The region's expanding industrial landscape, particularly in China, Japan, South Korea, and India, is driving the increased adoption of surface inspection technology. Growing industrialization, particularly in the automotive, electronics, and semiconductor industries, raises the need for high-quality products, necessitating precise surface inspection. Furthermore, the region's emphasis on technical improvements, combined with increased investments in automation and quality control methods, drives the Asia-Pacific surface inspection market's quick expansion. Asia-Pacific is emerging as a hotbed for surface inspection technology adoption and market expansion as industries strive for efficiency and quality.
Surface Inspection Market Players
Some of the top surface inspection companies offered in our report includes Allied Vision Technologies GmbH, Basler AG, Cognex Corporation, ISRA Vision AG, Keyence Corporation, Matrox Electronic Systems, Omron Corporation, Panasonic Corporation, Sony Corporation, and Teledyne Technologies Incorporated.
Frequently Asked Questions
How big is the surface inspection market?
The surface inspection market size was USD 3.7 billion in 2022.
What is the CAGR of the global surface inspection market from 2023 to 2032?
The CAGR of Surface Inspection is 8.1% during the analysis period of 2023 to 2032.
Which are the key players in the surface inspection market?
The key players operating in the global market are including Allied Vision Technologies GmbH, Basler AG, Cognex Corporation, ISRA Vision AG, Keyence Corporation, Matrox Electronic Systems, Omron Corporation, Panasonic Corporation, Sony Corporation, and Teledyne Technologies Incorporated.
Which region dominated the global surface inspection market share?
North America held the dominating position in surface inspection industry during the analysis period of 2023 to 2032.
Which region registered fastest CAGR from 2023 to 2032?
Asia-Pacific region exhibited fastest growing CAGR for market of Surface Inspection during the analysis period of 2023 to 2032.
What are the current trends and dynamics in the global surface inspection industry?
The current trends and dynamics in the surface inspection industry include escalating emphasis on quality assurance, advancements in technological capabilities, stringent regulatory compliance requirements, and growing demand due to increased manufacturing output.
Which type held the maximum share in 2022?
The 3D type held the maximum share of the surface inspection industry.


