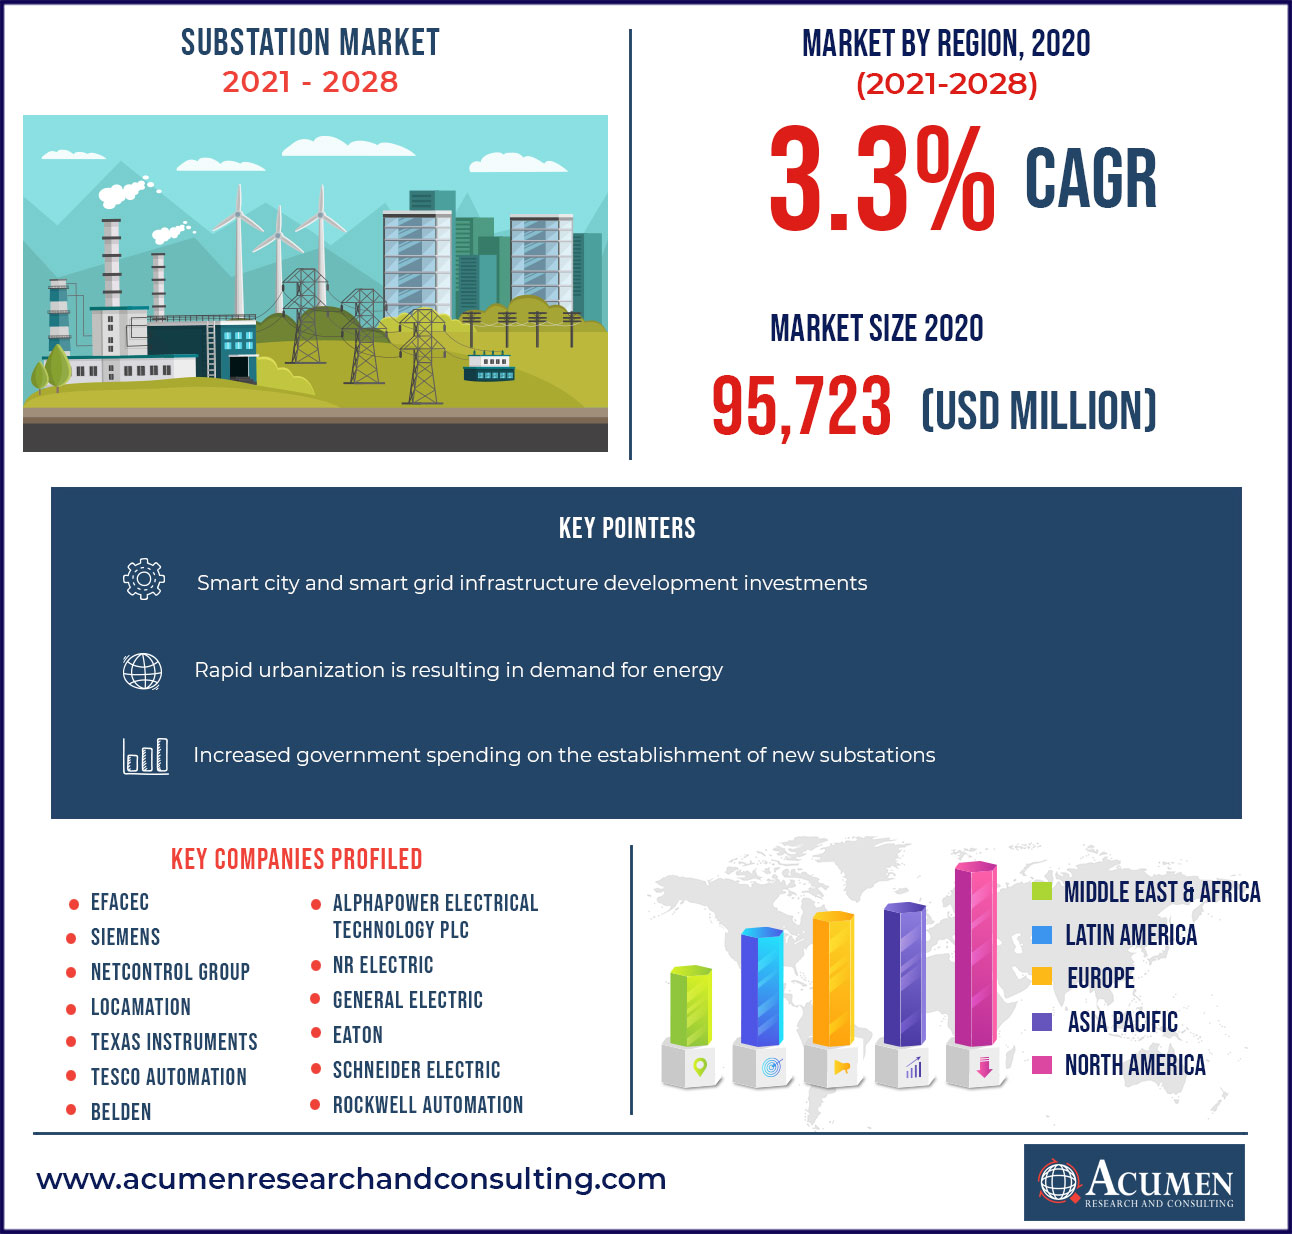
The Global Substation Market was worth US$ 95,723 million in 2020 and is predicted to grow to US$ 1,23,417 million by 2028 with a CAGR of 3.3% from 2021 to 2028.
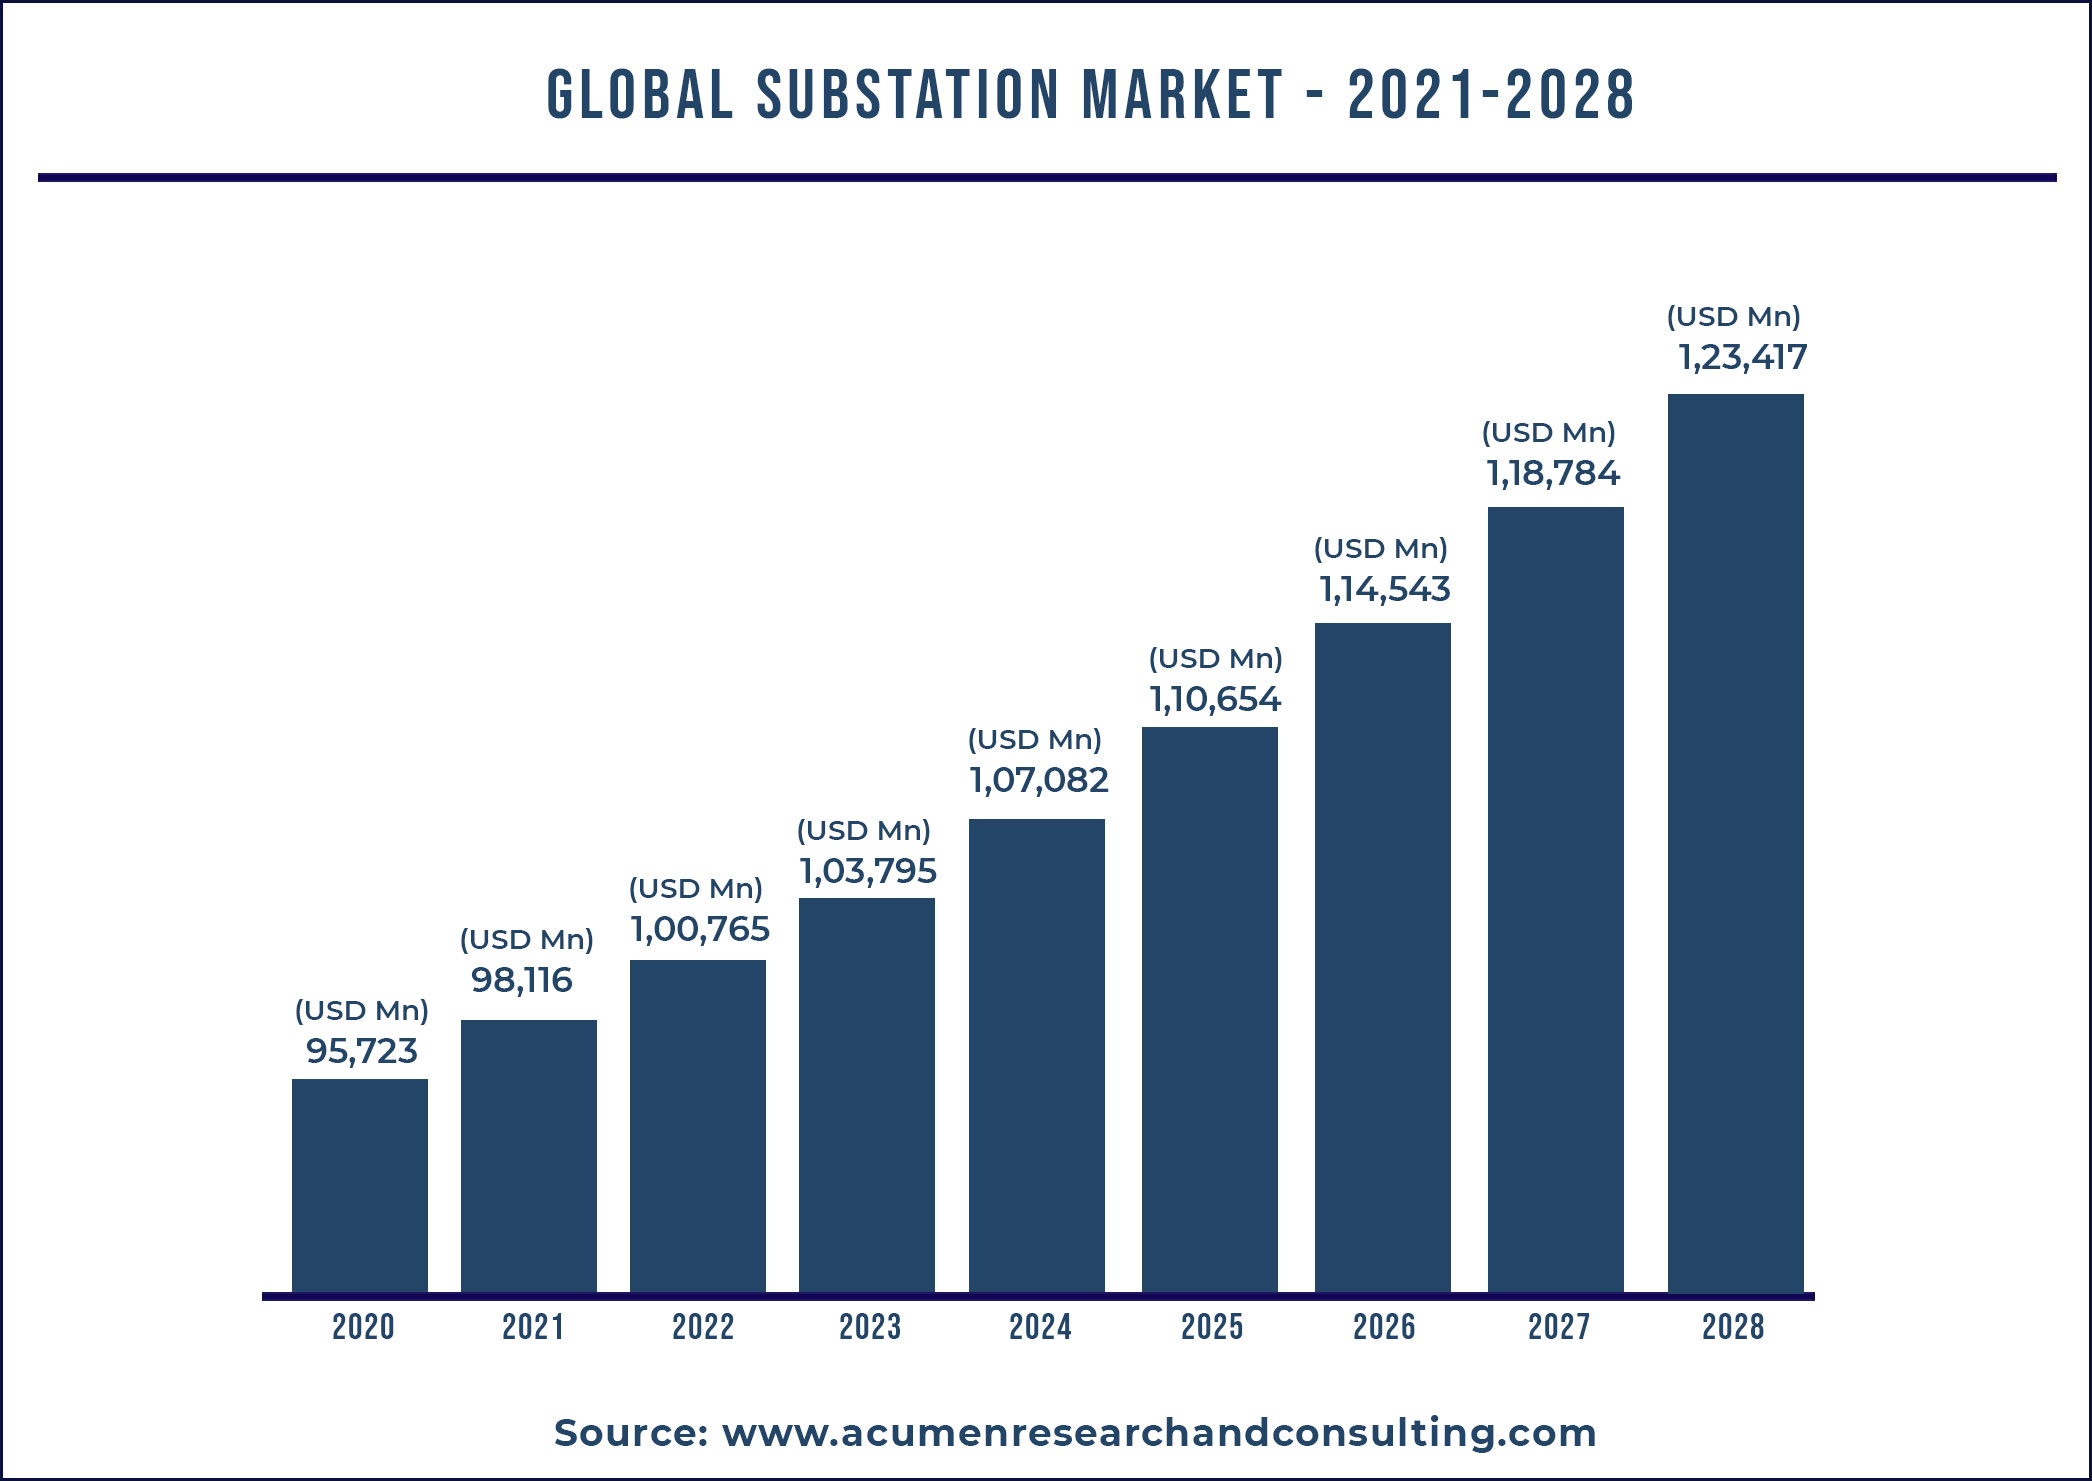
According to the US Energy Information Administration, the US government spending on electric transmission systems was US$ 40 Bn in 2019 and is increasing with the changing year. In India, there are about 245 substations with 371,912 MVA of substation capacity. Rapid industrialization and urbanization in the country, coupled with new substation development projects are expected to fuel the market growth. A country with continuous economic development and an approach towards the adoption of renewable energy through the integration of automation is expected to impact the market growth. In 2020, the Power Grid Corp. of India, supported the automation growth implemented IEC 61850-based grid substation automation in more than 100 substations across the country. This implementation is expected to help companies enhance their operational efficiency.
Market Growth Drivers:
- Rapid urbanization is resulting in growing demand for energy
- Smart city and smart grid infrastructure development investments
Market Restraints
- High initial set-up costs linked with substations
- Growing concerns over cyber attacks
Market Opportunities:
- Increased government spending on the establishment of new substations
- Rising demand for renewable energy projects
Covid-19 Impact on the Global Substation Industry
The global economy experienced a minor downturn in the overall industry environment during the COVID-19 pandemic. Some countries stopped their manufacturing facilities and infrastructure projects in 2020, which slightly impacted the power generation industry. Nevertheless, the restart of the operations across manufacturing facilities, infrastructure projects, and power plants is likely to create numerous growth opportunities for the global substation market.
Report Coverage:
Market |
Substation Market |
Market Size 2020 |
US $95,723 Mn |
Market Forecast 2028 |
US $1,23,417 Mn |
CAGR |
3.3 % During 2021 - 2028 |
Analysis Period |
2017 - 2028 |
Base Year |
2020 |
Forecast Data |
2021 - 2028 |
Segments Covered |
By Technology, By Component and By Connectivity By Application By Voltage Level By End-Use and By Geography
|
Regional Scope |
North America, Europe, Asia Pacific, Latin America, and Middle East & Africa |
Key Companies Profiled |
Efacec, Siemens, NetControl Group, Locamation, Texas Instruments, Tesco Automation, Belden, Alphapower Electrical Technology PLC, NR Electric, General Electric, and others. |
Report Coverage
|
Market Trends, Drivers, Restraints, Competitive Analysis, Player Profiling, Regulation Analysis |
Customization Scope |
10 hrs of free customization and expert consultation
|
Market Dynamics
Increasing energy demand, inclination towards digitalization of energy sector and increasing government spending on infrastructure development are factors expected to augment the growth of global substation market. The governments of developed and developing countries are spending a large amount on the development of advanced energy infrastructure. Their approach towards providing unstoppable power to the residential and industrial sector is gaining traction.
Developed countries' inclination towards shifting their energy source from coal to green energy is gaining importance. They are spending high on the deployment of new solar and wind projects to harness the maximum amount of energy to cater to the rising demand. In 2021, the government of US jumpstarted the offshore wind energy projects that will help to build new American infrastructure and a clean energy economy. They announced the new “Wind Energy Area” projects in New York Bight. Enterprises are focused on enhancing the business by establishing new substations for better energy flow and easy access to wind energy.
Market Segmentation
The global substation market is segmented based on technology, component, connectivity, application, voltage type, end-use, and region.
Market by Technology
Among technology, the digital segment conquered the maximum market share. Some of the major factors driving the expansion of the digital technology segment include surging power demand with limited space availability, bigger infrastructure development in smart cities, and rising need for renewable energy projects and battery technology to produce electricity.In addition, the continued trend towards electrification via off-grid networks and renewable electricity infrastructure will have a beneficial impact on technology adoption.
Market by Component
• Electrical System
- Transformer
- Busbar
- Protection Devices
- Circuit Breaker
- Protective Relay
- Switchgear
• Substation Automation System
• Communication Network
• Monitoring & Control System
- Human Machine Interface
- Programmable Logic Controller
- Others
• Others
Based on the component segment, the substation automation system registered significant growth in the year 2020. The advent of cloud computing and deployment of IoT are the two major trends that would integrate substation automation to derive operational and financial benefits. Increasing investment in renewable energy projects to meet energy demand creates a variety of potential prospects in the global market throughout the anticipated period. According to the International Energy Agency's (IEA) forecasts, renewable energy sources generated 25% of the world's electricity in 2019. Thus, heavy investments in numerous wind and solar energy plants escalate the demand for substation automation industry.
Market by Connectivity
- ≤ 33 kV
- > 110 kV to ≤ 220 kV
- > 220 kV to ≤ 550 kV
- > 33 kV to ≤ 110 kV
- >550 kV
The ≤ 33 kV segment is expected to gather a substantial market share by 2028 displaying a consistent growth rate during the forecast period from 2021 to 2028.
Market by Application
- Transmission
- Distribution
In 2020, the transmission segment is expected to account for an impressive market share during the forecast period 2021 – 2028. The transmission application allows the flow of electricity to multiple parallel inter-connections so that power can be transmitted effortlessly over long distances from any generator to any end user. These substations have high-voltage switches that allow transmission lines to be connected or disconnected in the event of a malfunction or repair work.
Market by Voltage Level
In 2020, the high voltage segment gained a significant impetus owing to the growing demand of high voltage electricity in developed as well as developing countries. Meanwhile, the medium and low segment witnessed a stable growth in the market as they have a bigger demand in small and medium industries.
Market by End-Use
Among the end-use segment, the utility dominated the market with the highest shares in 2020. Rigorous regulatory compliances and government directives toward utility-aided grid networks in terms of electric infrastructure deployment will supplement market demand for digital substations. Furthermore, the use of energy-efficient, simple-to-install, and dependable intelligent technology are some of the factors that will improve the end-user implementation.
Substation Market Regional Overview
North America
Europe
- U.K.
- Germany
- France
- Spain
- Rest of Europe
Latin America
- Brazil
- Mexico
- Rest of Latin America
Asia-Pacific
- China
- Japan
- India
- Australia
- South Korea
- Rest of Asia-Pacific
Middle East & Africa
- GCC
- South Africa
- Rest of Middle East & Africa
Substation Market Regional Overview
APAC region registered the highest CAGR due to growing number of investments in the power sector
North American region accounted for the majority of the share in 2020 owing to the growing development of smart grid networks and restoration & retrofit of existing grid infrastructure. During the foreseeable period, the APAC region will experience rapid expansion. The region's rapid growth can be linked to increased peak load demand, the proliferation of micro-grid networks, and concerns about grid stability and supply security. China, India, and South Korea are three of the region's most important countries, all of which are expected to contribute to market growth. India, Singapore, Taiwan, and South Korea have all been recognized as potential investment destinations for multinational corporations from the West, notably in the fields of technology and healthcare. This suggests that APAC is investing heavily in the power sector. Furthermore, the Asia-Pacific Energy Cooperation (APEC) has set a goal of reducing APAC's total energy consumption by 45% by 2035 and encouraging sustainable energy practices.
Substation Market Competitive Landscape
This section of the report pinpoints various key vendors of the market. Some of the prominent vendors offered in the report include Efacec, Siemens, NetControl Group, Locamation, Texas Instruments, Tesco Automation, Belden, Alphapower Electrical Technology PLC, NR Electric, General Electric, and others.
Companies operating in the market are adopting a series of strategic activities to grab a significant hold in the competitive scenario. For instance, in 2021, Kiewit Corp. is expected to build the first U.S. offshore wind substation. The company is expected to develop the substation in 555-acre oil and gas fabrication facility in Texas.
In 2021, Aker Offshore Wind announced it will develop the first offshore wind underwater substation for Scotland. The substation will move energy created by wind turbines into homes and businesses. The substation will be placed underwater with the focus to lower the maintenance cost and increase the efficiency. As the substation is situated under water it provides better cooling, temperature stability, and better efficiency.
CHAPTER 1. Industry Overview of Substation
1.1. Definition and Scope
1.1.1. Definition of Substation
1.1.2. Market Segmentation
1.1.3. Years Considered for the Study
1.1.4. Assumptions and Acronyms Used
1.1.4.1. Market Assumptions and Market Forecast
1.1.4.2. Acronyms Used in Global Substation market
1.2. Summary
1.2.1. Executive Summary
1.2.2. Substation By Technology
1.2.3. Substation By Component
1.2.4. Substation By Connectivity
1.2.5. Substation By Application
1.2.6. Substation By Voltage Type
1.2.7. Substation By End-Use
1.2.8. Substation by Regions
CHAPTER 2. Research Approach
2.1. Methodology
2.1.1. Research Programs
2.1.2. Market Size Estimation
2.1.3. Market Breakdown and Data Triangulation
2.2. Data Technology
2.2.1. Secondary Sources
2.2.2. Primary Sources
CHAPTER 3. Market Dynamics And Competition Analysis
3.1. Market Drivers
3.1.1. Driver 1
3.1.2. Driver 2
3.2. Restraints and Challenges
3.2.1. Restraint 1
3.2.2. Restraint 2
3.3. Growth Opportunities
3.3.1. Opportunity 1
3.3.2. Opportunity 2
3.4. Porter’s Five Forces Analysis
3.4.1. Bargaining Power of Suppliers
3.4.2. Bargaining Power of Buyers
3.4.3. Threat of Substitute
3.4.4. Threat of New Entrants
3.4.5. Degree of Competition
3.5. Market Concentration Ratio and Market Maturity Analysis of Substation Market
3.5.1. Go To Market Strategy
3.5.1.1. Introduction
3.5.1.2. Growth
3.5.1.3. Maturity
3.5.1.4. Saturation
3.5.1.5. Possible Development
3.6. Technological Roadmap for Substation Market
3.7. Value Chain Analysis
3.7.1. List of Key Manufacturers
3.7.2. List of Customers
3.7.3. Level of Integration
3.8. Cost Structure Analysis
3.8.1. Price Trend of Key Raw Materials
3.8.2. Raw Material Suppliers
3.8.3. Proportion of Manufacturing Cost Structure
3.8.3.1. Raw Material
3.8.3.2. Labor Cost
3.8.3.3. Manufacturing Expense
3.9. Regulatory Compliance
3.10. Competitive Landscape, 2019
3.10.1. Player Positioning Analysis
3.10.2. Key Strategies Adopted By Leading Players
CHAPTER 4. Manufacturing Plant Analysis
4.1. Manufacturing Plant Location and Establish Date of Major Manufacturers in 2019
4.2. R&D Status of Substation Major Manufacturers in 2019
CHAPTER 5. Substation By Technology
5.1. Introduction
5.2. Substation Revenue ByTechnology
5.2.1. Substation Revenue (US$ Mn) and Forecast, By Technology, 2017-2028
5.2.2. Conventional
5.2.2.1. Conventional Market Revenue (US$ Mn) and Growth Rate (%), 2017-2028
5.2.3. Digital
5.2.3.1. DigitalMarket Revenue (US$ Mn) and Growth Rate (%), 2017-2028
CHAPTER 6. Substation Market By Component
6.1. Introduction
6.2. Substation Revenue (US$ Mn) By Component
6.2.1. Substation Revenue (US$ Mn) and Forecast By Component, 2017-2028
6.2.2. Electrical System
6.2.2.1. Electrical System Market Revenue (US$ Mn) and Growth Rate (%), 2017-2028
6.2.2.2. Transformer
6.2.2.2.1. Transformer Market Revenue (US$ Mn) and Growth Rate (%), 2017-2028
6.2.2.3. Busbar
6.2.2.3.1. Busbar Market Revenue (US$ Mn) and Growth Rate (%), 2017-2028
6.2.2.4. Protection Devices
6.2.2.4.1. Protection Devices Market Revenue (US$ Mn) and Growth Rate (%), 2017-2028
6.2.2.4.2. Circuit Breaker
6.2.2.4.3. Protective Relay
6.2.2.4.4. Switchgear
6.2.3. Substation Automation System
6.2.3.1. Substation Automation System Market Revenue (US$ Mn) and Growth Rate (%), 2017-2028
6.2.4. Communication Network
6.2.4.1. Communication Network Market Revenue (US$ Mn) and Growth Rate (%), 2017-2028
6.2.5. Monitoring & Control System
6.2.5.1. Monitoring & Control System Market Revenue (US$ Mn) and Growth Rate (%), 2017-2028
6.2.5.2. Human Machine Interface
6.2.5.2.1. Human Machine Interface Market Revenue (US$ Mn) and Growth Rate (%), 2017-2028
6.2.5.3. Programmable Logic Controller
6.2.5.3.1. Programmable Logic Controller Market Revenue (US$ Mn) and Growth Rate (%), 2017-2028
6.2.5.4. Others
6.2.5.4.1. Others Market Revenue (US$ Mn) and Growth Rate (%), 2017-2028
6.2.6. Others
6.2.6.1. Others Market Revenue (US$ Mn) and Growth Rate (%), 2017-2028
CHAPTER 7. Substation Market By Connectivity
7.1. Introduction
7.2. Substation Revenue (US$ Mn) By Connectivity
7.2.1. Substation Revenue (US$ Mn) and Forecast ByConnectivity, 2017-2028
7.2.2. ≤ 33 kV
7.2.2.1. ≤ 33 kV Market Revenue (US$ Mn) and Growth Rate (%), 2017-2028
7.2.3. > 33 kV to ≤ 110 kV
7.2.3.1. > 33 kV to ≤ 110 kV Market Revenue (US$ Mn) and Growth Rate (%), 2017-2028
7.2.4. > 110 kV to ≤ 220 kV
7.2.4.1. > 110 kV to ≤ 220 kV Market Revenue (US$ Mn) and Growth Rate (%), 2017-2028
7.2.5. > 220 kV to ≤ 550 kV
7.2.5.1. > 220 kV to ≤ 550 kV Market Revenue (US$ Mn) and Growth Rate (%), 2017-2028
7.2.6. > 550 kV
7.2.6.1. > 550 kV Market Revenue (US$ Mn) and Growth Rate (%), 2017-2028
CHAPTER 8. Substation Market By Application
8.1. Introduction
8.2. Substation Revenue (US$ Mn) By Application
8.2.1. Substation Revenue (US$ Mn) and Forecast ByApplication, 2017-2028
8.2.2. Transmission
8.2.2.1. Transmission Market Revenue (US$ Mn) and Growth Rate (%), 2017-2028
8.2.3. Distribution
8.2.3.1. Distribution Market Revenue (US$ Mn) and Growth Rate (%), 2017-2028
CHAPTER 9. Substation Market By Voltage Type
9.1. Introduction
9.2. Substation Revenue (US$ Mn) By Voltage Type
9.2.1. Substation Revenue (US$ Mn) and Forecast ByVoltage Type, 2017-2028
9.2.2. High Voltage
9.2.2.1. High Voltage Market Revenue (US$ Mn) and Growth Rate (%), 2017-2028
9.2.3. Medium Voltage
9.2.3.1. Medium Voltage Market Revenue (US$ Mn) and Growth Rate (%), 2017-2028
9.2.4. Low Voltage
9.2.4.1. Low Voltage Market Revenue (US$ Mn) and Growth Rate (%), 2017-2028
CHAPTER 10. Substation Market By End-Use
10.1. Introduction
10.2. Substation Revenue (US$ Mn) By End-Use
10.2.1. Substation Revenue (US$ Mn) and Forecast ByEnd-Use, 2017-2028
10.2.2. Utility
10.2.2.1. Utility Market Revenue (US$ Mn) and Growth Rate (%), 2017-2028
10.2.3. Industrial
10.2.3.1. Industrial Market Revenue (US$ Mn) and Growth Rate (%), 2017-2028
CHAPTER 11. North America Substation Market By Country
11.1. North America Substation Overview
11.1.1. U.S.
11.1.1.1. U.S. Substation Revenue (US$ Mn) and Forecast ByTechnology, 2017-2028
11.1.1.2. U.S. Substation Revenue (US$ Mn) and Forecast ByComponent, 2017-2028
11.1.1.3. U.S. Substation Revenue (US$ Mn) and Forecast ByConnectivity, 2017-2028
11.1.1.4. U.S. Substation Revenue (US$ Mn) and Forecast ByApplication, 2017-2028
11.1.1.5. U.S. Substation Revenue (US$ Mn) and Forecast ByVoltage Type, 2017-2028
11.1.1.6. U.S. Substation Revenue (US$ Mn) and Forecast ByEnd-Use, 2017-2028
11.1.2. Canada
11.1.2.1. Canada Substation Revenue (US$ Mn) and Forecast ByTechnology, 2017-2028
11.1.2.2. Canada Substation Revenue (US$ Mn) and Forecast ByComponent, 2017-2028
11.1.2.3. Canada Substation Revenue (US$ Mn) and Forecast ByConnectivity, 2017-2028
11.1.2.4. Canada Substation Revenue (US$ Mn) and Forecast ByApplication, 2017-2028
11.1.2.5. Canada Substation Revenue (US$ Mn) and Forecast ByVoltage Type, 2017-2028
11.1.2.6. Canada Substation Revenue (US$ Mn) and Forecast ByEnd-Use, 2017-2028
11.2. North America PEST Analysis
CHAPTER 12. Europe Substation Market By Country
12.1. Europe Substation Overview
12.1.1. U.K.
12.1.1.1. U.K. Substation Revenue (US$ Mn) and Forecast ByTechnology, 2017-2028
12.1.1.2. U.K. Substation Revenue (US$ Mn) and Forecast ByComponent, 2017-2028
12.1.1.3. U.K. Substation Revenue (US$ Mn) and Forecast ByConnectivity, 2017-2028
12.1.1.4. U.K. Substation Revenue (US$ Mn) and Forecast ByApplication, 2017-2028
12.1.1.5. U.K. Substation Revenue (US$ Mn) and Forecast ByVoltage Type, 2017-2028
12.1.1.6. U.K. Substation Revenue (US$ Mn) and Forecast ByEnd-Use, 2017-2028
12.1.2. Germany
12.1.2.1. Germany Substation Revenue (US$ Mn) and Forecast ByTechnology, 2017-2028
12.1.2.2. Germany Substation Revenue (US$ Mn) and Forecast ByComponent, 2017-2028
12.1.2.3. Germany Substation Revenue (US$ Mn) and Forecast ByConnectivity, 2017-2028
12.1.2.4. Germany Substation Revenue (US$ Mn) and Forecast ByApplication, 2017-2028
12.1.2.5. GermanySubstation Revenue (US$ Mn) and Forecast ByVoltage Type, 2017-2028
12.1.2.6. Germany Substation Revenue (US$ Mn) and Forecast ByEnd-Use, 2017-2028
12.1.3. France
12.1.3.1. France Substation Revenue (US$ Mn) and Forecast ByTechnology, 2017-2028
12.1.3.2. France Substation Revenue (US$ Mn) and Forecast ByComponent, 2017-2028
12.1.3.3. France Substation Revenue (US$ Mn) and Forecast ByConnectivity, 2017-2028
12.1.3.4. France Substation Revenue (US$ Mn) and Forecast ByApplication, 2017-2028
12.1.3.5. FranceSubstation Revenue (US$ Mn) and Forecast ByVoltage Type, 2017-2028
12.1.3.6. France Substation Revenue (US$ Mn) and Forecast ByEnd-Use, 2017-2028
12.1.4. Spain
12.1.4.1. Spain Substation Revenue (US$ Mn) and Forecast ByTechnology, 2017-2028
12.1.4.2. Spain Substation Revenue (US$ Mn) and Forecast ByComponent, 2017-2028
12.1.4.3. Spain Substation Revenue (US$ Mn) and Forecast ByConnectivity, 2017-2028
12.1.4.4. Spain Substation Revenue (US$ Mn) and Forecast ByApplication, 2017-2028
12.1.4.5. Spain Substation Revenue (US$ Mn) and Forecast ByVoltage Type, 2017-2028
12.1.4.6. Spain Substation Revenue (US$ Mn) and Forecast ByEnd-Use, 2017-2028
12.1.5. Rest of Europe
12.1.5.1. Rest of Europe Substation Revenue (US$ Mn) and Forecast ByTechnology, 2017-2028
12.1.5.2. Rest of Europe Substation Revenue (US$ Mn) and Forecast ByComponent, 2017-2028
12.1.5.3. Rest of Europe Substation Revenue (US$ Mn) and Forecast ByConnectivity, 2017-2028
12.1.5.4. Rest of Europe Substation Revenue (US$ Mn) and Forecast ByApplication, 2017-2028
12.1.5.5. Rest of EuropeSubstation Revenue (US$ Mn) and Forecast ByVoltage Type, 2017-2028
12.1.5.6. Rest of Europe Substation Revenue (US$ Mn) and Forecast By End-Use, 2017-2028
12.2. Europe PEST Analysis
CHAPTER 13. Asia Pacific Substation Market By Country
13.1. Asia Pacific Substation Overview
13.1.1. China
13.1.1.1. China Substation Revenue (US$ Mn) and Forecast ByTechnology, 2017-2028
13.1.1.2. China Substation Revenue (US$ Mn) and Forecast ByComponent, 2017-2028
13.1.1.3. China Substation Revenue (US$ Mn) and Forecast ByConnectivity, 2017-2028
13.1.1.4. China Substation Revenue (US$ Mn) and Forecast ByApplication, 2017-2028
13.1.1.5. ChinaSubstation Revenue (US$ Mn) and Forecast ByVoltage Type, 2017-2028
13.1.1.6. China Substation Revenue (US$ Mn) and Forecast ByEnd-Use, 2017-2028
13.1.2. Japan
13.1.2.1. Japan Substation Revenue (US$ Mn) and Forecast ByTechnology, 2017-2028
13.1.2.2. Japan Substation Revenue (US$ Mn) and Forecast ByComponent, 2017-2028
13.1.2.3. Japan Substation Revenue (US$ Mn) and Forecast ByConnectivity, 2017-2028
13.1.2.4. Japan Substation Revenue (US$ Mn) and Forecast ByApplication, 2017-2028
13.1.2.5. JapanSubstation Revenue (US$ Mn) and Forecast ByVoltage Type, 2017-2028
13.1.2.6. Japan Substation Revenue (US$ Mn) and Forecast By End-Use, 2017-2028
13.1.3. India
13.1.3.1. India Substation Revenue (US$ Mn) and Forecast ByTechnology, 2017-2028
13.1.3.2. India Substation Revenue (US$ Mn) and Forecast ByComponent, 2017-2028
13.1.3.3. India Substation Revenue (US$ Mn) and Forecast ByConnectivity, 2017-2028
13.1.3.4. India Substation Revenue (US$ Mn) and Forecast ByApplication, 2017-2028
13.1.3.5. IndiaSubstation Revenue (US$ Mn) and Forecast ByVoltage Type, 2017-2028
13.1.3.6. India Substation Revenue (US$ Mn) and Forecast ByEnd-Use, 2017-2028
13.1.4. Australia
13.1.4.1. Australia Substation Revenue (US$ Mn) and Forecast ByTechnology, 2017-2028
13.1.4.2. Australia Substation Revenue (US$ Mn) and Forecast ByComponent, 2017-2028
13.1.4.3. Australia Substation Revenue (US$ Mn) and Forecast ByConnectivity, 2017-2028
13.1.4.4. Australia Substation Revenue (US$ Mn) and Forecast ByApplication, 2017-2028
13.1.4.5. AustraliaSubstation Revenue (US$ Mn) and Forecast ByVoltage Type, 2017-2028
13.1.4.6. Australia Substation Revenue (US$ Mn) and Forecast ByEnd-Use, 2017-2028
13.1.5. South Korea
13.1.5.1. South Korea Substation Revenue (US$ Mn) and Forecast ByTechnology, 2017-2028
13.1.5.2. South Korea Substation Revenue (US$ Mn) and Forecast ByComponent, 2017-2028
13.1.5.3. South Korea Substation Revenue (US$ Mn) and Forecast ByConnectivity, 2017-2028
13.1.5.4. South Korea Substation Revenue (US$ Mn) and Forecast ByApplication, 2017-2028
13.1.5.5. South KoreaSubstation Revenue (US$ Mn) and Forecast ByVoltage Type, 2017-2028
13.1.5.6. South Korea Substation Revenue (US$ Mn) and Forecast ByEnd-Use, 2017-2028
13.1.6. Rest of Asia-Pacific
13.1.6.1. Rest of Asia-Pacific Substation Revenue (US$ Mn) and Forecast ByTechnology, 2017-2028
13.1.6.2. Rest of Asia-Pacific Substation Revenue (US$ Mn) and Forecast ByComponent, 2017-2028
13.1.6.3. Rest of Asia-Pacific Substation Revenue (US$ Mn) and Forecast ByConnectivity, 2017-2028
13.1.6.4. Rest of Asia-Pacific Substation Revenue (US$ Mn) and Forecast ByApplication, 2017-2028
13.1.6.5. Rest of Asia-PacificSubstation Revenue (US$ Mn) and Forecast ByVoltage Type, 2017-2028
13.1.6.6. Rest of Asia-Pacific Substation Revenue (US$ Mn) and Forecast ByEnd-Use, 2017-2028
13.2. Asia Pacific PEST Analysis
CHAPTER 14. Latin America Substation Market By Country
14.1. Latin AmericaSubstation Overview
14.1.1. Brazil
14.1.1.1. Brazil Substation Revenue (US$ Mn) and Forecast ByTechnology, 2017-2028
14.1.1.2. Brazil Substation Revenue (US$ Mn) and Forecast ByComponent, 2017-2028
14.1.1.3. Brazil Substation Revenue (US$ Mn) and Forecast ByConnectivity, 2017-2028
14.1.1.4. Brazil Substation Revenue (US$ Mn) and Forecast ByApplication, 2017-2028
14.1.1.5. Brazil Substation Revenue (US$ Mn) and Forecast ByVoltage Type, 2017-2028
14.1.1.6. Brazil Substation Revenue (US$ Mn) and Forecast ByEnd-Use, 2017-2028
14.1.2. Mexico
14.1.2.1. Mexico Substation Revenue (US$ Mn) and Forecast ByTechnology, 2017-2028
14.1.2.2. Mexico Substation Revenue (US$ Mn) and Forecast ByComponent, 2017-2028
14.1.2.3. Mexico Substation Revenue (US$ Mn) and Forecast ByConnectivity, 2017-2028
14.1.2.4. Mexico Substation Revenue (US$ Mn) and Forecast ByApplication, 2017-2028
14.1.2.5. MexicoSubstation Revenue (US$ Mn) and Forecast ByVoltage Type, 2017-2028
14.1.2.6. Mexico Substation Revenue (US$ Mn) and Forecast ByEnd-Use, 2017-2028
14.1.3. Rest of Latin America
14.1.3.1. Rest of Latin America Substation Revenue (US$ Mn) and Forecast ByTechnology, 2017-2028
14.1.3.2. Rest of Latin America Substation Revenue (US$ Mn) and Forecast ByComponent, 2017-2028
14.1.3.3. Rest of Latin America Substation Revenue (US$ Mn) and Forecast ByConnectivity, 2017-2028
14.1.3.4. Rest of Latin America Substation Revenue (US$ Mn) and Forecast ByApplication, 2017-2028
14.1.3.5. Rest of Latin AmericaSubstation Revenue (US$ Mn) and Forecast ByVoltage Type, 2017-2028
14.1.3.6. Rest of Latin America Substation Revenue (US$ Mn) and Forecast ByEnd-Use, 2017-2028
14.2. Latin America PEST Analysis
CHAPTER 15. Middle East & Africa Substation Market By Country
15.1. Middle East & Africa Substation Overview
15.1.1. GCC
15.1.1.1. GCC Substation Revenue (US$ Mn) and Forecast ByTechnology, 2017-2028
15.1.1.2. GCC Substation Revenue (US$ Mn) and Forecast ByComponent, 2017-2028
15.1.1.3. GCC Substation Revenue (US$ Mn) and Forecast ByConnectivity, 2017-2028
15.1.1.4. GCC Substation Revenue (US$ Mn) and Forecast ByApplication, 2017-2028
15.1.1.5. GCCSubstation Revenue (US$ Mn) and Forecast ByVoltage Type, 2017-2028
15.1.1.6. GCC Substation Revenue (US$ Mn) and Forecast ByEnd-Use, 2017-2028
15.1.2. South Africa
15.1.2.1. South Africa Substation Revenue (US$ Mn) and Forecast ByTechnology, 2017-2028
15.1.2.2. South Africa Substation Revenue (US$ Mn) and Forecast ByComponent, 2017-2028
15.1.2.3. South Africa Substation Revenue (US$ Mn) and Forecast ByConnectivity, 2017-2028
15.1.2.4. South Africa Substation Revenue (US$ Mn) and Forecast ByApplication, 2017-2028
15.1.2.5. South AfricaSubstation Revenue (US$ Mn) and Forecast ByVoltage Type, 2017-2028
15.1.2.6. South Africa Substation Revenue (US$ Mn) and Forecast ByEnd-Use, 2017-2028
15.1.3. Rest of Middle East & Africa
15.1.3.1. Rest of Middle East & Africa Substation Revenue (US$ Mn) and Forecast ByTechnology, 2017-2028
15.1.3.2. Rest of Middle East & Africa Substation Revenue (US$ Mn) and Forecast ByComponent, 2017-2028
15.1.3.3. Rest of Middle East & Africa Substation Revenue (US$ Mn) and Forecast ByConnectivity, 2017-2028
15.1.3.4. Rest of Middle East & Africa Substation Revenue (US$ Mn) and Forecast ByApplication, 2017-2028
15.1.3.5. Rest of Middle East & AfricaSubstation Revenue (US$ Mn) and Forecast ByVoltage Type, 2017-2028
15.1.3.6. Rest of Middle East & Africa Substation Revenue (US$ Mn) and Forecast ByEnd-Use, 2017-2028
15.2. Middle East & Africa PEST Analysis
CHAPTER 16. Player Analysis Of Substation
16.1. Substation Company Share Analysis
16.2. Competition Matrix
16.2.1. Competitive Benchmarking of key players by price, presence, market share, and R&D investment
16.2.2. New Product Launches and Product Enhancements
16.2.3. Mergers And Acquisition InGlobal Substation market
16.2.4. Partnership, Joint Ventures and Strategic Alliances/ Sales Agreements
CHAPTER 17. COMPANY PROFILE
17.1. Efacec
17.1.1. Company Snapshot
17.1.2. Business Overview
17.1.3. Financial Overview
17.1.3.1. Revenue (US$ Mn), 2020
17.1.3.2. Efacec 2020 Substation Business Regional Distribution
17.1.4. Product/ Service and Specification
17.1.5. Recent Developments & Business Strategy
17.1.6. Manufacturing Plant Footprint Analysis
17.2. Siemens
17.3. NetControl Group
17.4. Locamation
17.5. Texas Instruments
17.6. Eaton
17.7. Schneider Electric
17.8. Rockwell Automation
17.9. Tesco Automation
17.10. Belden
17.11. Alphapower Electrical Technology PLC
17.12. NR Electric
17.13. General Electric