Specialty Pulp and Paper Chemicals Market Size - Global Industry, Share, Analysis, Trends and Forecast 2024 - 2032
Published :
Report ID:
Pages :
Format :
Specialty Pulp and Paper Chemicals Market Size - Global Industry, Share, Analysis, Trends and Forecast 2024 - 2032
Report Coverage
- Industry Dynamics
- Market Size and Forecast Data
- Segment Analysis
- Competitive Landscape
- Regional Analysis with a Niche Focus on Country-Level Data
- High Level Analysis - Porter's, PESTEL, Value Chain, etc.
- Company Profiles of Key Players
- Option to Customize the Report As Per Your Specific Need
Request Sample Report
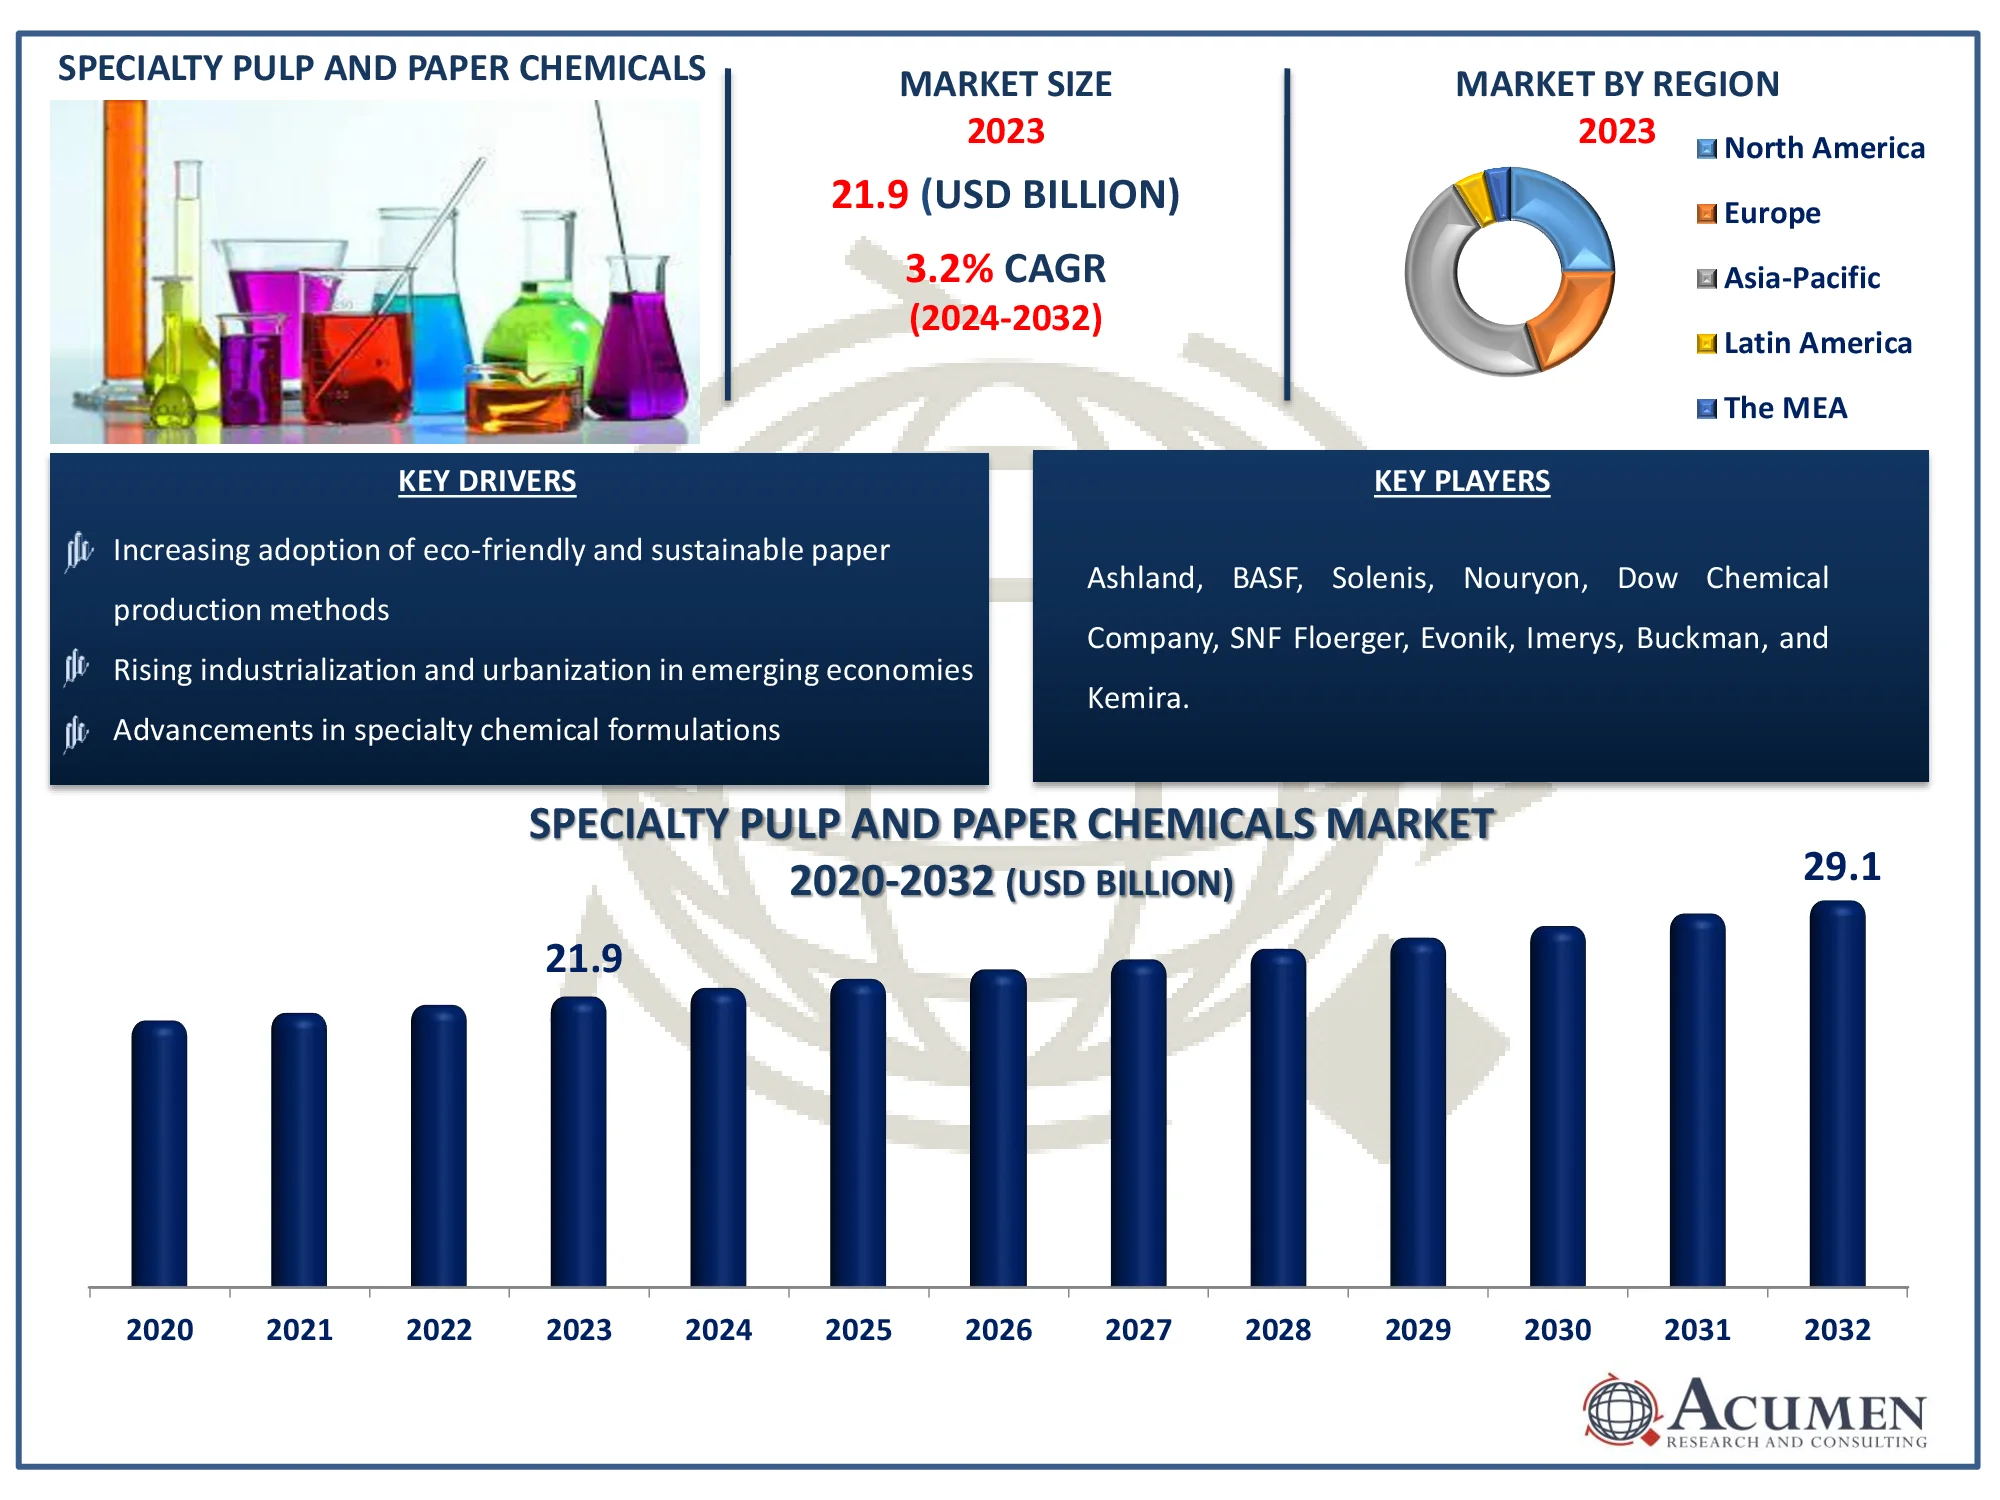
The Global Specialty Pulp and Paper Chemicals Market Size accounted for USD 21.9 Billion in 2023 and is estimated to achieve a market size of USD 29.1 Billion by 2032 growing at a CAGR of 3.2% from 2024 to 2032.
Specialty Pulp and Paper Chemicals Market Highlights
- Global specialty pulp and paper chemicals market revenue is poised to garner USD 29.1 billion by 2032 with a CAGR of 3.2% from 2024 to 2032
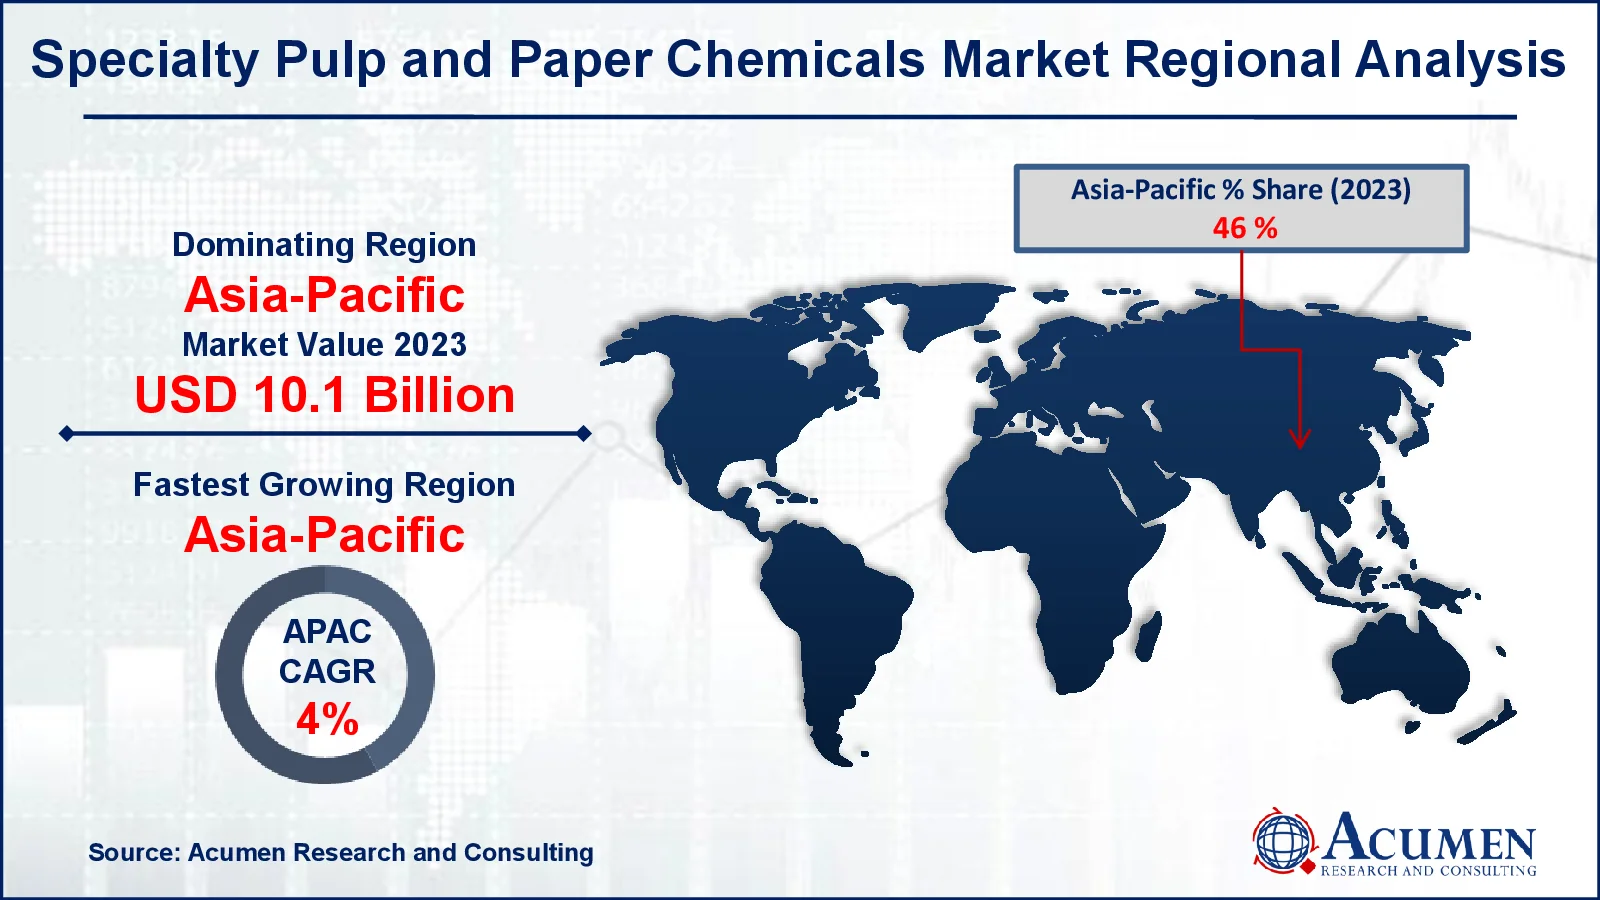
- Asia-Pacific specialty pulp and paper chemicals market value occupied around USD 10.1 billion in 2023
- Asia-Pacific specialty pulp and paper chemicals market growth will record a CAGR of more than 4% from 2024 to 2032
- Among product, the functional chemicals sub-segment generated USD 7.9 billion revenue in 2023
- Based on application, the packaging sub-segment generated 39% specialty pulp and paper chemicals market share in 2023
- Technological innovations in chemical applications is a popular specialty pulp and paper chemicals market trend that fuels the industry demand

Specialty pulp and paper chemicals are a class of chemical products specifically designed to optimize the manufacturing processes and enhance the performance characteristics of pulp and paper. These chemicals are used at various stages of production, including pulping, bleaching, deinking, and paper finishing. They include biocides, defoamers, retention aids, sizing agents, and coatings. These chemicals improve the quality of the final paper product, enhance its durability, and provide specific properties such as water resistance, printability, and brightness. Additionally, specialty chemicals can aid in reducing the environmental impact of paper production by improving process efficiency and reducing waste and energy consumption. They play a crucial role in the paper industry by helping manufacturers meet the evolving demands for high-quality and sustainable paper products.
Global Specialty Pulp and Paper Chemicals Market Dynamics
Market Drivers
- Growing demand for high-quality paper products
- Increasing adoption of eco-friendly and sustainable paper production methods
- Advancements in specialty chemical formulations
- Rising industrialization and urbanization in emerging economies
Market Restraints
- High cost of specialty chemicals
- Stringent environmental regulations
- Fluctuations in raw material prices
Market Opportunities
- Development of bio-based specialty chemicals
- Expansion into emerging markets
- Increasing demand for recycled paper
Specialty Pulp and Paper Chemicals Market Report Coverage
| Market | Specialty Pulp and Paper Chemicals Market |
| Specialty Pulp and Paper Chemicals Market Size 2022 |
USD 21.9 Billion |
| Specialty Pulp and Paper Chemicals Market Forecast 2032 | USD 29.1 Billion |
| Specialty Pulp and Paper Chemicals Market CAGR During 2023 - 2032 | 3.2% |
| Specialty Pulp and Paper Chemicals Market Analysis Period | 2020 - 2032 |
| Specialty Pulp and Paper Chemicals Market Base Year |
2022 |
| Specialty Pulp and Paper Chemicals Market Forecast Data | 2024 - 2032 |
| Segments Covered | By Product, By Application, And By Geography |
| Regional Scope | North America, Europe, Asia Pacific, Latin America, and Middle East & Africa |
| Key Companies Profiled | Ashland, Nouryon, Dow Chemical Company, Solenis, SNF Floerger, Evonik, Imerys, Buckman, BASF, and Kemira. |
| Report Coverage |
Market Trends, Drivers, Restraints, Competitive Analysis, Player Profiling, Covid-19 Analysis, Regulation Analysis |
Specialty Pulp and Paper Chemicals Market Insights
Technological progress and the rising emphasis on sustainable methods to reduce environmental impact are expected to be significant drivers of industry growth over the specialty pulp and paper chemicals market forecast period. The global market is anticipated to record considerable gains in the coming years due to the increasing utilization of specialty chemicals in labeling and packaging applications. Rising food consumption in the APAC region, particularly in India and China, is a major factor driving growth in the flexible packaging industry.
The pulp & paper chemicals market is expected to experience steady growth due to the rising global demand for tissue and packaging grades. The rapid expansion of e-commerce is increasing the use of packaging materials. Additionally, growing concerns about food safety in the food and beverage sector are driving the demand for high-quality food-grade and liquid packaging boards. The need for specialty papers and chemicals is projected to grow significantly due to the increasing demand for disinfectant paper in medical applications. Sterile bags made from these papers provide optimal and clean surfaces for rotogravure and flexographic printing.
Basic chemicals, including caustic soda, sodium carbonate, and mineral acids, are used as catalysts or chelating agents in the specialty industry. Due to their hazardous nature, the demand for basic chemicals is expected to see limited growth over the specialty pulp and paper chemicals industry forecast period. Furthermore, environmental concerns are likely to increase with the growing number of regulatory compliances in various countries, such as the U.S., Germany, France, and the U.K.
Specialty Pulp and Paper Chemicals Market Segmentation
The worldwide market for specialty pulp and paper chemicals is split based on product, application, and geography.
Specialty Pulp and Paper Chemical Market By Products
- Basic Chemicals
- Functional Chemicals
- Bleaching Chemicals
- Process Chemicals
According to specialty pulp and paper chemicals industry analysis, the functional chemicals segment is the leader due to its critical role in enhancing paper quality and performance. Functional chemicals include a range of additives such as retention aids, sizing agents, and coating chemicals. These chemicals are essential for improving various properties of the paper, including strength, brightness, and printability.
Retention aids enhance the retention of fibers and fillers during the papermaking process, leading to better sheet formation and reduced waste. Sizing agents improve the paper's resistance to water and inks, which is crucial for high-quality printability and durability. Coating chemicals provide a smooth surface, enhancing the appearance and surface properties of the final product. As paper manufacturers seek to meet higher quality standards and specific functional requirements, the demand for functional chemicals remains strong. Their ability to significantly impact the final product's performance makes them a key driver in the market.
Specialty Pulp and Paper Chemical Market By Applications
- Packaging
- Labeling
- Printing
- Others
The Specialty Pulp and Paper Chemicals Market encompasses various applications, including packaging, labeling, printing, and others. The packaging segment holds the largest share due to several key factors. Firstly, the rising demand for sustainable and eco-friendly packaging solutions has driven growth in this segment. Specialty chemicals used in packaging enhance the strength, durability, and recyclability of paper-based materials, aligning with global trends towards reducing plastic use and promoting environmental sustainability.
Additionally, the increasing consumption of packaged goods across various sectors, including food and beverages, pharmaceuticals, and consumer products, fuels the demand for high-quality packaging materials. Specialty chemicals improve the performance characteristics of packaging materials, such as moisture resistance, barrier properties, and printability, thereby enhancing their overall functionality. Moreover, regulatory pressures and consumer preferences for safer, more sustainable packaging solutions have led to innovation and development of advanced specialty chemicals tailored for packaging applications. This trend supports the packaging segment's dominance, as manufacturers seek to meet both regulatory standards and consumer expectations through the use of these specialized chemicals.
Specialty Pulp and Paper Chemicals Market Regional Outlook
North America
- U.S.
- Canada
Europe
- U.K.
- Germany
- France
- Spain
- Rest of Europe
Asia-Pacific
- India
- Japan
- China
- Australia
- South Korea
- Rest of Asia-Pacific
Latin America
- Brazil
- Mexico
- Rest of Latin America
The Middle East & Africa
- South Africa
- GCC Countries
- Rest of the Middle East & Africa (ME&A)

Specialty Pulp and Paper Chemicals Market Regional Analysis
In terms of specialty pulp and paper chemicals market analysis, Asia-Pacific is the largest as well as fastest growing region. The demand for specialty pulp and paper for packaging applications has seen significant volume growth in the area. The expansion of the retail infrastructure, supported by the increasing demand for packaged products in Asia-Pacific, has driven the regional market.
In terms of region, North America is anticipated to experience sluggish growth due to stringent regulations related to pulp and paper production enforced by environmental bodies, such as the EPA. However, the industry is expected to be driven by the increased application scope of specialty papers and demand for eco-friendly substances in recycled papers. The region’s largest economy, the U.S., is likely to implement the use of eco-friendly and 100% recyclable products, which will contribute to market growth.
Specialty Pulp and Paper Chemicals Market Players
Some of the top specialty pulp and paper chemicals companies offered in our report include Ashland, Nouryon, Dow Chemical Company, Solenis, SNF Floerger, Evonik, Imerys, Buckman, BASF, and Kemira.
Frequently Asked Questions
How big is the specialty pulp and paper chemicals market?
The specialty pulp and paper chemicals market size was valued at USD 21.9 Billion in 2023.
What is the CAGR of the global specialty pulp and paper chemicals market from 2024 to 2032?
The CAGR of specialty pulp and paper chemicals is 3.2% during the analysis period of 2024 to 2032.
Which are the key players in the specialty pulp and paper chemicals market?
The key players operating in the global market are including Ashland, Nouryon, Dow Chemical Company, Solenis, SNF Floerger, Evonik, Imerys, Buckman, BASF, and Kemira.
Which region dominated the global specialty pulp and paper chemicals market share?
Asia-Pacific held the dominating position in specialty pulp and paper chemicals industry during the analysis period of 2024 to 2032.
Which region registered fastest CAGR from 2024 to 2032?
Asia-Pacific region exhibited fastest growing CAGR for market of specialty pulp and paper chemicals during the analysis period of 2024 to 2032.
What are the current trends and dynamics in the global specialty pulp and paper chemicals industry?
The current trends and dynamics in the specialty pulp and paper chemicals industry include growing demand for high-quality paper products, increasing adoption of eco-friendly and sustainable paper production methods, advancements in specialty chemical formulations, and rising industrialization and urbanization in emerging economies.
Which application held the maximum share in 2023?
The packaging application held the maximum share of the specialty pulp and paper chemicals industry.


