Smart Cities Market Size - Global Industry, Share, Analysis, Trends and Forecast 2023 - 2032
Published :
Report ID:
Pages :
Format :
Smart Cities Market Size - Global Industry, Share, Analysis, Trends and Forecast 2023 - 2032
Report Coverage
- Industry Dynamics
- Market Size and Forecast Data
- Segment Analysis
- Competitive Landscape
- Regional Analysis with a Niche Focus on Country-Level Data
- High Level Analysis - Porter's, PESTEL, Value Chain, etc.
- Company Profiles of Key Players
- Option to Customize the Report As Per Your Specific Need
Request Sample Report
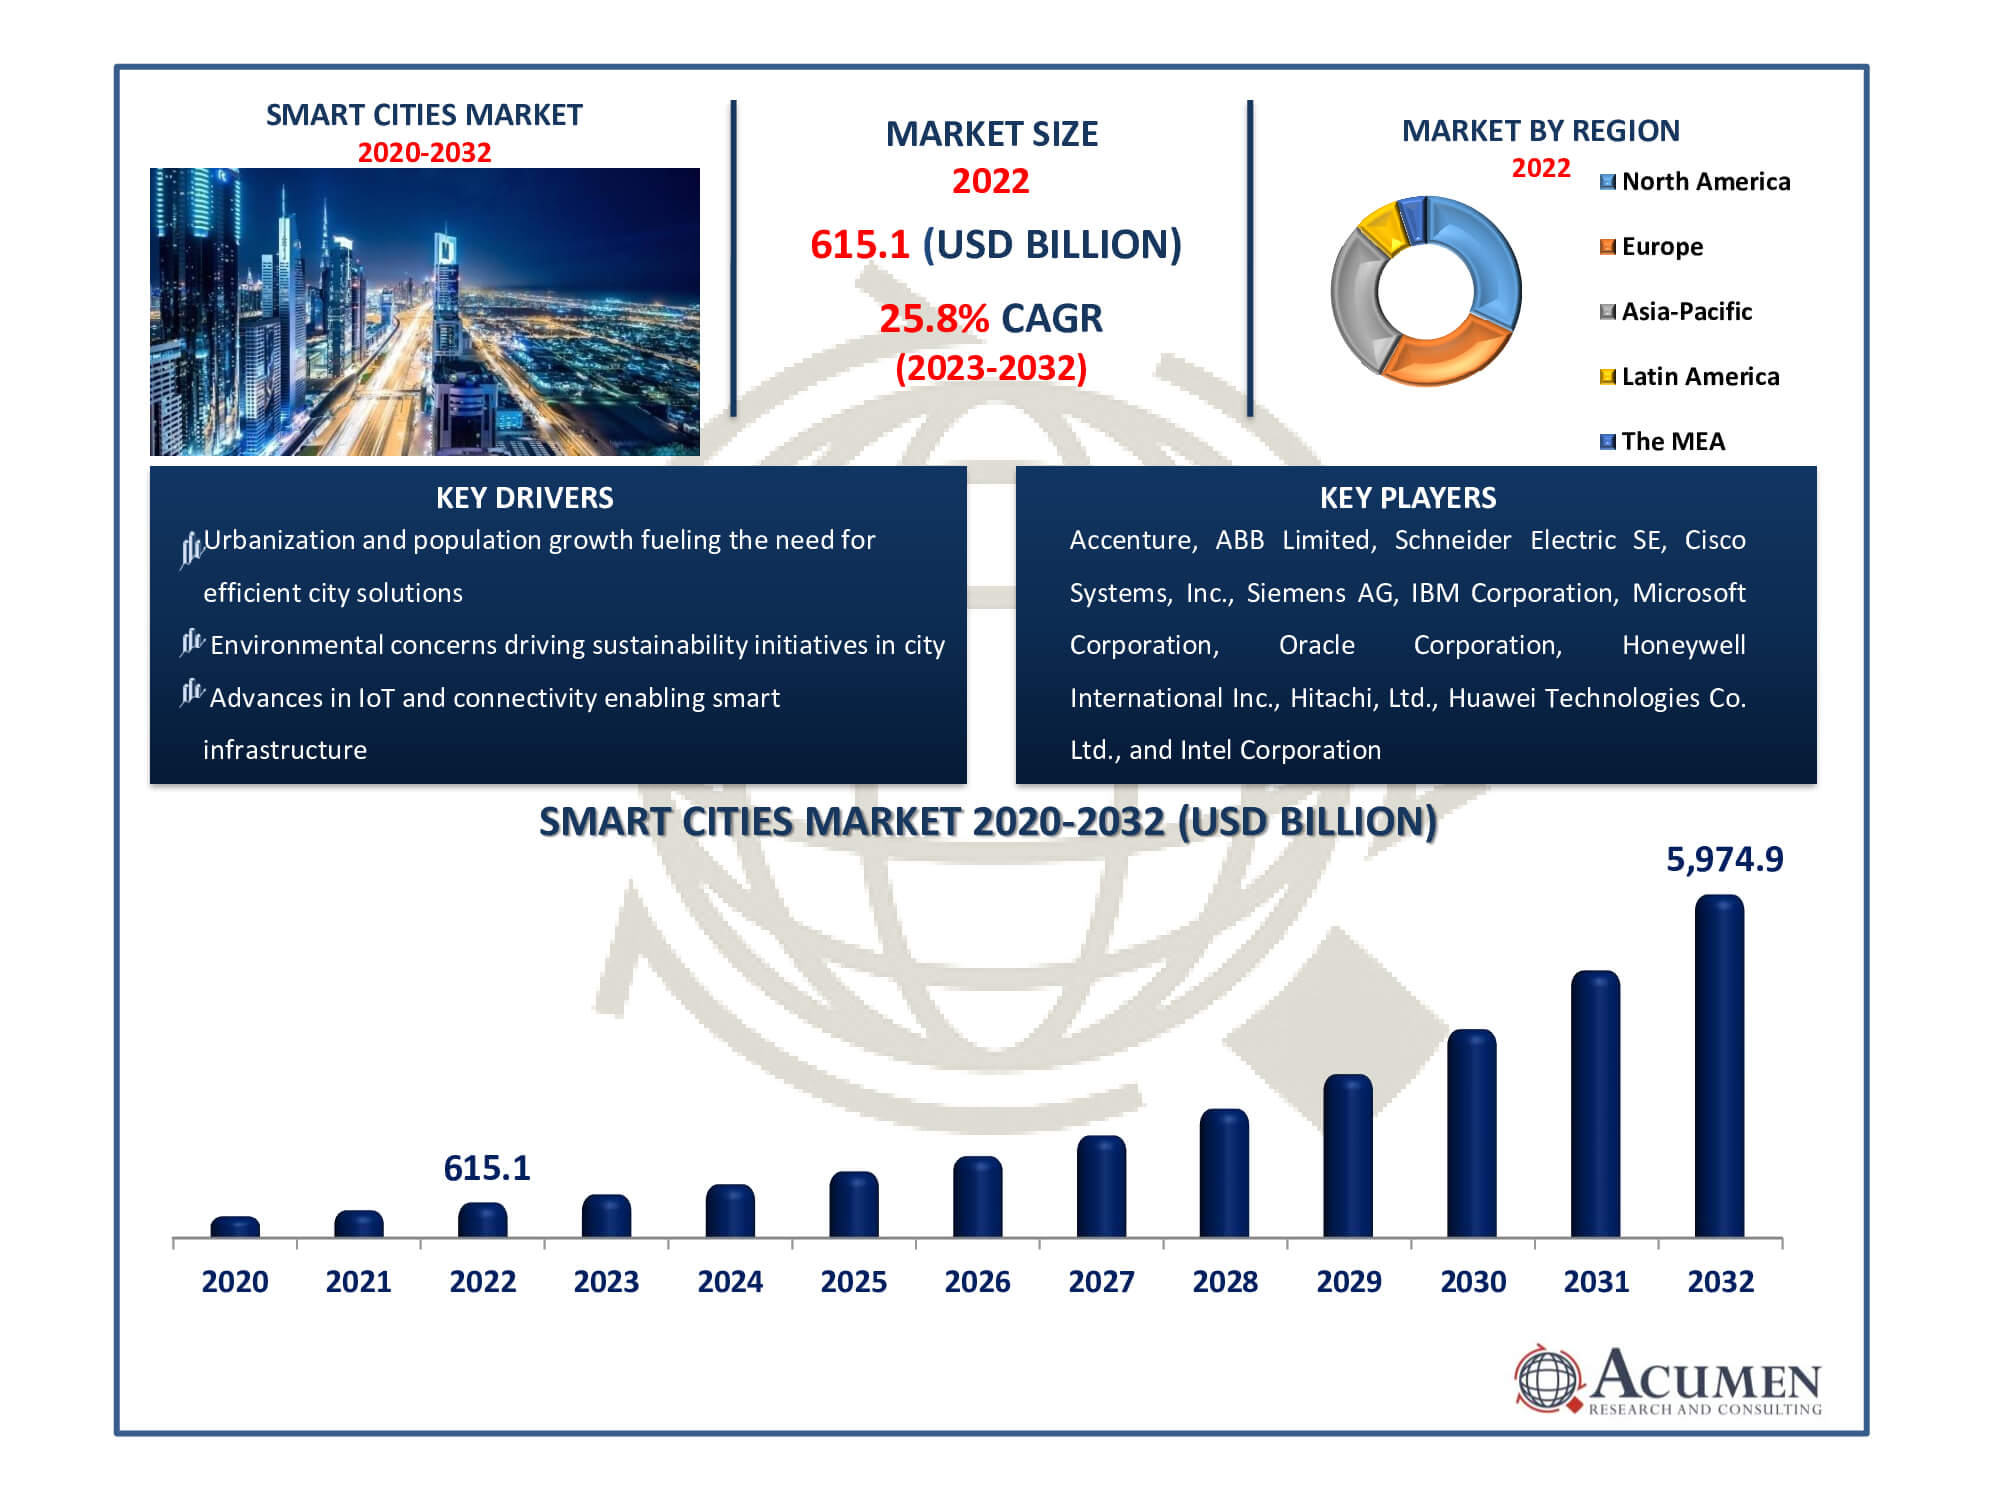
The Smart Cities Market Size accounted for USD 615.1 Billion in 2022 and is estimated to achieve a market size of USD 5,974.9 Billion by 2032 growing at a CAGR of 25.8% from 2023 to 2032.
Smart Cities Market Highlights
- Global smart cities market revenue is poised to garner USD 5,974.9 billion by 2032 with a CAGR of 25.8% from 2023 to 2032
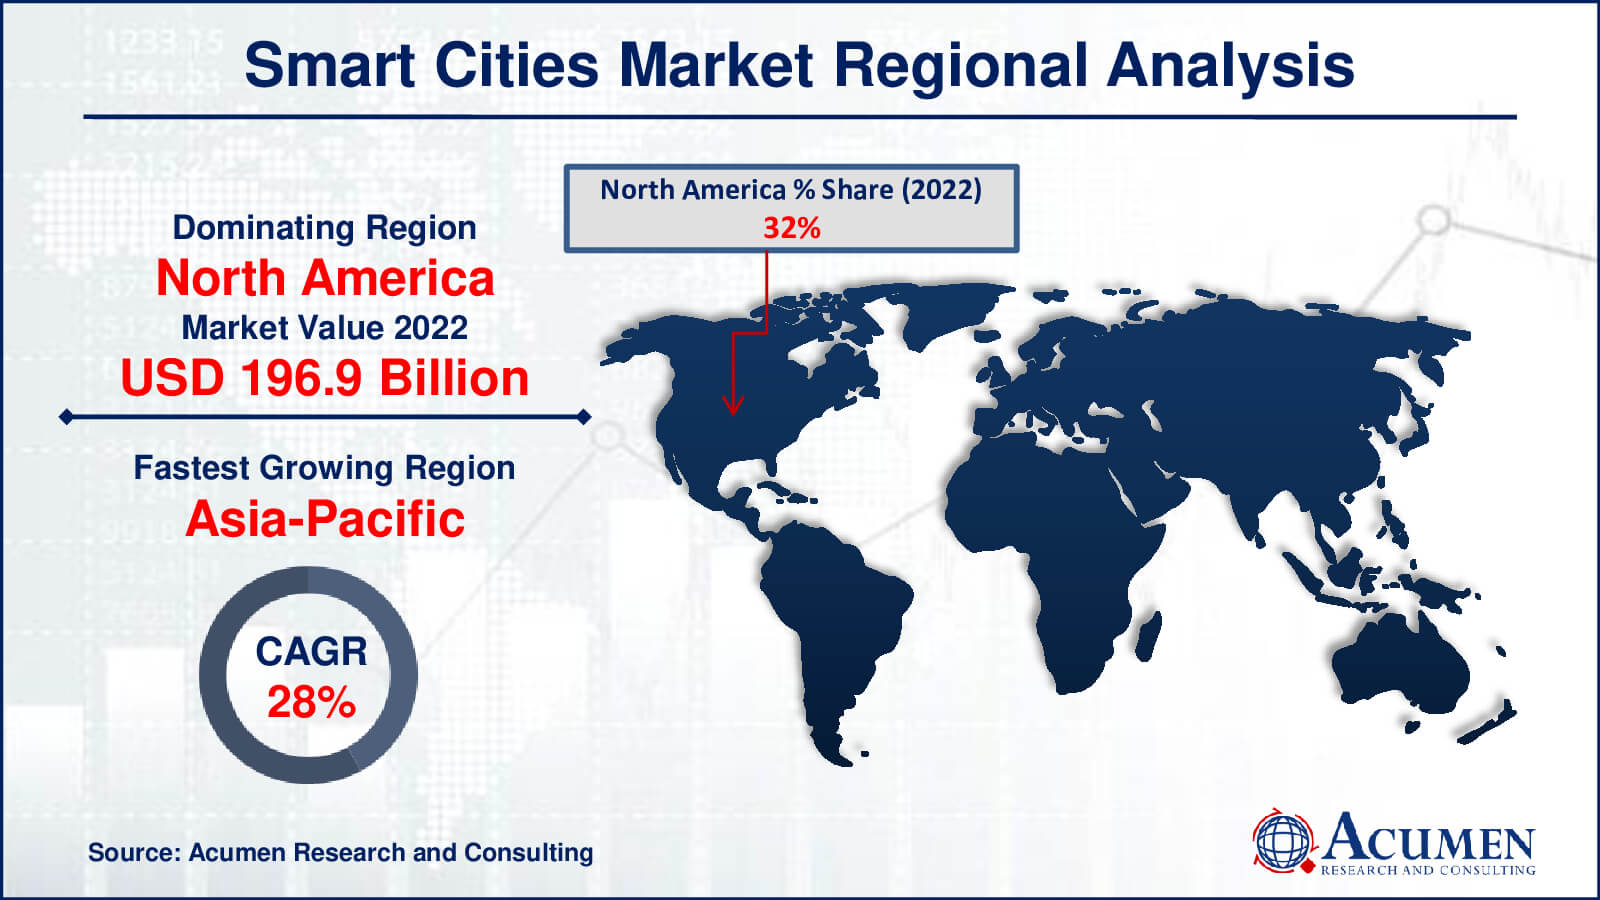
- North America smart cities market value occupied around USD 196.9 billion in 2022
- Asia-Pacific smart cities market growth will record a CAGR of more than 28.0% from 2023 to 2032
- Among application, the smart utilities sub-segment generated over US$ 172.2 billion revenue in 2022
- Based on component, the hardware sub-segment generated around 50% share in 2022
- Investment in autonomous transportation and mobility solutions is a popular smart cities market trend that fuels the industry demand

The term smart cities market describes the application of cutting-edge technology and data-driven solutions to improve metropolitan areas' sustainability, efficiency, and standard of living. In order to enhance municipal infrastructure, services, and governance, smart cities make use of a variety of technologies, including the Internet of Things (IoT), data analytics, artificial intelligence, and communication networks. These technologies are used in a variety of fields, including waste management, public safety, energy management, and transportation. The goal is to build more livable, sustainable cities that are attentive to the demands of their citizens, minimize their negative effects on the environment, and maximize their use of resources.
Governments worldwide are increasingly dedicated to the development of smart cities with the goal of enhancing urban infrastructure to improve the quality of life for residents. In response to the challenges posed by rapid urbanization, governments are actively seeking innovative and contemporary solutions. Smart cities employ information and communication technology to create and support sustainable environments.
Global Smart Cities Market Dynamics
Market Drivers
- Urbanization and population growth fueling the need for efficient city solutions
- Advances in IoT and connectivity enabling smart infrastructure
- Environmental concerns driving sustainability initiatives in cities
- Government initiatives and funding for smart city projects
Market Restraints
- High implementation costs and budget constraints for smart city projects
- Data security and privacy concerns in connected urban environments
- Interoperability challenges among various smart city systems
Market Opportunities
- Growth of the smart grid for efficient energy management
- Expansion of e-governance and citizen engagement platforms
- Development of smart healthcare and education services in cities
Smart Cities Market Report Coverage
| Market | Smart Cities Market |
| Smart Cities Market Size 2022 | USD 615.1 Billion |
| Smart Cities Market Forecast 2032 | USD 5,974.9 Billion |
| Smart Cities Market CAGR During 2023 - 2032 | 25.8% |
| Smart Cities Market Analysis Period | 2020 - 2032 |
| Base Year |
2022 |
| Forecast Data | 2023 - 2032 |
| Segments Covered | By Component, By Application, And By Geography |
| Regional Scope | North America, Europe, Asia Pacific, Latin America, and Middle East & Africa |
| Key Companies Profiled | Accenture, ABB Limited, Schneider C.C.S. SE, Cisco Systems, Inc., Siemens AG, IBM Corporation, Microsoft Corporation, Oracle Corporation, Honeywell International Inc., Hitachi, Ltd., Huawei Technologies Co. Ltd., and Intel Corporation. |
| Report Coverage |
Market Trends, Drivers, Restraints, Competitive Analysis, Player Profiling, Covid-19 Analysis, Regulation Analysis |
Smart Cities Market Insights
The global market for smart cities is experiencing growth driven by several key factors. The widespread availability of high-speed internet, coupled with the adoption of connected devices across various industries, is fueling market expansion. Additionally, significant government investments in various smart city projects are aimed at enhancing the quality of life for citizens, offering improved opportunities, and fostering cities with advanced infrastructure to create clean and sustainable living environments.
Rapid industrialization and urbanization are driving the demand for developed, efficient, and sustainable infrastructure, addressing challenges across various industries such as power, energy, transportation, and more. Various initiatives in areas like mobility, utility management, and safety are among the factors positively impacting market growth.
However, the high initial investment required for the development of smart cities is expected to hinder global market growth. Deploying improved infrastructure and upgrading existing systems to support various facilities involve significant costs, posing challenges for governments in developing countries to allocate such resources. An increase in government investment and collaborative efforts is expected to continue supporting market growth in the forecast period. In the past year, the governments of India and Sweden initiated a collaboration to address the challenges related to smart cities and clean technologies.
Smart Cities Market Segmentation
The worldwide market for smart cities is split based on component, application, and geography.
Smart Cities Component
- Hardware
- Software
- Service
Hardware is the biggest market category for smart cities. According to smart cities industry analysis, there is an increasing need for physical infrastructure and devices, such as cameras, sensors, and networking hardware. These hardware elements enable data integration and collecting, and they serve as the cornerstone of smart city projects. The necessity for modern infrastructure and urbanisation have led to significant hardware investment. Hardware's long-term durability and dependability also contribute to its leading position in the industry by making it a crucial component for creating and maintaining smart cities.
Smart Cities Application
- Smart Governance
- City Surveillance
- C.C.S.
- E-governance
- Smart Lighting
- Smart Infrastructure
- Smart Building
- Environmental Solution
- Smart Utilities
- Energy Management
- Water Management
- Waste Management
- Smart Transportation
- Intelligent Transportation System
- Parking Management
- Ticketing & Travel Assistance
- Smart Healthcare
As per the smart cities market forecast, the smart utilities sector is expected to hold the highest market share since it is essential in tackling urgent urbanisation issues. A review of the market analysis that effective utility management is required due to the growing population and restricted resources. Sustainable urban growth requires the implementation of smart utilities, which include waste, energy, and water management systems. Due to urbanisation and the emphasis on resource conservation, market forecast indicate that this segment will continue to rise.
The second-largest category is smart governance, where market research indicates that modern cities need to involve their citizens and make decisions based on data. The goal of smart cities is to improve administrative efficiency and transparency; thus, digital tools and data analytics are anticipated to be crucial to government. According to market forecast, the smart governance industry will grow as long as cities keep spending money on technology that support responsible and responsive city management, meeting the changing needs of their urban residents.
Smart Cities Market Regional Outlook
North America
- U.S.
- Canada
Europe
- U.K.
- Germany
- France
- Spain
- Rest of Europe
Asia-Pacific
- India
- Japan
- China
- Australia
- South Korea
- Rest of Asia-Pacific
Latin America
- Brazil
- Mexico
- Rest of Latin America
The Middle East & Africa
- South Africa
- GCC Countries
- Rest of the Middle East & Africa (ME&A)

Smart Cities Market Regional Analysis
In the smart cities market, North America that is, the United States and Canada remains the largest region. Numerous factors contribute to this supremacy. First off, the adoption of smart city technologies is made easier by North America's developed and well-established IT infrastructure. Significant public and private sector investments in smart city efforts have also benefited the region, leading to several urban development projects and a high degree of technological adoption. Furthermore, North America is home to a thriving ecosystem of entrepreneurs and IT firms committed to developing cutting-edge solutions for smart cities.
The Asia-Pacific smart cities market is expected to expand at the quickest rate from 2023 to 2032. There are multiple important reasons for this. The demand for advanced urban solutions is being driven by the region's growing urbanization, population expansion, and emerging economies, particularly China and India. Asia-Pacific governments are making significant investments in smart city initiatives to address problems with environmental sustainability, traffic inefficiency, and infrastructure efficiency. In addition, the widespread availability of high-speed internet, the rising popularity of smartphones, and the uptake of connected devices are fostering the perfect atmosphere for the success of smart city initiatives. Asia Pacific is expected to keep its impressive growth in the smart cities sector in the upcoming years, thanks to the region's increasing emphasis on sustainable living and swift technological progress.
Smart Cities Market Players
Some of the top smart cities companies offered in our report includes Accenture, ABB Limited, Schneider Electric SE, Cisco Systems, Inc., Siemens AG, IBM Corporation, Microsoft Corporation, Oracle Corporation, Honeywell International Inc., Hitachi, Ltd., Huawei Technologies Co. Ltd., and Intel Corporation.
Frequently Asked Questions
How big is the smart cities market?
The smart cities market was USD 615.1 billion in 2022.
What is the CAGR of the global smart cities market from 2023 to 2032?
What is the CAGR of the global smart cities market from 2023 to 2032?
Which are the key players in the smart cities market?
The key players operating in the global market are including Accenture, ABB Limited, Schneider Electric SE, Cisco Systems, Inc., Siemens AG, IBM Corporation, Microsoft Corporation, Oracle Corporation, Honeywell International Inc., Hitachi, Ltd., Huawei Technologies Co. Ltd., and Intel Corporation.
Which region dominated the global smart cities market share?
North America held the dominating position in smart cities industry during the analysis period of 2023 to 2032.
Which region registered fastest CAGR from 2023 to 2032?
Asia-Pacific region exhibited fastest growing CAGR for market of smart cities during the analysis period of 2023 to 2032.
What are the current trends and dynamics in the global smart cities industry?
The current trends and dynamics in the smart cities industry include urbanization and population growth fueling the need for efficient city solutions, advances in IoT and connectivity enabling smart infrastructure, environmental concerns driving sustainability initiatives in cities, and government initiatives and funding for smart city projects.
Which component held the maximum share in 2022?
The hardware component held the maximum share of the smart cities industry.?


