Smart and Mobile Supply Chain Solutions Market Size - Global Industry, Share, Analysis, Trends and Forecast 2024 - 2032
Published :
Report ID:
Pages :
Format :
Smart and Mobile Supply Chain Solutions Market Size - Global Industry, Share, Analysis, Trends and Forecast 2024 - 2032
Report Coverage
- Industry Dynamics
- Market Size and Forecast Data
- Segment Analysis
- Competitive Landscape
- Regional Analysis with a Niche Focus on Country-Level Data
- High Level Analysis - Porter's, PESTEL, Value Chain, etc.
- Company Profiles of Key Players
- Option to Customize the Report As Per Your Specific Need
Request Sample Report
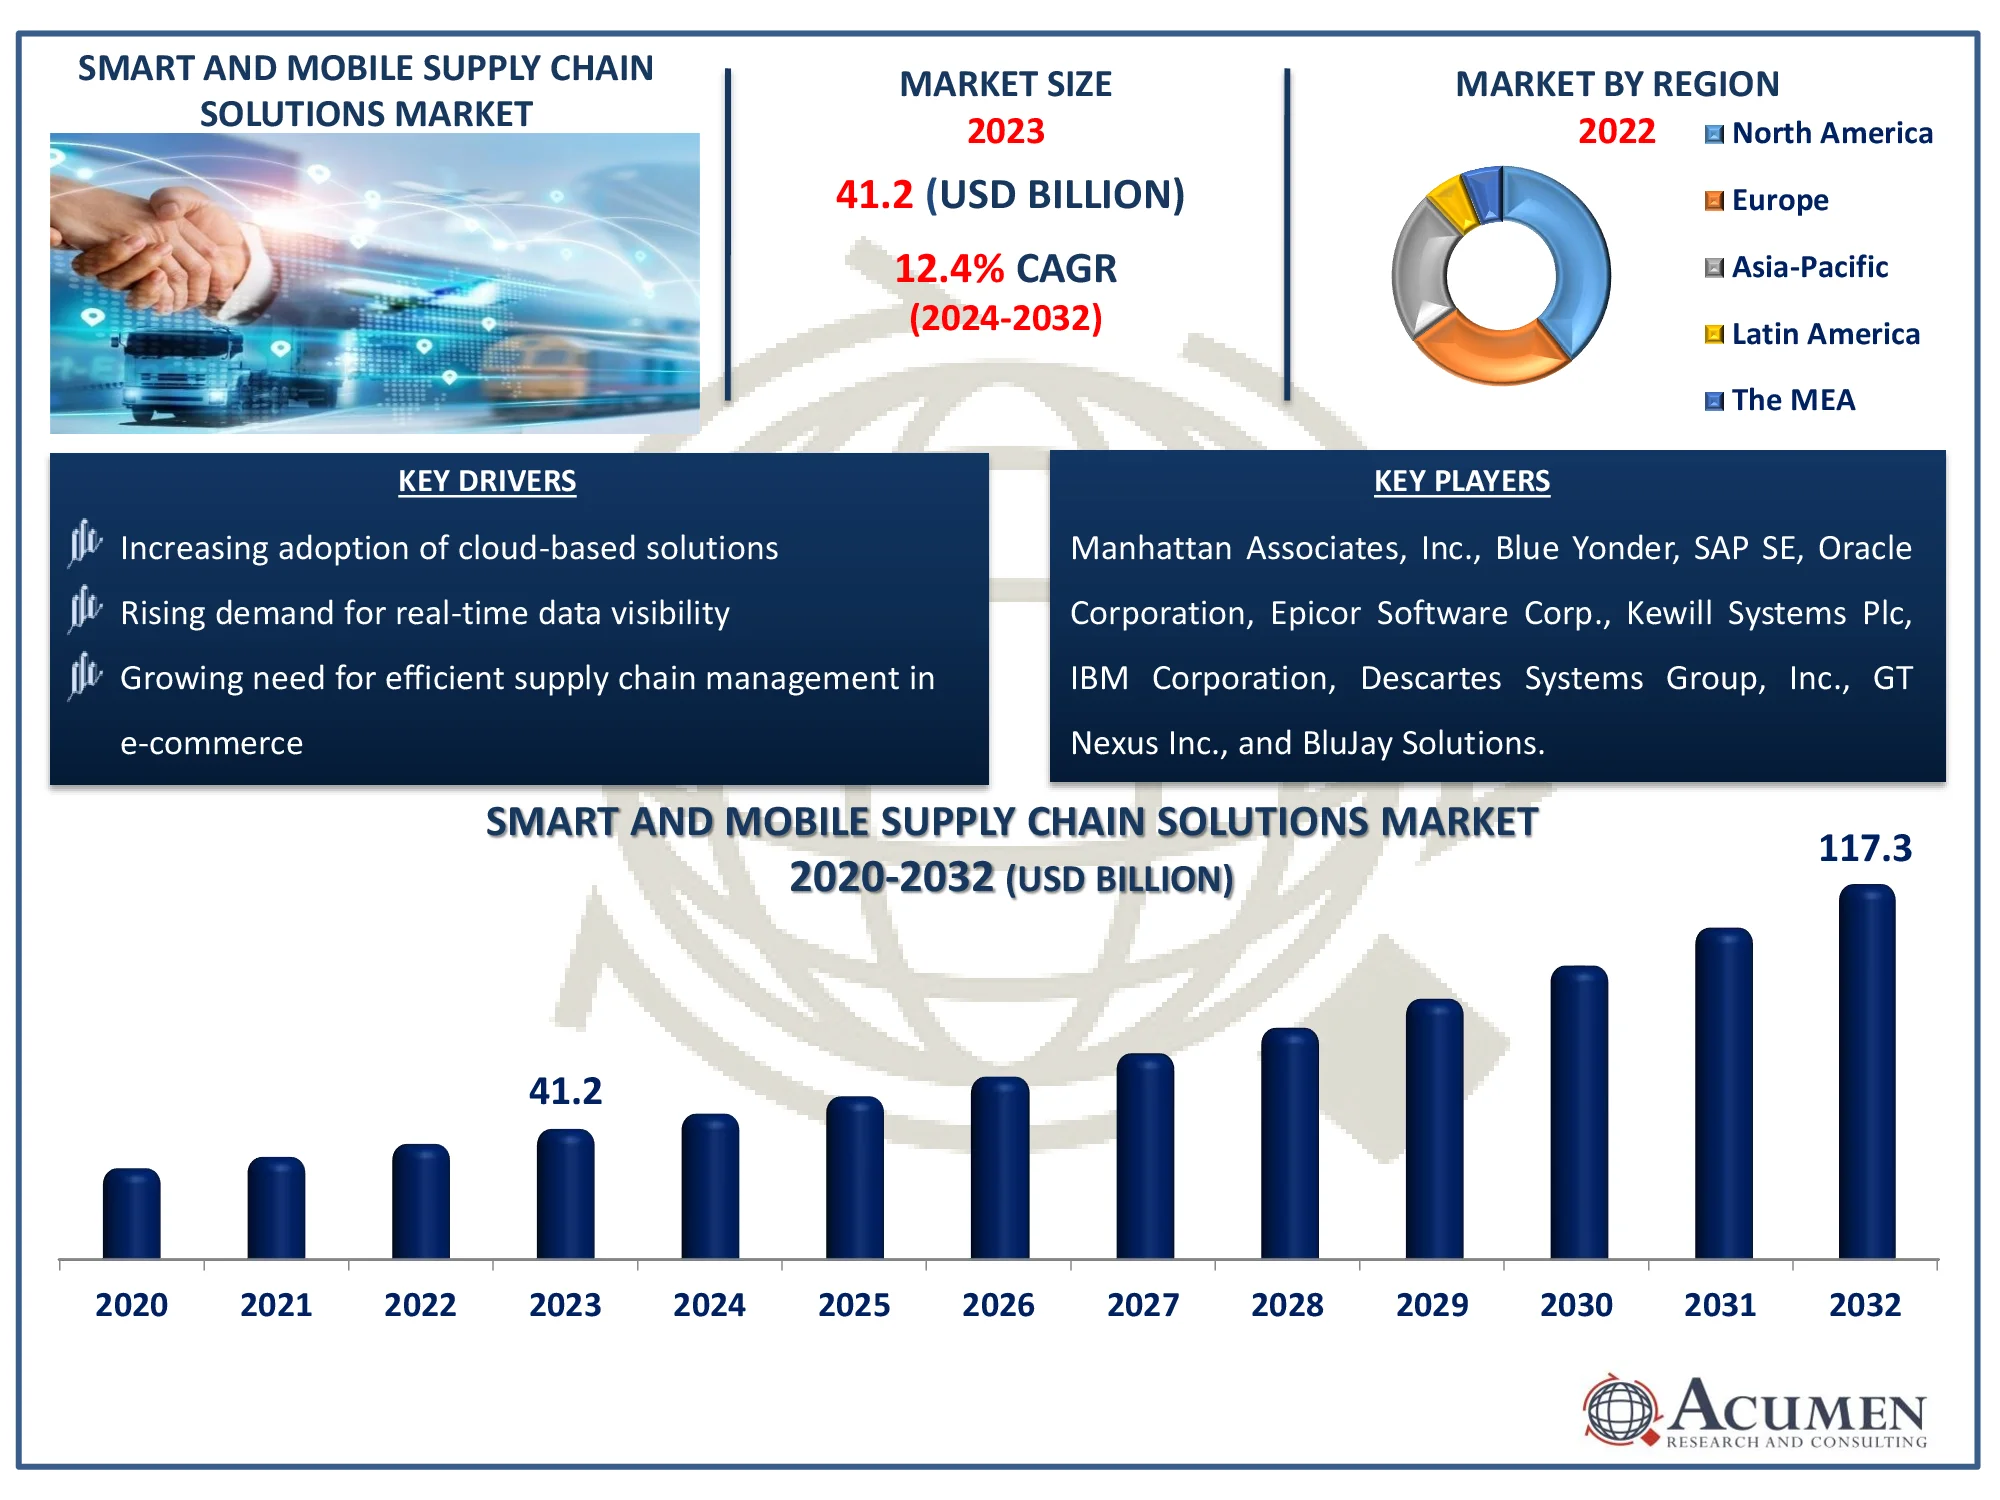
The Global Smart and Mobile Supply Chain Solutions Market Size accounted for USD 41.2 Billion in 2023 and is estimated to achieve a market size of USD 117.3 Billion by 2032 growing at a CAGR of 12.4% from 2024 to 2032.
Smart and Mobile Supply Chain Solutions Market (By Solution: Transportation Management Systems (TMS), Manufacturing Execution Systems (MES), Supply Chain Planning (SCP), Warehouse Management Systems (WMS), and Sourcing and Procurement; By Enterprise Size: Large Enterprises, Small & Medium Enterprises; By End-Use Industry: Retail & Consumer Goods, IT & Telecom, Commercial, Manufacturing, Energy & Utilities, Healthcare, BFSI, Government, Transportation & Logistics, others and By Region: North America, Europe, Asia-Pacific, Latin America, and MEA)
Smart and Mobile Supply Chain Solutions Market Highlights
- The global smart and mobile supply chain solutions market is forecasted to reach USD 117.3 billion by 2032, growing at a CAGR of 12.4% from 2024 to 2032
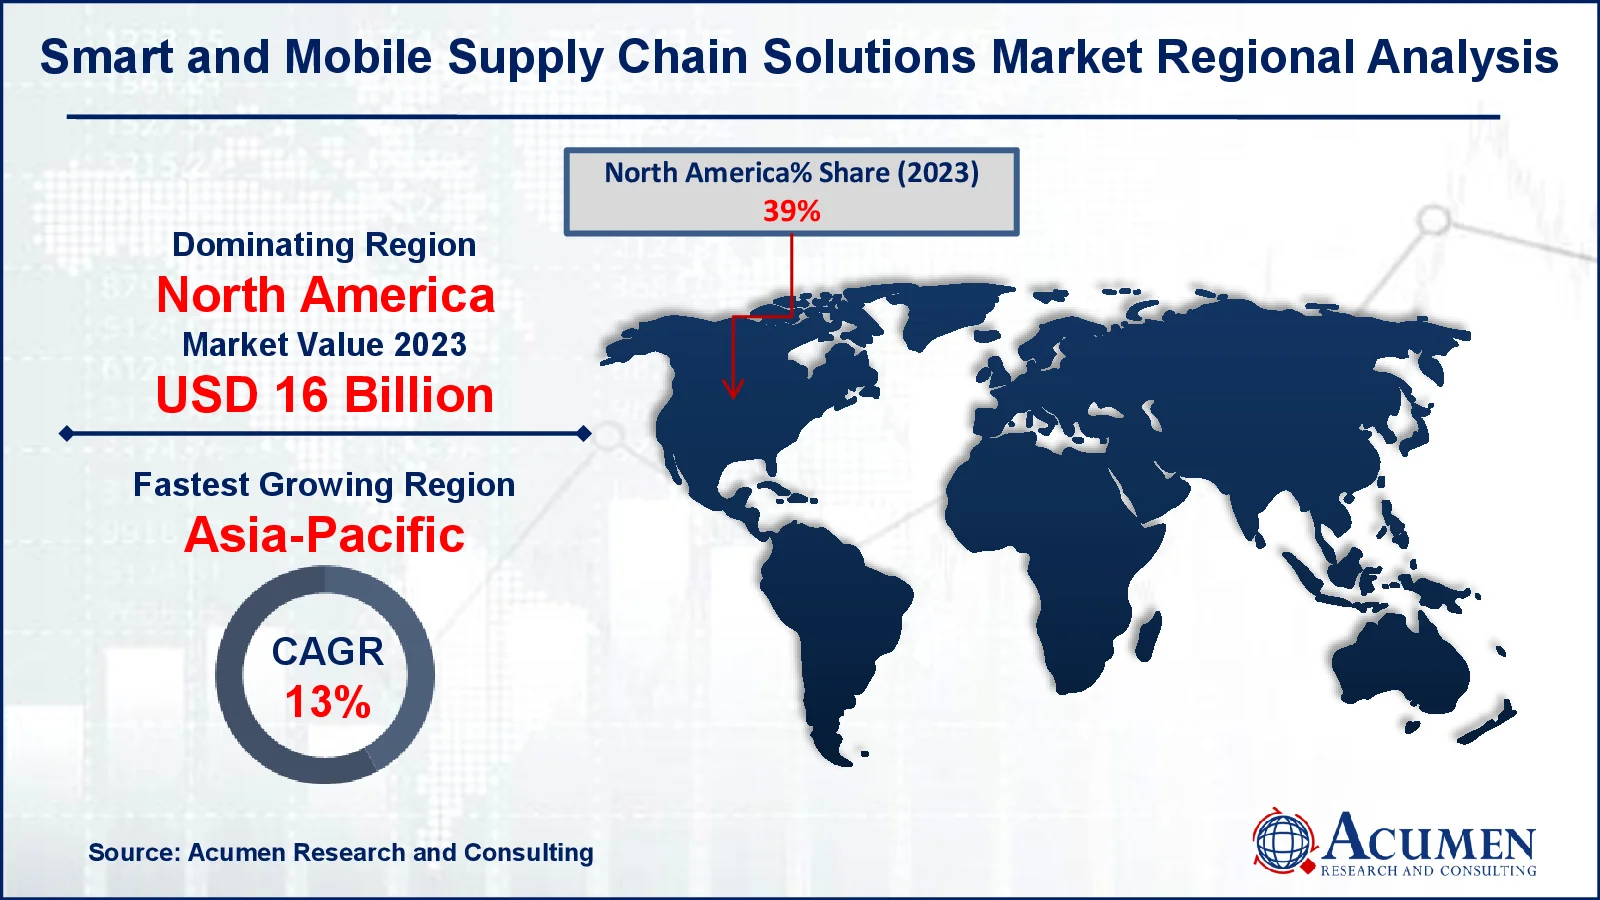
- In 2023, the North American market for smart and mobile supply chain solutions was valued at approximately USD 16 billion
- The Asia-Pacific region is projected to expand at a CAGR of over 13% during the period from 2024 to 2032
- Warehouse management systems (WMS) solutions accounted for a significant share of the market in 2023
- Rising use of IoT and mobile technologies to streamline inventory and logistics processes is the smart and mobile supply chain solutions market trend

Integrated software applications are smart and mobile supply chain solutions that offer full company insight, inventory optimization, and supply synchronization with demand and manufacturing. Smart and mobile chain supply systems integrate tasks such as sourcing, procurement, production, storage, transportation, and selling while managing all information, materials, and financial flows. The solutions strive to gain a competitive advantage by improving experience and reducing costs. Smart and mobile supply chain solutions are significant because they improve service, save costs, and increase income. In a pragmatic sense, variations in production settings, such as increased production costs, shorter product life cycles, and fewer manufacturing resources, prompted the development of smart and mobile supply chain solutions.
Global Smart and Mobile Supply Chain Solutions Market Dynamics
Market Drivers
- Increasing adoption of cloud-based solutions
- Rising demand for real-time data visibility
- Growing need for efficient supply chain management in e-commerce
Market Restraints
- High implementation costs
- Data security concerns
- Complexity in integrating legacy systems with modern solutions
Market Opportunities
- Expansion of IoT and AI technologies
- Growing adoption of mobile supply chain apps
- Increasing demand for supply chain analytics across industries
Smart and Mobile Supply Chain Solutions Market Report Coverage
| Market | Smart and Mobile Supply Chain Solutions Market |
| Smart and Mobile Supply Chain Solutions Market Size 2022 |
USD 41.2 Billion |
| Smart and Mobile Supply Chain Solutions Market Forecast 2032 | USD 117.3 Billion |
| Smart and Mobile Supply Chain Solutions Market CAGR During 2023 - 2032 | 12.4% |
| Smart and Mobile Supply Chain Solutions Market Analysis Period | 2020 - 2032 |
| Smart and Mobile Supply Chain Solutions Market Base Year |
2023 |
| Smart and Mobile Supply Chain Solutions Market Forecast Data | 2024 - 2032 |
| Segments Covered | By Solution, By Enterprise Size, By Industry, And By Geography |
| Regional Scope | North America, Europe, Asia Pacific, Latin America, and Middle East & Africa |
| Key Companies Profiled | Manhattan Associates, Inc., Blue Yonder, SAP SE, Oracle Corporation, Epicor Software Corp., Kewill Systems Plc, IBM Corporation, Descartes Systems Group, Inc., GT Nexus Inc., and BluJay Solutions. |
| Report Coverage |
Market Trends, Drivers, Restraints, Competitive Analysis, Player Profiling, Covid-19 Analysis, Regulation Analysis |
Smart and Mobile Supply Chain Solutions Market Insights
The rise in demand for industrial automation is a primary driver of the smart & mobile supply chain solution market. For instance, in May 2022, Emerson Electric Company announced the release of TopWorX DX Partial Stoke Test. This automation solution promotes safety by including an emergency valve. Furthermore, the rapid growth of e-commerce activity throughout the projection period should provide considerable potential for the market. For instance, according to Invest India, by 2025, around 87% of Indian households will have access to the internet, with a 21% increase in mobile internet usage from 2019. India has the world's second-largest internet userbase (881 million) and is projected to become the third-largest online retail market by 2030. Furthermore, the smart and mobile supply chain solutions industry drives growing demand for storage, as does the desire to reduce order backlog and miss shipping. However, a lack of scalability and infrastructure is a big barrier that may stymie the business.
The scope of intelligent supply chain solutions is broad among third-party logistics (3PL) service providers. Government officials also support 3PL industries, which promote smart and mobile supply chain management solutions to develop automation and innovative technologies.
The increased demand for supply chain analytics in various industries is driving the development of smart and mobile supply chain solutions. For instance, in APQC's 2024 Supply Chain Priorities and Challenges research, 65 percent of firms identified big data and advanced analytics as the top trend likely to have a significant influence on supply chains in the next three years. Analytics provides firms with real-time insights, predictive capabilities, and optimization tools that help them increase operational efficiency, cut costs, and make better decisions. As businesses strive to remain competitive and quick in a dynamic market environment, including advanced analytics into mobile supply chain platforms becomes critical. This shift opens up considerable opportunity for solution vendors to deliver more sophisticated and data-driven supply chain management technologies.
Smart and Mobile Supply Chain Solutions Market Segmentation
The worldwide market for smart and mobile supply chain solutions is split based on solution, enterprise size, end-use industry, and geography.
Smart and Mobile Supply Chain Solutions
- Transportation Management Systems (TMS)
- Manufacturing Execution Systems (MES)
- Supply Chain Planning (SCP)
- Warehouse Management Systems (WMS)
- Sourcing and Procurement
According to the smart and mobile supply chain solutions industry analysis, the warehouse management systems (WMS) segment typically popular because WMS solutions offer critical capabilities for optimizing inventory, managing warehouse operations, and enhancing order fulfillment processes, all of which are central to supply chain efficiency. The growing demand for real-time visibility, automation, and accurate inventory tracking further amplifies the importance of WMS, especially in the e-commerce and retail sectors.
Smart and Mobile Supply Chain Solutions Enterprise Size
- Large Enterprises
- Small & Medium Enterprises
Large enterprises anticipated to to dominate in smart and mobile supply chain solutions market. This is because they have more financial resources to invest in modern technology and can take advantage of the scalability these solutions offer. Large firms also have more complex supply chains that necessitate sophisticated technologies for real-time tracking, optimization, and data analysis. Furthermore, larger firms frequently find it easier to integrate mobile and smart solutions because they have established infrastructure and technological competence.
Smart and Mobile Supply Chain Solutions End-Use Industry
- Retail & Consumer Goods
- IT & Telecom
- Commercial
- Manufacturing
- Energy & Utilities
- Healthcare
- BFSI
- Government
- Transportation & Logistics
- Others
According to the smart and mobile supply chain solutions market forecast, the transportation and logistics sector dominates market. This is driven by the sector's growing requirement for real-time tracking, efficient route management, and increased operational efficiency to fulfill rising demand for rapid and dependable delivery. Increased e-commerce activity and globalization of supply chains have hastened the adoption of these solutions.
Smart and Mobile Supply Chain Solutions Market Regional Outlook
North America
- U.S.
- Canada
Europe
- U.K.
- Germany
- France
- Spain
- Rest of Europe
Asia-Pacific
- India
- Japan
- China
- Australia
- South Korea
- Rest of Asia-Pacific
Latin America
- Brazil
- Mexico
- Rest of Latin America
The Middle East & Africa
- South Africa
- GCC Countries
- Rest of the Middle East & Africa (ME&A)

Smart and Mobile Supply Chain Solutions Market Regional Analysis
For several reasons, North America made the most significant contribution to the supply chain's smart and mobile markets. This increase is largely due to the growing adoption of smart and mobile solutions by small and medium-sized businesses and major corporations to efficiently manage products and services flow.
Market expansion in APAC will propel the global market. During the projection period, China, Japan, and India are likely to play a prominent role in the worldwide market, with regional revenues. Companies in Asia Pacific are currently implementing smart and mobile supply chain management solutions. The region is slowing the use of gadgets such as GPS and RFID. The market for intelligent supply chain solutions drives up efficiency and customer satisfaction. RFID, for example, is used to eliminate surplus inventory in the supply chain while also increasing product visibility.
Europe is a major global market for intelligent and mobile supply chain management solutions, owing to increased awareness of the benefits of such solutions. The smart and mobile supply chain management systems market in Europe is being propelled by advanced technology combined with significant cost savings. The SOP category is predicted to account for the majority of the European market for smart and mobile supply chain solutions, while the MES segments are expected to rise at a rapid pace throughout the projection period. The SOP category is likely to be a significant component of the smart and mobile supply chain management systems market.
Smart and Mobile Supply Chain Solutions Market Players
Some of the top smart and mobile supply chain solutions companies offered in our report include Manhattan Associates, Inc., Blue Yonder, SAP SE, Oracle Corporation, Epicor Software Corp., Kewill Systems Plc, IBM Corporation, Descartes Systems Group, Inc., GT Nexus Inc., and BluJay Solutions.
Frequently Asked Questions
How big is the smart and mobile supply chain solutions market?
The smart and mobile supply chain solutions market size was valued at USD 41.2 billion in 2023.
What is the CAGR of the global smart and mobile supply chain solutions market from 2024 to 2032?
The CAGR of smart and mobile supply chain solutions is 12.4% during the analysis period of 2024 to 2032.
Which are the key players in the smart and mobile supply chain solutions market?
The key players operating in the global market are including Manhattan Associates, Inc., Blue Yonder, SAP SE, Oracle Corporation, Epicor Software Corp., Kewill Systems Plc, IBM Corporation, Descartes Systems Group, Inc., GT Nexus Inc., and BluJay Solutions.
Which region dominated the global smart and mobile supply chain solutions market share?
North America held the dominating position in smart and mobile supply chain solutions industry during the analysis period of 2024 to 2032.
Which region registered fastest CAGR from 2024 to 2032?
Asia-Pacific region exhibited fastest growing CAGR for market of smart and mobile supply chain solutions during the analysis period of 2024 to 2032.
What are the current trends and dynamics in the global smart and mobile supply chain solutions industry?
The current trends and dynamics in the smart and mobile supply chain solutions industry include increasing adoption of cloud-based solutions, rising demand for real-time data visibility, and growing need for efficient supply chain management in e-commerce.
Which solution held the maximum share in 2023?
The warehouse management systems (WMS) held the maximum share of the smart and mobile supply chain solutions industry.?


