Recycled Glass Market Size - Global Industry, Share, Analysis, Trends and Forecast 2024 - 2032
Published :
Report ID:
Pages :
Format :
Recycled Glass Market Size - Global Industry, Share, Analysis, Trends and Forecast 2024 - 2032
Report Coverage
- Industry Dynamics
- Market Size and Forecast Data
- Segment Analysis
- Competitive Landscape
- Regional Analysis with a Niche Focus on Country-Level Data
- High Level Analysis - Porter's, PESTEL, Value Chain, etc.
- Company Profiles of Key Players
- Option to Customize the Report As Per Your Specific Need
Request Sample Report
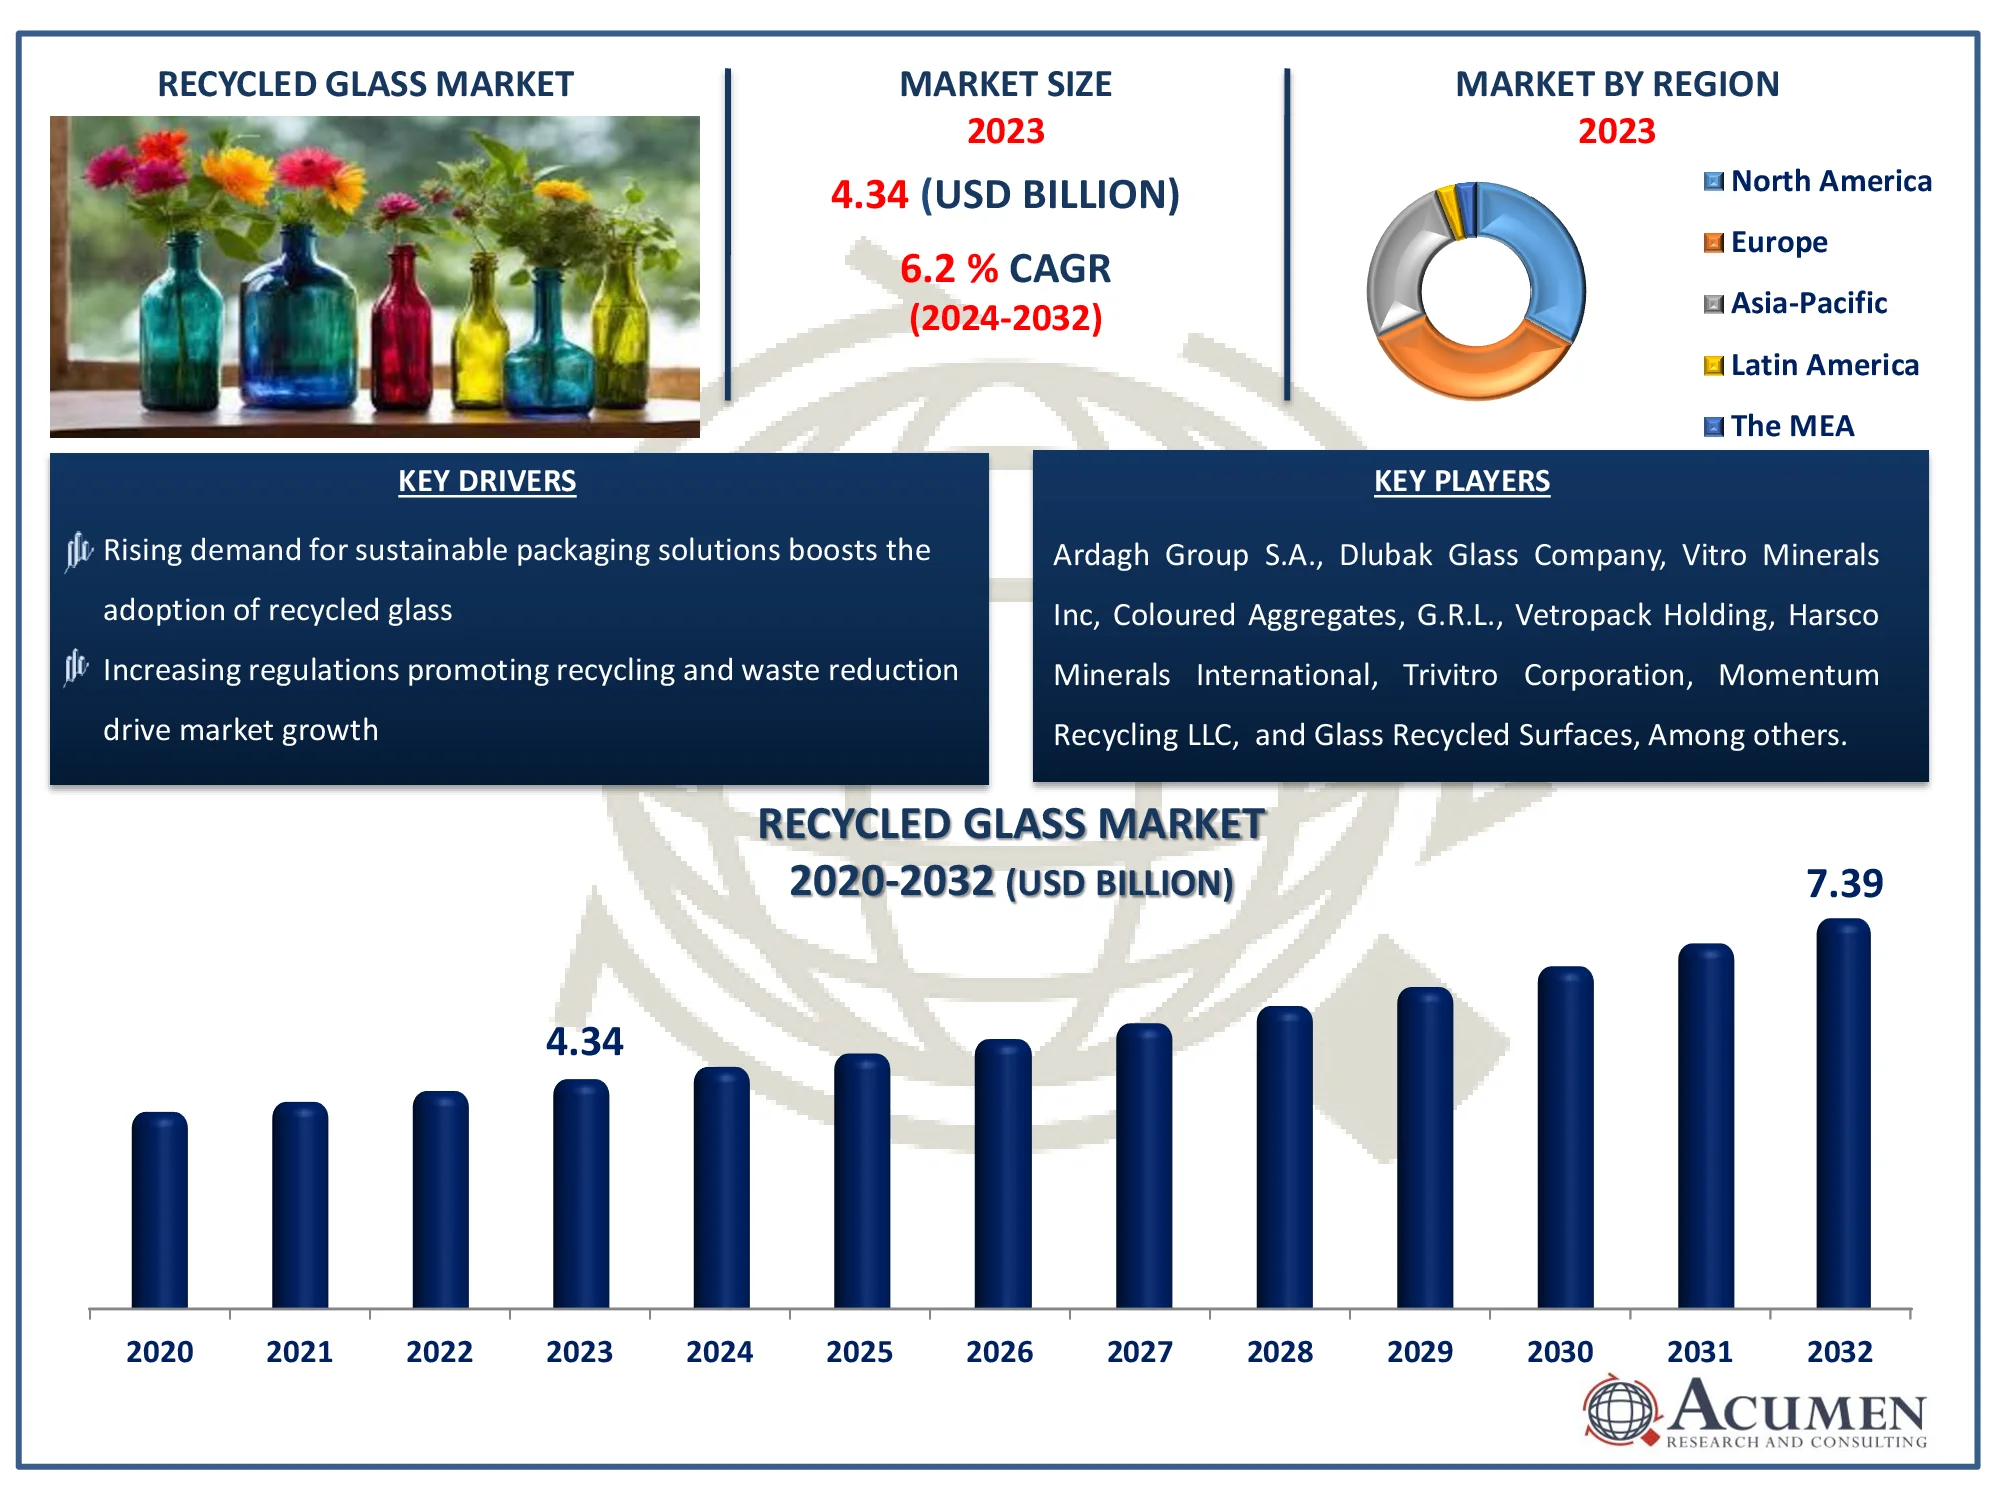
The Global Recycled Glass Market Size accounted for USD 4.34 Billion in 2023 and is estimated to achieve a market size of USD 7.39 Billion by 2032 growing at a CAGR of 6.2% from 2024 to 2032.
Recycled Glass Market Highlights
- Global recycled glass market revenue is poised to garner USD 7.39 billion by 2032 with a CAGR of 6.2% from 2024 to 2032
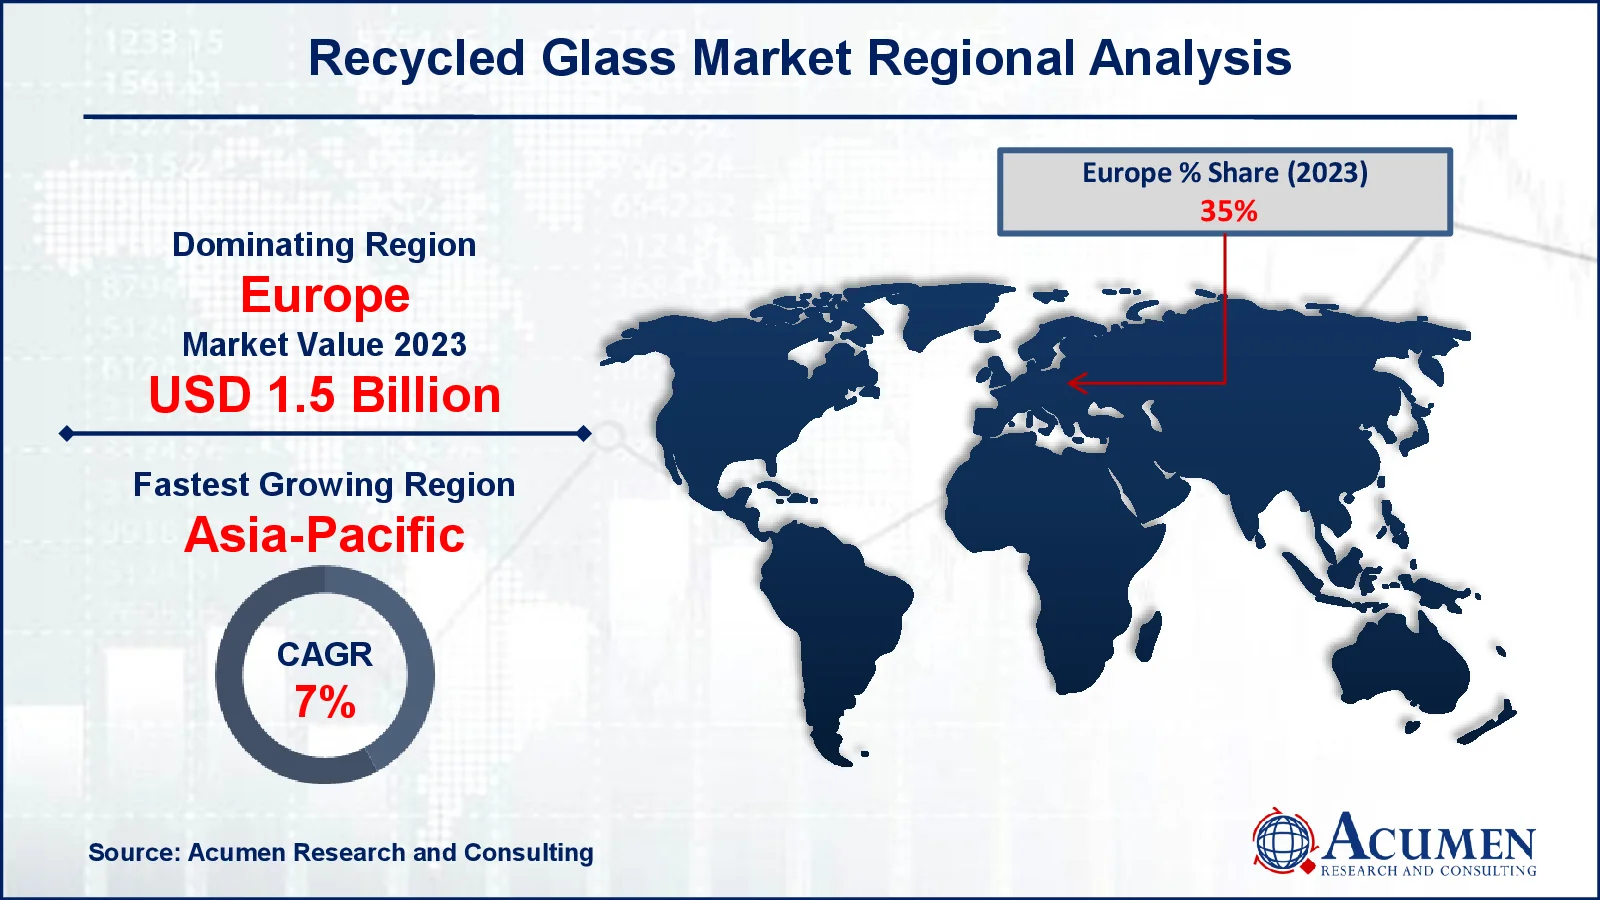
- Europe recycled glass market value occupied around USD 1.5 billion in 2023
- Asia-Pacific recycled glass market growth will record a CAGR of more than 7% from 2024 to 2032
- Among Product, the tidal stream generator sub-segment generated more than USD 2.4 billion revenue in 2023
- Based on application, the glass bottle & containers sub-segment generated around 51% recycled glass market share in 2023
- Government incentives and subsidies for eco-friendly practices is a popular recycled glass market trend that fuels the industry demand

Recycled glass refers to the reusing glass objects, which are preferably used for making virgin glass. The recycling of glass is a cost-effective process of virgin glass production, because it conserves natural resources, saves energy and simple to recycle. Additionally, it is good for the environment because it is 100 percent recyclable, for the same concern it can be recycled repeatedly with the same quality without any loss of purity. It is widely used in the construction industry, as the replacement of sand when finely crushed and as a replacement of gravel when less finely crushed. Apart from these, the recycled glass reduces the use of raw material, thereby reducing CO2 emission.
Global Recycled Glass Market Dynamics
Market Drivers
- Rising demand for sustainable packaging solutions boosts the adoption of recycled glass
- Increasing regulations promoting recycling and waste reduction drive market growth
- Expanding use of recycled glass in construction applications, such as concrete and tiles
- Growing awareness among consumers regarding the environmental benefits of recycled products
Market Restraints
- High costs associated with the collection, sorting, and processing of recycled glass
- Limited infrastructure for efficient recycling in emerging economies
- Contamination issues during recycling processes reduce the quality of the end product
Market Opportunities
- Development of advanced technologies for efficient glass recycling opens new avenues
- Expanding use of recycled glass in renewable energy sectors, such as solar panels
- Rising investments in circular economy initiatives foster growth in the recycled glass sector
Recycled Glass Market Report Coverage
|
Market |
Recycled Glass Market |
|
Recycled Glass Market Size 2023 |
USD 4.34 Billion |
|
Recycled Glass Market Forecast 2032 |
USD 7.39 Billion |
|
Recycled Glass Market CAGR During 2024 - 2032 |
6.2% |
|
Recycled Glass Market Analysis Period |
2020 - 2032 |
|
Recycled Glass Market Base Year |
2023 |
|
Recycled Glass Market Forecast Data |
2024 - 2032 |
|
Segments Covered |
By Product, By Source, By Application, and By Geography |
|
Regional Scope |
North America, Europe, Asia Pacific, Latin America, and Middle East & Africa |
|
Key Companies Profiled |
Ardagh Group S.A., Dlubak Glass Company, Vitro Minerals Inc, Coloured Aggregates, G.R.L., Vetropack Holding, Harsco Minerals International, Trivitro Corporation, Momentum Recycling LLC, Glass Recycled Surfaces, URM/Berryman Glass Recycling, and Gallo Glass Company. |
|
Report Coverage |
Market Trends, Drivers, Restraints, Competitive Analysis, Player Profiling, Covid-19 Analysis, Regulation Analysis |
Recycled Glass Market Insights
The global recycled glass market is experiencing positive growth due to growing awareness about sustainable development across the globe. The supportive government regulations for the recycling of glass products are also supporting the market growth. The rapid industrialization is further boosting the market value. On the other hand, contamination from unwanted materials, which are present in the product waste stream can possibly create complications in the manufacturing process is another factor expected to hamper the market value over the forecast period. However, growing awareness regarding the use of recycled glass in industries like automotive is likely to create potential opportunities over the forecast period.
Along with this, the recycled glass is collected from various sources including deposit, buy back/drop-off and curbside. Deposit is mandatory for beverage container in some countries, which are installed under a program, where people give deposits while purchasing the glass bottle, and take the refund for the same, at the time of returning them at a collection center for refurbishment. Various laws associated with the collection center are also established by some governments for combating their respective sustainability goals. But buy back/drop-off source for the collection of recycled glass is preferred because it provides high-quality cullet. Additionally, it requires a high participation rate and public awareness. Curbside refers to the collection of used glass objects from the side of a pavement bordered by a curb. This method consists of the collection of single-stream waste, which is followed by sorting and segregation of glass waste.
Recycled glass is available in various forms including cullet, crushed glass, and glass powder, and has application according to the available product types. Cullet refers to the furnace-ready recycled glass, which has the property of melting at a low temperature at a faster rate. Crushed glass has usage across construction, asphalt, water filtration, sand/abrasive grit blasting, concrete aggregate, and insulation batts. In addition to these, the glass powder is residue from the sheet glass cutting, which is later used for the surface glass treatment with the help of blasting, reinforcement of synthetic resins, and path lines.
Recycled Glass Market Segmentation
The worldwide market for recycled glass is split based on product, source, application, and geography.
Recycled Glass Market By Product
- Cullet
- Crushed Glass
- Glass Powder
According to recycled glass industry analysis, cullet, which is made out of shattered or waste glass, leads the market due to its vast range of applications and environmental benefits. It is widely utilized in the production of innovative glass products, such as bottles, jars, and fiberglass, because it saves energy and raw materials. Cullet's strong demand originates from its ability to melt at lower temperatures, which improves energy efficiency in glass manufacturing. Furthermore, industries value cullet for its role in reducing carbon emissions and conserving natural resources such as silica and soda ash. The segment's growth is aided by severe environmental regulations and rising consumer demand for sustainable packaging solutions, which are supporting its market dominance.
Recycled Glass Market By Source
- Deposit
- Buy Back/Drop-Off
- Curbside
Curbside recycling is the notable section of the recycled glass market, owing to its convenience and widespread adoption in both urban and suburban locations. This method enables residents to easily dispose of glass garbage, which is then collected by municipal or private recycling programs. The segment's expansion is being supported by government measures that promote curbside recycling in order to improve waste management efficiency and reduce landfill dependency. Furthermore, curbside programs offer a consistent supply of high-quality glass for recycling, so promoting the manufacture of cullet and other recovered products. As consumer awareness of environmental sustainability grows, curbside recycling becomes increasingly popular, strengthening its position as the primary source of recycled glass worldwide.
Recycled Glass Market By Application
- Glass Bottle & Containers
- Flat Glass
- Fiber Glass
- Highway Beads
- Abrasives
- Fillers
- Others
Glass bottles and containers dominate the recycled glass market since they are widely used in industries such as food and beverage, medicines, and cosmetics. Recycled glass is a popular material for making these items since it decreases raw material and energy use, which aligns with environmental aims. The segment's popularity is boosted further by increased customer demand for environmentally friendly packaging and tough rules encouraging glass recycling. Furthermore, due to its excellent recyclability, glass can be used repeatedly without losing quality, making it perfect for bottles and containers. Manufacturers gain from cost savings and reduced environmental effect, cementing this segment's position as the largest and most significant use of recycled glass in the market.
Recycled Glass Market Regional Outlook
North America
- U.S.
- Canada
Europe
- U.K.
- Germany
- France
- Spain
- Rest of Europe
Asia-Pacific
- India
- Japan
- China
- Australia
- South Korea
- Rest of Asia-Pacific
Latin America
- Brazil
- Mexico
- Rest of LATAM
The Middle East & Africa
- South Africa
- GCC Countries
- Rest of the Middle East & Africa (ME&A)

Recycled Glass Market Regional Analysis
Europe has the greatest market for recycled glass due to its strong legal framework that supports sustainable waste management and recycling. The region has a well-developed infrastructure for collecting and processing glass, as well as significant public awareness of recycling procedures. Germany, the United Kingdom, and France are leading the way in employing cutting-edge technology to increase recycling rates. Furthermore, severe EU rules, such as the Packaging and Packaging Waste Directive, stimulate the use of recycled materials, driving up demand in industries such as construction, packaging, and vehicles. The widespread adoption of circular economy concepts elevates Europe's position as a world leader in recycled glass.
Meanwhile, the Asia-Pacific region is the fastest-growing during the recycled glass market due to increased urbanization, industrialization, and rising environmental awareness. Countries such as China, India, and Japan are implementing policies to enhance waste management and encourage recycling. The increased demand for recycled glass in industries such as packaging, building, and consumer goods is another key driver. Furthermore, the growing middle-class population and shifting customer preferences for sustainable products drive market growth. Asia-Pacific's strong economic growth and investments in recycling technologies demonstrate the region's potential to become a major player in the recycled glass market.
Recycled Glass Market Players
Some of the top recycled glass companies offered in our report include Ardagh Group S.A., Dlubak Glass Company, Vitro Minerals Inc, Coloured Aggregates, G.R.L., Vetropack Holding, Harsco Minerals International, Trivitro Corporation, Momentum Recycling LLC, Glass Recycled Surfaces, URM/Berryman Glass Recycling, and Gallo Glass Company.
Frequently Asked Questions
How big is the recycled glass market?
The recycled glass market size was valued at USD 4.34 Billion in 2023.
What is the CAGR of the global recycled glass market from 2024 to 2032?
The CAGR of recycled glass is 6.2% during the analysis period of 2024 to 2032.
Which are the key players in the recycled glass market?
The key players operating in the global market are including Ardagh Group S.A., Dlubak Glass Company, Vitro Minerals Inc, Coloured Aggregates, G.R.L., Vetropack Holding, Harsco Minerals International, Trivitro Corporation, Momentum Recycling LLC, Glass Recycled Surfaces, URM/Berryman Glass Recycling, and Gallo Glass Company.
Which region dominated the global recycled glass market share?
Europe held the dominating position in recycled glass industry during the analysis period of 2024 to 2032.
Which region registered fastest CAGR from 2024 to 2032?
Asia-Pacific region exhibited fastest growing CAGR for market of recycled glass during the analysis period of 2024 to 2032.
What are the current trends and dynamics in the global recycled glass industry?
The current trends and dynamics in the recycled glass industry include rising demand for sustainable packaging solutions boosts the adoption of recycled glass, and increasing regulations promoting recycling and waste reduction drive market growth.
Which product held the maximum share in 2023?
The cullet product held the maximum share of the recycled glass industry.


