Process Spectroscopy Market Size - Global Industry, Share, Analysis, Trends and Forecast 2024 - 2032
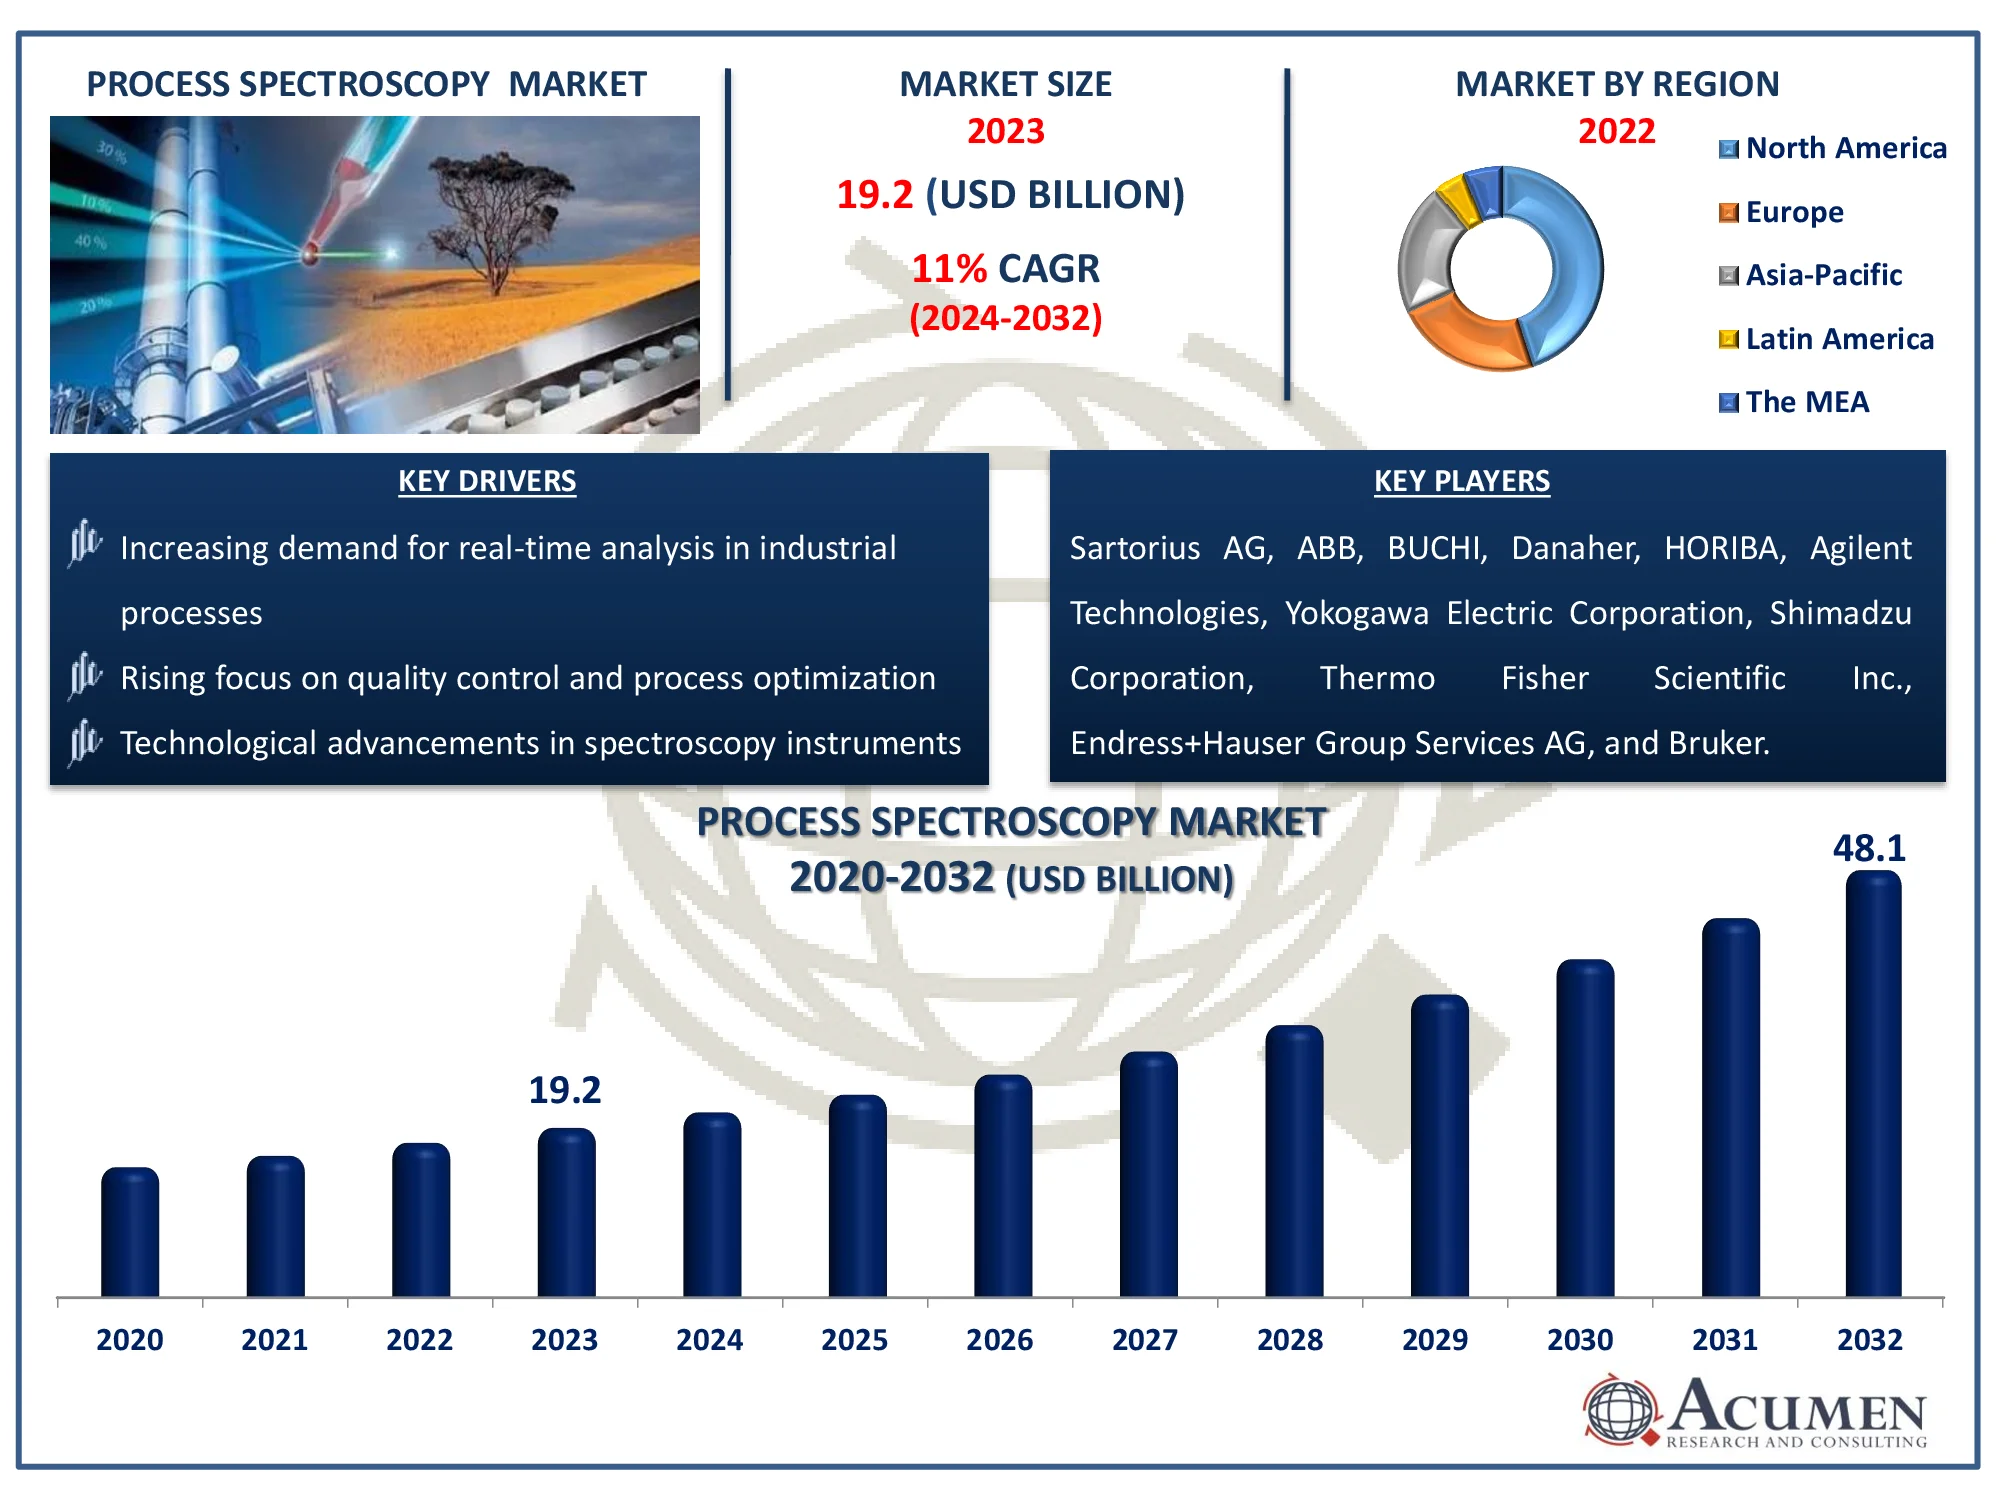
The Global Process Spectroscopy Market Size accounted for USD 19.2 Billion in 2023 and is estimated to achieve a market size of USD 48.1 Billion by 2032 growing at a CAGR of 11% from 2024 to 2032.
Process Spectroscopy Market (By Technology: Molecular Spectroscopy, Mass Spectroscopy, Atomic Spectroscopy; By Component: Hardware, and Software; By Application: Polymer, Oil & Gas, Pharmaceuticals, Food & Agriculture, Chemicals, Water & Wastewater, Pulp & Paper, Metal & Mining, and Others; and By Region: North America, Europe, Asia-Pacific, Latin America and MEA)
Process Spectroscopy Market Highlights
- The global process spectroscopy market is projected to reach USD 48.1 billion by 2032, with a CAGR of 11% from 2024 to 2032
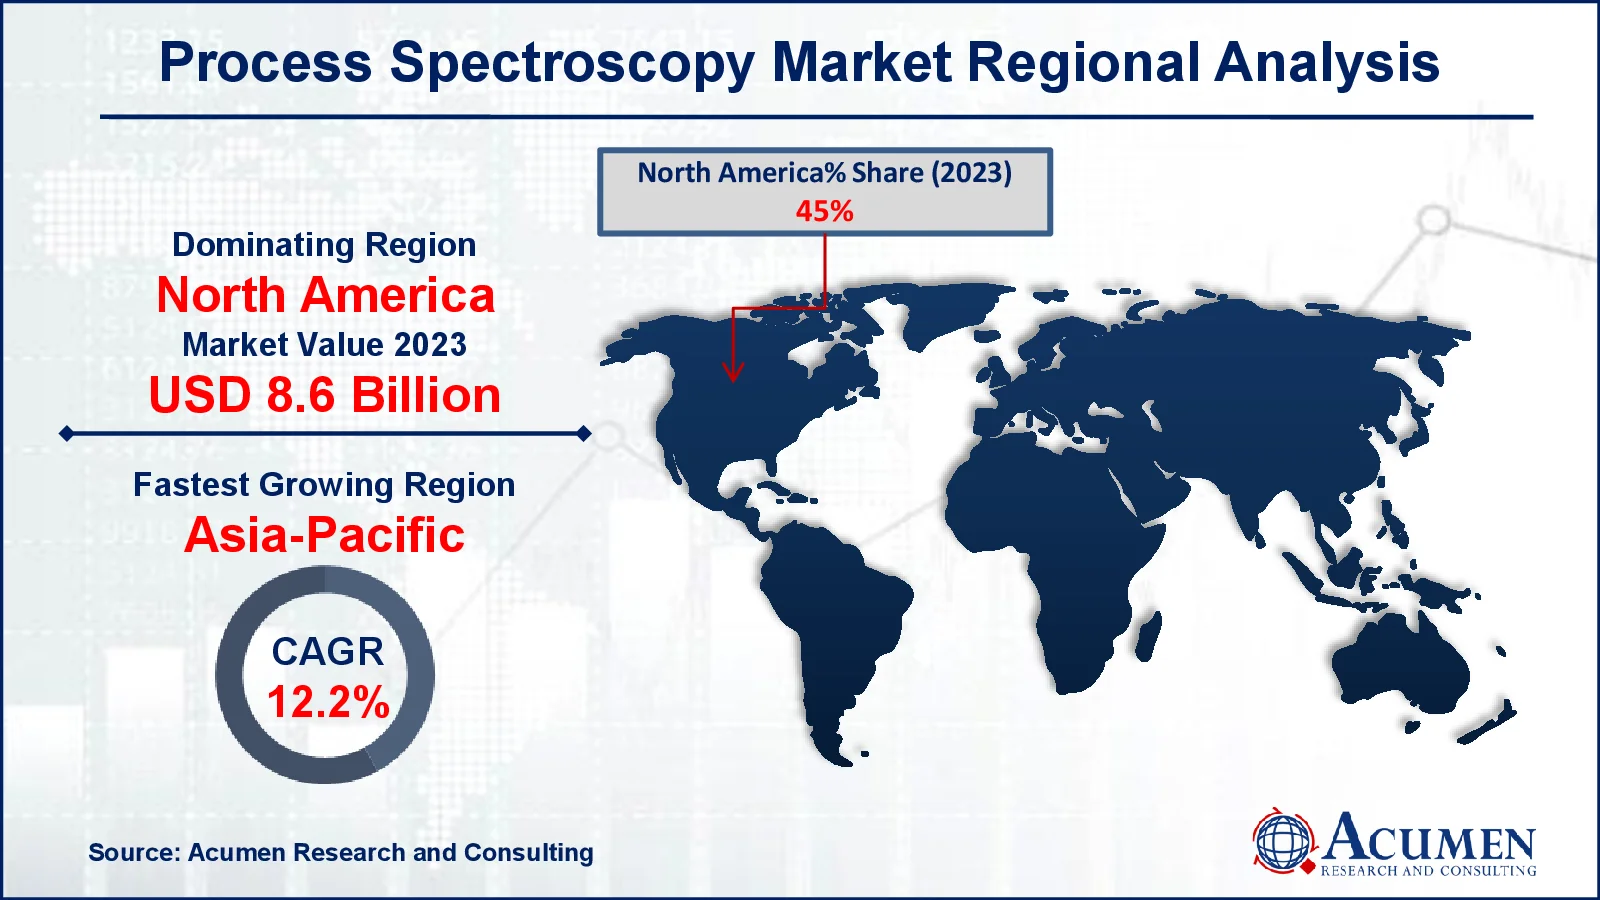
- In 2023, North America's process spectroscopy market was valued at approximately USD 8.6 billion
- The Asia-Pacific process spectroscopy market is expected to grow at a CAGR of over 12.2% from 2024 to 2032
- The molecular spectroscopy sub-segment accounted for 46% of the market share in 2023
- The hardware sub-segment contributed 78% of the market share based on components in 2023
- In 2023, the pharmaceuticals sub-segment held 32% of the market share based on application
- Rising integration of AI and machine learning for enhanced data analysis and predictive maintenance is the process spectroscopy market trend that fuels the industry demand

Process spectroscopy is a method used to monitor and analyze chemical processes by studying how materials interact with light. It helps detect and measure different substances during production without needing to touch or prepare samples. Common techniques include infrared, Raman, and UV-Vis spectroscopy. This technology is widely used in industries like pharmaceuticals, food, and chemicals to ensure products are made correctly and efficiently. It allows real-time monitoring, improving product quality and reducing waste. Process spectroscopy also helps companies meet safety and quality standards. Overall, it makes manufacturing processes faster and more reliable.
Global Process Spectroscopy Market Dynamics
Market Drivers
- Increasing demand for real-time analysis in industrial processes
- Rising focus on quality control and process optimization
- Technological advancements in spectroscopy instruments
Market Restraints
- High initial cost of spectroscopy equipment
- Complexity of data interpretation and analysis
- Limited adoption in small and medium-sized enterprises
Market Opportunities
- Growing adoption of process spectroscopy in emerging economies
- Integration with automation and Industry 4.0 technologies
- Development of portable and miniaturized spectroscopy devices
Process Spectroscopy Market Report Coverage
| Market | Process Spectroscopy Market |
| Process Spectroscopy Market Size 2022 |
USD 19.2 Billion |
| Process Spectroscopy Market Forecast 2032 | USD 48.1 Billion |
| Process Spectroscopy Market CAGR During 2023 - 2032 | 11% |
| Process Spectroscopy Market Analysis Period | 2020 - 2032 |
| Process Spectroscopy Market Base Year |
2022 |
| Process Spectroscopy Market Forecast Data | 2023 - 2032 |
| Segments Covered | By Technology, By Component, By Application, And By Geography |
| Regional Scope | North America, Europe, Asia Pacific, Latin America, and Middle East & Africa |
| Key Companies Profiled | Sartorius AG, ABB, Agilent Technologies, Inc., BUCHI, Danaher, Yokogawa Electric Corporation, HORIBA, Shimadzu Corporation, Thermo Fisher Scientific Inc., Endress+Hauser Group Services AG, and Bruker. |
| Report Coverage |
Market Trends, Drivers, Restraints, Competitive Analysis, Player Profiling, Covid-19 Analysis, Regulation Analysis |
Process Spectroscopy Market Insights
Increasing acceptance of spectroscopic methods in the pharmaceutical and food and agriculture sectors, growing familiarity with high-quality food and drugs, and various tenets and directions imposed by governments and related organizations are among the key trends driving business sector growth. For instance, in October 2023, HORIBA announced the release of the A-TEEM Compliance Package, a software compliance package. The software compliance package is a spectroscopic solution that can detect out-of-spec goods and low-level components in complex combinations. It is intended to assure regulatory compliance within the pharmaceutical business. Developing efforts in the pharmaceutical industry to attempt propelled new work are resulting in the adoption of various spectroscopic tactics in the coming years.
The innovation is expected to grow steadily as entrepreneurs become more aware of the importance of product quality. For instance, June 2021, SCIEX, a leader in life science analytical technology, has released a new precise mass LC-MS/MS equipment called the ZenoTOF 7600 system. By producing previously unattainable data, the new technology allows scientists to better characterize, identify, and measure molecules than ever before. This breakthrough will help to accelerate the development of novel precision diagnostics and biotherapeutics while also addressing genuine analytical issues.
Another factor that is predicted to drive the market over the forecast period is declining operational utilization. Furthermore, significant R&D efforts are underway, which have resulted in a few pharmaceutical disclosures. The increasing number of medication disclosure forms is resulting in a greater number of treatment options for various diseases. Treatment options include drugs as well as non-sedative treatments such as medical procedures and radiation.
The combination of automation and industry 4.0 technologies has enormous promise for the process spectroscopy sector. Automation enables real-time monitoring and control, increasing process efficiency. In smart factories, data from spectroscopic equipment can be used with AI to predict maintenance requirements and ensure product quality.
Process Spectroscopy Market Segmentation
The worldwide market for process spectroscopy is split based on technology, component, application, and geography.
Process Spectroscopy Technologies
- Molecular Spectroscopy
- NIR
- FT-IR
- Raman
- NMR
- Others
- Mass Spectroscopy
- Atomic Spectroscopy
According to the process spectroscopy industry analysis, molecular spectroscopy dominates the market because it aids in the analysis of material’s chemical compositions. In the pharmaceutical and food industries, techniques such as infrared (IR) and Raman spectroscopy are utilized to monitor and manage production. These methods are quick, precise, and being evaluated. They help to ensure that products are consistent and of high quality. As manufacturing advances, molecular spectroscopy becomes increasingly crucial.
Process Spectroscopy Components
- Hardware
- Software
The hardware component is the largest since it contains critical equipment such as spectrometers, sensors, and probes. These gadgets allow sectors such as pharmaceuticals, chemicals, and food to monitor their processes in real time. The demand for precise and dependable hardware has increased as businesses seek to boost productivity and comply with laws. Smaller, portable devices are also gaining popularity. Automation and smart factory trends drive up need for superior hardware in this industry.
Process Spectroscopy Applications
- Polymer
- Oil & Gas
- Pharmaceuticals
- Food & Agriculture
- Chemicals
- Water & Wastewater
- Pulp & Paper
- Metal & Mining
- Others
According to the process spectroscopy market forecast, pharmaceutical companies are the most likely to utilize process spectroscopy since it helps to ensure the quality of medicines. NIR and Raman spectroscopy are used to quickly test medication components without harming them. This helps to meet stringent safety regulations and improves the manufacturing process. Spectroscopy can also help detect contaminants and ensure product consistency. As more advanced treatments are developed, the demand for these instruments increases.
Process Spectroscopy Market Regional Outlook
North America
- U.S.
- Canada
Europe
- U.K.
- Germany
- France
- Spain
- Rest of Europe
Asia-Pacific
- India
- Japan
- China
- Australia
- South Korea
- Rest of Asia-Pacific
Latin America
- Brazil
- Mexico
- Rest of Latin America
The Middle East & Africa
- South Africa
- GCC Countries
- Rest of the Middle East & Africa (ME&A)

Process Spectroscopy Market Regional Analysis
For several reasons, North America pioneered the global market, generating the highest revenue in 2023. The region will continue to remain at the forefront of the market in forecast year. The market is expanding rapidly across North America because to increased shale gas production in countries such as the United States and Canada. One of the most important development stimulants for the regional territorial market is an established R&D framework in the area that spans significant modern industries such as food and beverage, pharmaceuticals, and synthetic chemicals.
Asia-Pacific is expected to be the most promising region throughout the same period, due to its expanding industries and factories. This expansion is being driven by investments in new technologies and a greater emphasis on pharmaceutical quality. China and India are leading the way in innovative inventions.
Process Spectroscopy Market Players
Some of the top process spectroscopy companies offered in our report includes Sartorius AG, ABB, Agilent Technologies, Inc., BUCHI, Danaher, Yokogawa Electric Corporation, HORIBA, Shimadzu Corporation, Thermo Fisher Scientific Inc., Endress+Hauser Group Services AG, and Bruker.
Frequently Asked Questions
How big is the process spectroscopy market?
The process spectroscopy market size was valued at USD 19.2 billion in 2023.
What is the CAGR of the global process spectroscopy market from 2024 to 2032?
The CAGR of process spectroscopy is 11% during the analysis period of 2024 to 2032.
Which are the key players in the process spectroscopy market?
The key players operating in the global market are including Sartorius AG, ABB, Agilent Technologies, Inc., BUCHI, Danaher, Yokogawa Electric Corporation, HORIBA, Shimadzu Corporation, Thermo Fisher Scientific Inc., Endress+Hauser Group Services AG, and Bruker.
Which region dominated the global process spectroscopy market share?
North America held the dominating position in process spectroscopy industry during the analysis period of 2024 to 2032.
Which region registered fastest CAGR from 2024 to 2032?
Asia-Pacific region exhibited fastest growing CAGR for market of process spectroscopy during the analysis period of 2024 to 2032.
What are the current trends and dynamics in the global process spectroscopy industry?
The current trends and dynamics in the process spectroscopy industry include increasing demand for real-time analysis in industrial processes, rising focus on quality control and process optimization, and technological advancements in spectroscopy instruments.
Which technology held the maximum share in 2023?
The molecular spectroscopy technology held the maximum share of the process spectroscopy industry.
Select Licence Type
Connect with our sales team
Why Acumen Research And Consulting
100%
Customer Satisfaction
24x7
Availability - we are always there when you need us
200+
Fortune 50 Companies trust Acumen Research and Consulting
80%
of our reports are exclusive and first in the industry
100%
more data and analysis
1000+
reports published till date


