Pet Obesity Management Market | Acumen Research and Consulting
Pet Obesity Management Market Size - Global Industry, Share, Analysis, Trends and Forecast 2024 - 2032
Published :
Report ID:
Pages :
Format :
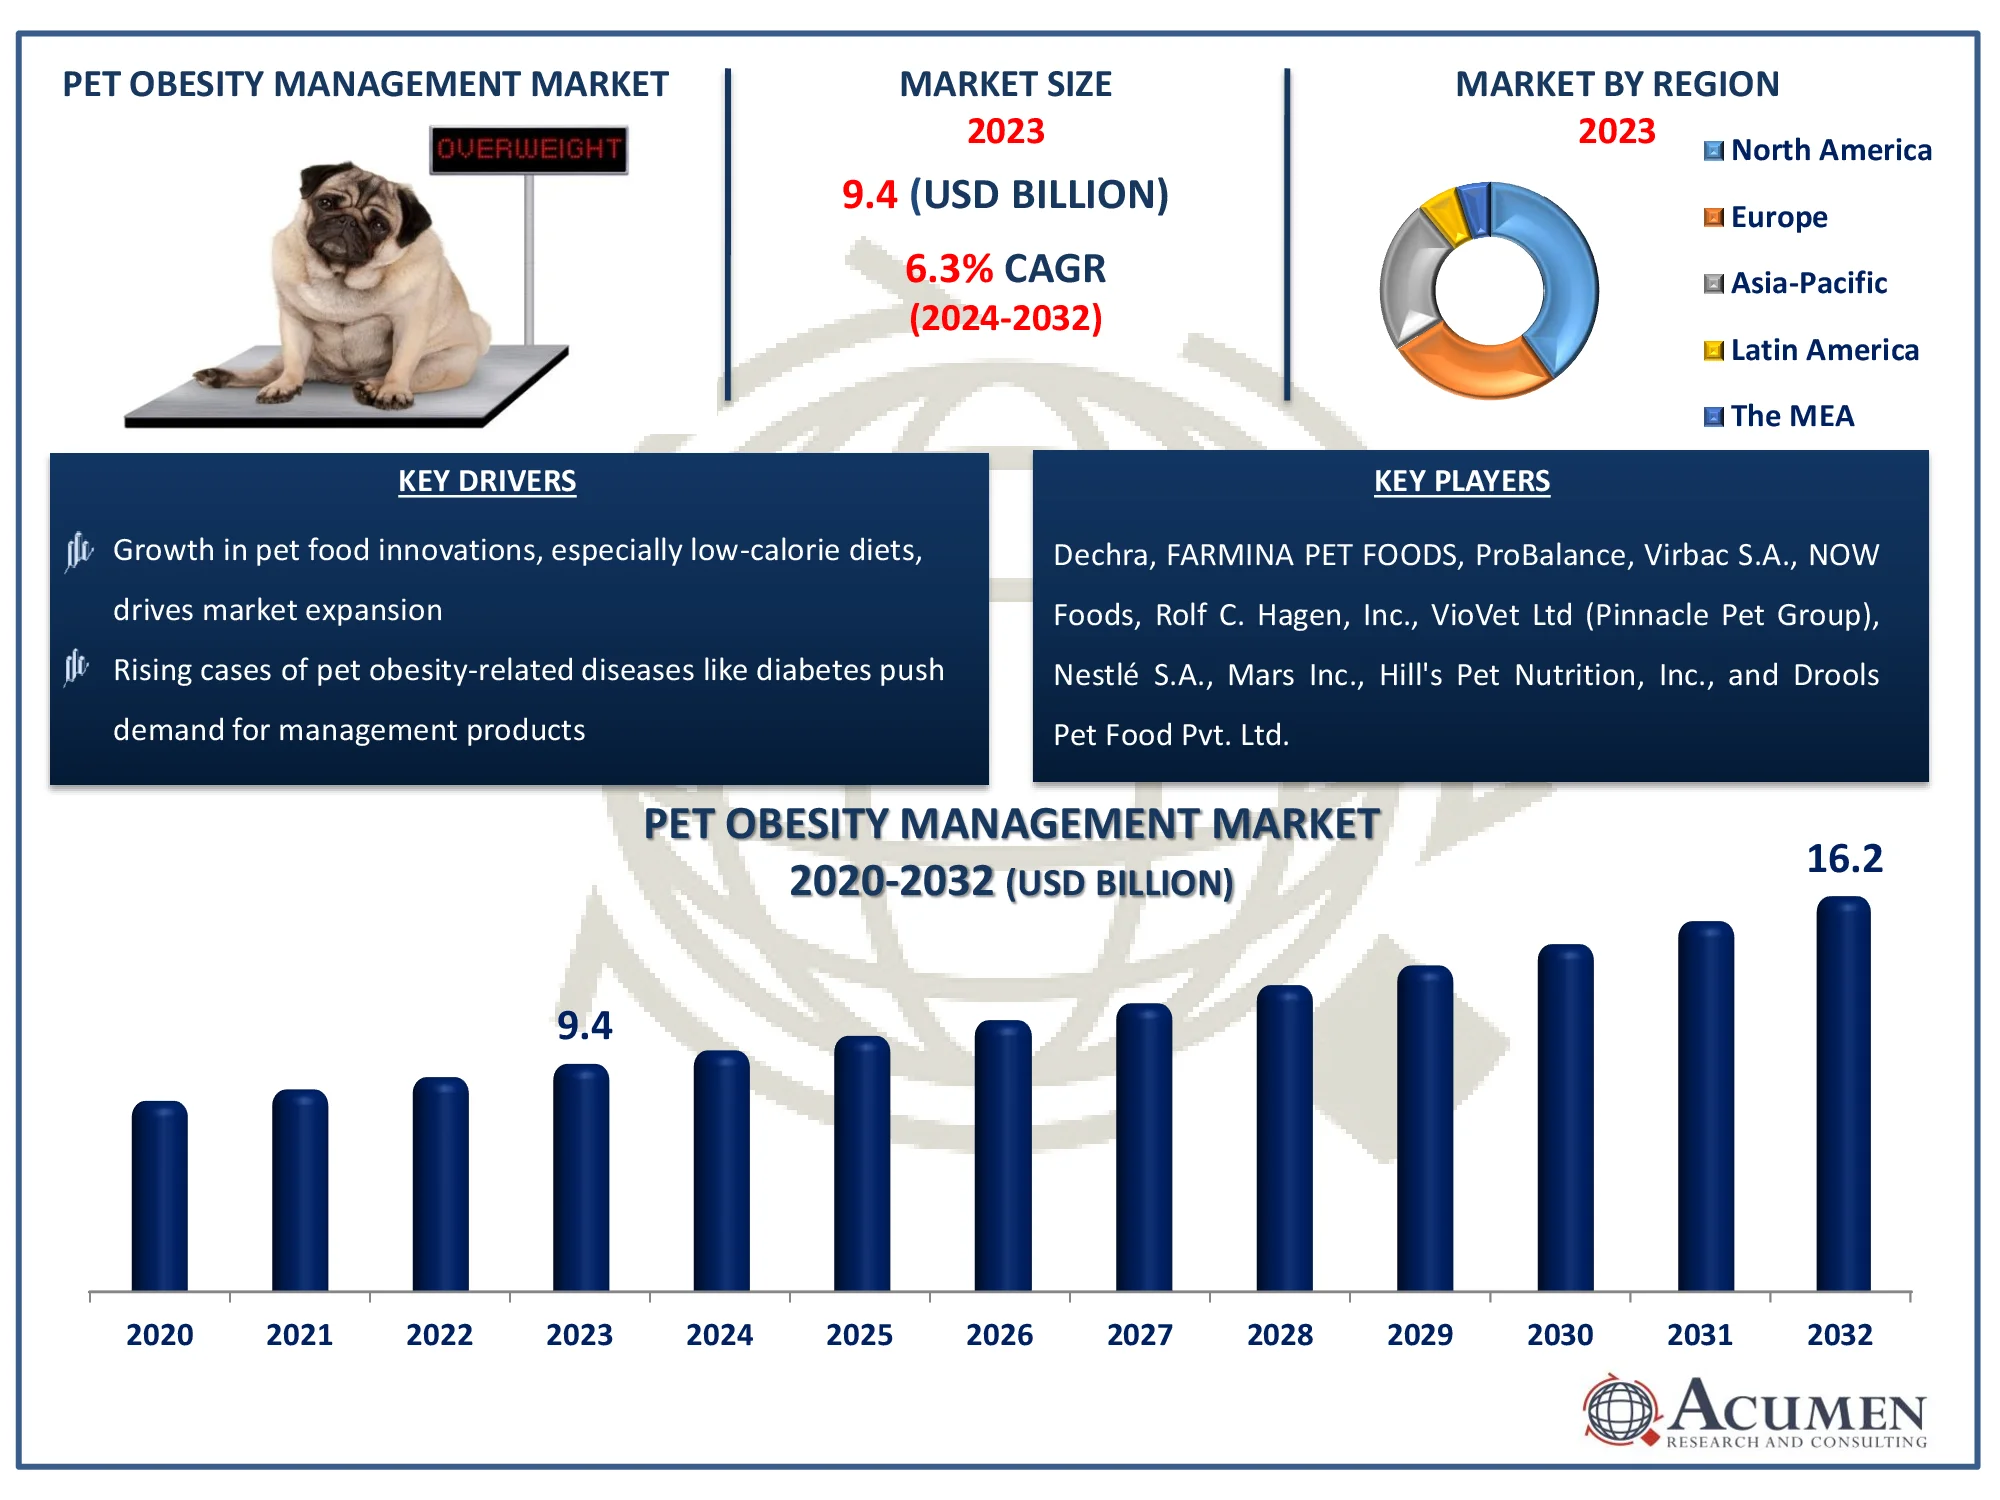
The Global Pet Obesity Management Market Size accounted for USD 9.4 Billion in 2023 and is estimated to achieve a market size of USD 16.2 Billion by 2032 growing at a CAGR of 6.3% from 2024 to 2032.
Pet Obesity Management Market Highlights
- Global pet obesity management market revenue is poised to garner USD 16.2 billion by 2032 with a CAGR of 6.3% from 2024 to 2032
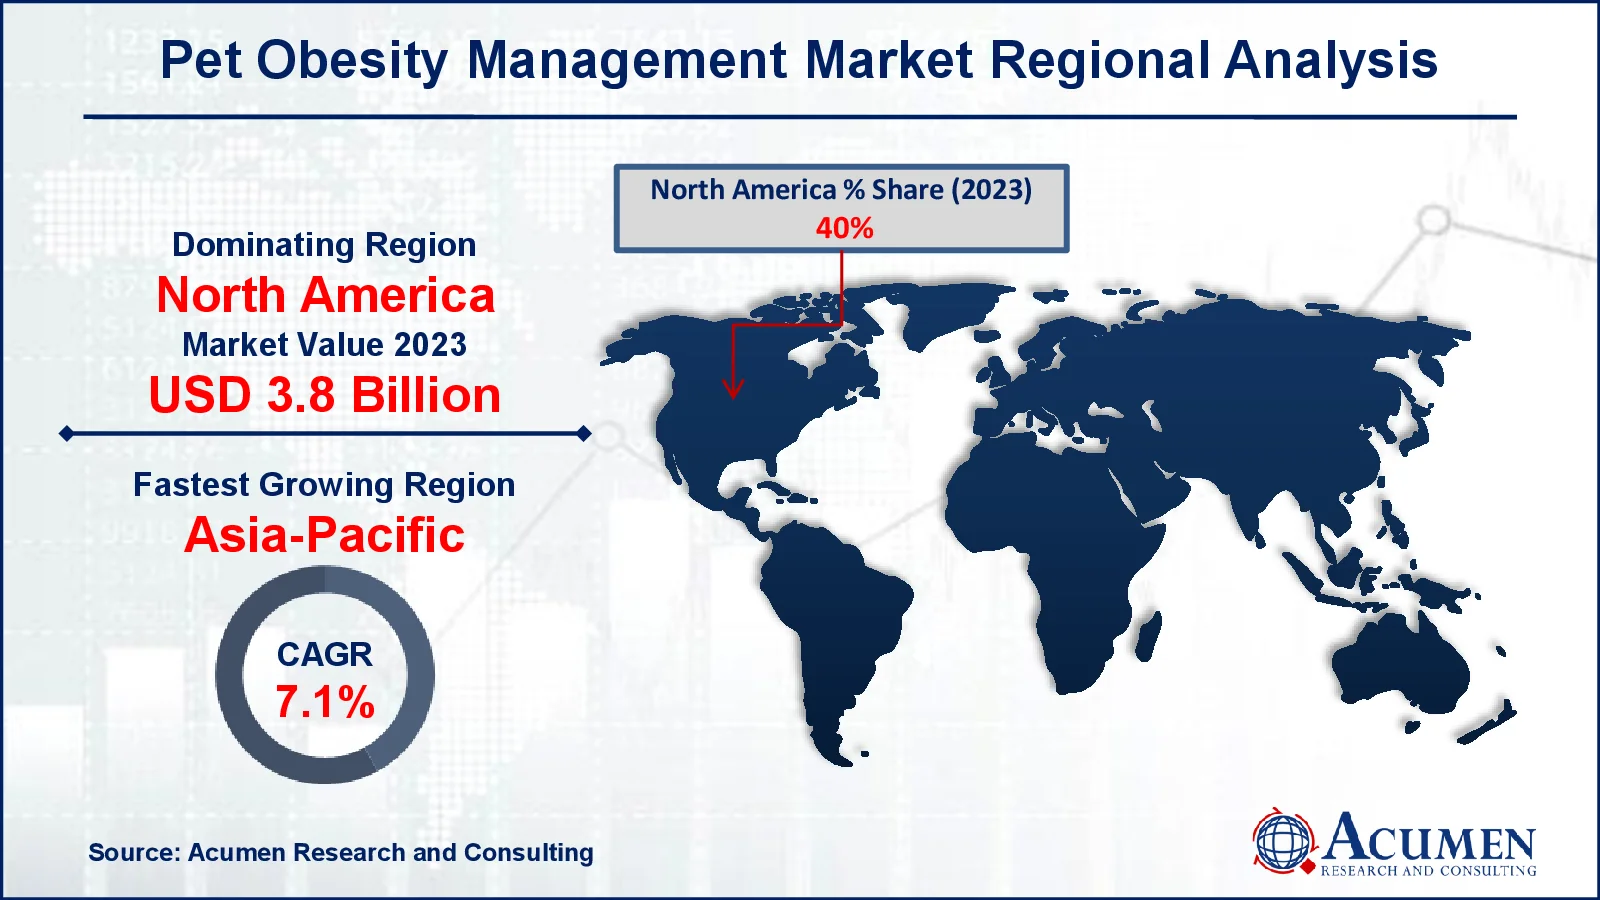
- North America pet obesity management market value occupied around USD 3.8 billion in 2023
- Asia-Pacific pet obesity management market growth will record a CAGR of more than 7.1% from 2024 to 2032
- Among animal type, the dogs sub-segment generated significant revenue in 2023
- Based on end user, the e-commerce sub-segment generated around 45% pet obesity management market share in 2023
- Rising trend of premium, organic, and customized pet food is a popular pet obesity management market trend that fuels the industry demand

Pet obesity management refers to tactics and procedures for preventing and treating excess weight in pets, particularly dogs and cats. It consists of a healthy diet, frequent exercise, and medical interventions. Veterinarians frequently develop customized weight loss strategies based on the pet's breed, age, and health status. To promote balanced nutrition, low-calorie, nutrient-dense meals should be consumed in moderation. Regular physical exercise, such as walks or games, helps to burn excess calories. In more extreme cases, weight-loss medicines or surgery may be recommended. Pet obesity treatment is crucial for preventing linked health conditions such as diabetes, joint difficulties, and heart disease while also improving the pet's quality of life and lifetime.
Global Pet Obesity Management Market Dynamics
Market Drivers
- Increasing pet ownership globally boosts demand for pet obesity management solutions
- Rising awareness about pet health and wellness promotes preventive measures
- Growth in pet food innovations, especially low-calorie diets, drives market expansion
- Rising cases of pet obesity-related diseases like diabetes push demand for management products
Market Restraints
- High cost of specialized pet food and veterinary services limits market accessibility
- Lack of awareness in developing regions hinders market growth
- Difficulty in maintaining pet weight loss regimens reduces long-term effectiveness
Market Opportunities
- Expansion of veterinary clinics offering specialized obesity management services
- Growth of e-commerce platforms for easy access to pet health products
- Increased demand for pet fitness gadgets and trackers creates new market segments
Pet Obesity Management Market Report Coverage
| Market | Pet Obesity Management Market |
| Pet Obesity Management Market Size 2022 |
USD 9.4 Billion |
| Pet Obesity Management Market Forecast 2032 | USD 16.2 Billion |
| Pet Obesity Management Market CAGR During 2023 - 2032 | 6.3% |
| Pet Obesity Management Market Analysis Period | 2020 - 2032 |
| Pet Obesity Management Market Base Year |
2022 |
| Pet Obesity Management Market Forecast Data | 2023 - 2032 |
| Segments Covered | By Product Type, By Animal Type, By End User, And By Geography |
| Regional Scope | North America, Europe, Asia Pacific, Latin America, and Middle East & Africa |
| Key Companies Profiled | Dechra, FARMINA PET FOODS, ProBalance, Virbac S.A., NOW Foods, Rolf C. Hagen, Inc., VioVet Ltd (Pinnacle Pet Group), Nestlé S.A., Mars Inc., Hill's Pet Nutrition, Inc., and Drools Pet Food Pvt. Ltd. |
| Report Coverage |
Market Trends, Drivers, Restraints, Competitive Analysis, Player Profiling, Covid-19 Analysis, Regulation Analysis |
Pet Obesity Management Market Insights
Obesity is recognised as the most important medical disease in pets across the globe. For weight management involve dietary energy restriction with a purpose-formulated diet. Rising need to pet obesity, as obesity increases the risk of other chronic conditions, such as osteoarthritis and diabetes, is expected to drive the growth of market. Furthermore, rising pet adoption and increasing per capita income levels, especially in developing countries, such as U.S. and U.K. are expected to propelling the growth of pet obesity market. Rising concerns among pet owners to manage excess weight of companion animals at the early stage is major factor for boosting the growth of market. High cost of low-calorie diets and deceptive marketing practices are major restrain for the growth of the pet obesity management market.
The pet obesity management industry is developing in response to rising demand for innovative tools and services to combat the growing prevalence of obesity in pets. Along with dietary options, pet fitness trackers, activity monitors, and mobile apps for tracking caloric intake are becoming increasingly popular. Veterinary clinics are now expanding their services to incorporate systematic weight management programs for certain breeds and illnesses. Furthermore, the rising emphasis on preventative healthcare and wellness programs for pets is driving market expansion. Nonetheless, regional variations in pet healthcare facilities and low consumer awareness regarding obesity prevention in poorer countries are significant difficulties for the business.
Pet Obesity Management Market Segmentation
The worldwide market for pet obesity management is split based on product type, animal type end user, and geography.
Pet Obesity Management Market By Product Type
- Drugs
- Food supplements
According to pet obesity management industry analysis, food supplements are the main category due to their increased popularity for weight management and overall pet health. These supplements, which are frequently filled with vitamins, minerals, and low-calorie recipes, help pets maintain their weight while also providing critical nutrients. Pet owners are increasingly choosing dietary supplements over medications since they are natural and have fewer adverse effects. Products such as fat-burning sweets, metabolism-boosting chews, and hunger control tablets have become popular. As pet obesity rates climb, pet parents seek safer, long-term remedies, which fuels the expansion of this market. Furthermore, advancements in palatable supplements for pets stimulate demand, cementing food supplements' position as a pet obesity management market leader.
Pet Obesity Management Market By Animal Type
- Cats
- Dogs
- Others
Dogs have the greatest market share in the pet obesity management industry due to their higher obesity prevalence compared to other pets. Dog owners are becoming more aware of the health problems connected with obesity, such as diabetes, joint troubles, and heart disease, resulting in a greater need for weight management options. The development of customized dog food, low-calorie snacks, and weight management supplements targeted to certain breeds has aided the segment's expansion. Furthermore, dog owners are more likely to invest in preventative care, such as regular veterinary appointments and exercise activities. This proactive strategy, combined with increased pet ownership, positions dogs as a significant driver of the total pet obesity control market.
Pet Obesity Management Market By End User
- E-Commerce
- Pet Specialty Stores
- Others
The e-commerce category is expected to become a key participant in the pet obesity management market forecast period as pet owners' preference for online purchasing grows. E-commerce platforms provide a wide range of pet obesity management solutions, including specialized food, vitamins, and exercise tools, all with the convenience of home delivery. The convenience of comparing costs, reading reviews, and getting unique deals encourages customers to shop online. Furthermore, the global increase in internet penetration, as well as the growing tendency of pet owners seeking expert guidance online, contributes to the segment's quick expansion. E-commerce platforms also offer subscription services for regular orders, ensuring consistent product availability, making this category an important driver of future market growth.
Pet Obesity Management Market Regional Outlook
North America
- U.S.
- Canada
Europe
- U.K.
- Germany
- France
- Spain
- Rest of Europe
Asia-Pacific
- India
- Japan
- China
- Australia
- South Korea
- Rest of Asia-Pacific
Latin America
- Brazil
- Mexico
- Rest of Latin America
The Middle East & Africa
- South Africa
- GCC Countries
- Rest of the Middle East & Africa (ME&A)

Pet Obesity Management Market Regional Analysis
North America is expected to hold major market share for pet obesity management market. Increasing ownership of pet animals in this region is major factor for the growth of market. For instance, According to the American Pet Products Association, Inc. report published, around 60.2 million U.S. households had at least one dog. Almost, 25 to 30% of general canine population was suffering from obesity in the region is major reason for boosting the market of pet obesity management market.
Europe is expected to second leading region for pet obesity management market. In this region increasing obesity is more common in old age because of the lack of exercise is major factor for the growth of market. Furthermore, growing awareness of the role of companion animals in Health is major factor for the growth of market. Additionally, Different committee initiative for animal’s health is major factor for the growth of market. For instance, World Small Animal Veterinary Association (WSAVA) established a One Health committee focused on the spread of zoonotic diseases from dogs, cats and other pet animals to humans.
Asia Pacific is expected to fasted growing market for pet obesity management market. This growth is attributed to rising pet adoption in emerging economies like India, which is one of major factor for boosting the growth of market. Furthermore, government efforts to improve veterinary healthcare facilities and various funding schemes delivered by the national as well as state governments are support the growth of market.
Pet Obesity Management Market Players
Some of the top pet obesity management companies offered in our report includes Dechra, FARMINA PET FOODS, ProBalance, Virbac S.A., NOW Foods, Rolf C. Hagen, Inc., VioVet Ltd (Pinnacle Pet Group), Nestlé S.A., Mars Inc., Hill's Pet Nutrition, Inc., and Drools Pet Food Pvt. Ltd.
Frequently Asked Questions
How big is the pet obesity management market?
The pet obesity Management market size was valued at USD 9.4 billion in 2023.
What is the CAGR of the global pet obesity management market from 2024 to 2032?
The CAGR of pet obesity management is 6.3% during the analysis period of 2024 to 2032.
Which are the key players in the pet obesity management market?
The key players operating in the global market are including Dechra, FARMINA PET FOODS, ProBalance, Virbac S.A., NOW Foods, Rolf C. Hagen, Inc., VioVet Ltd (Pinnacle Pet Group), Nestlé S.A., Mars Inc., Hill's Pet Nutrition, Inc., and Drools Pet Food Pvt. Ltd.
Which region dominated the global pet obesity management market share?
North America held the dominating position in pet obesity management industry during the analysis period of 2024 to 2032.
Which region registered fastest CAGR from 2024 to 2032?
Asia-Pacific region exhibited fastest growing CAGR for market of pet obesity management during the analysis period of 2024 to 2032.
What are the current trends and dynamics in the global pet obesity management industry?
The current trends and dynamics in the pet obesity management industry include increasing pet ownership globally boosts demand for pet obesity management solutions, rising awareness about pet health and wellness promotes preventive measures, growth in pet food innovations, especially low-calorie diets, drives market expansion, and rising cases of pet obesity-related diseases like diabetes push demand for management products.
Which animal type held the maximum share in 2023?
The dogs animal type held the maximum share of the pet obesity management industry.


