Offshore Wind Cable Market | Acumen Research and Consulting
Offshore Wind Cable Market Size - Global Industry, Share, Analysis, Trends and Forecast 2024 - 2032
Published :
Report ID:
Pages :
Format :
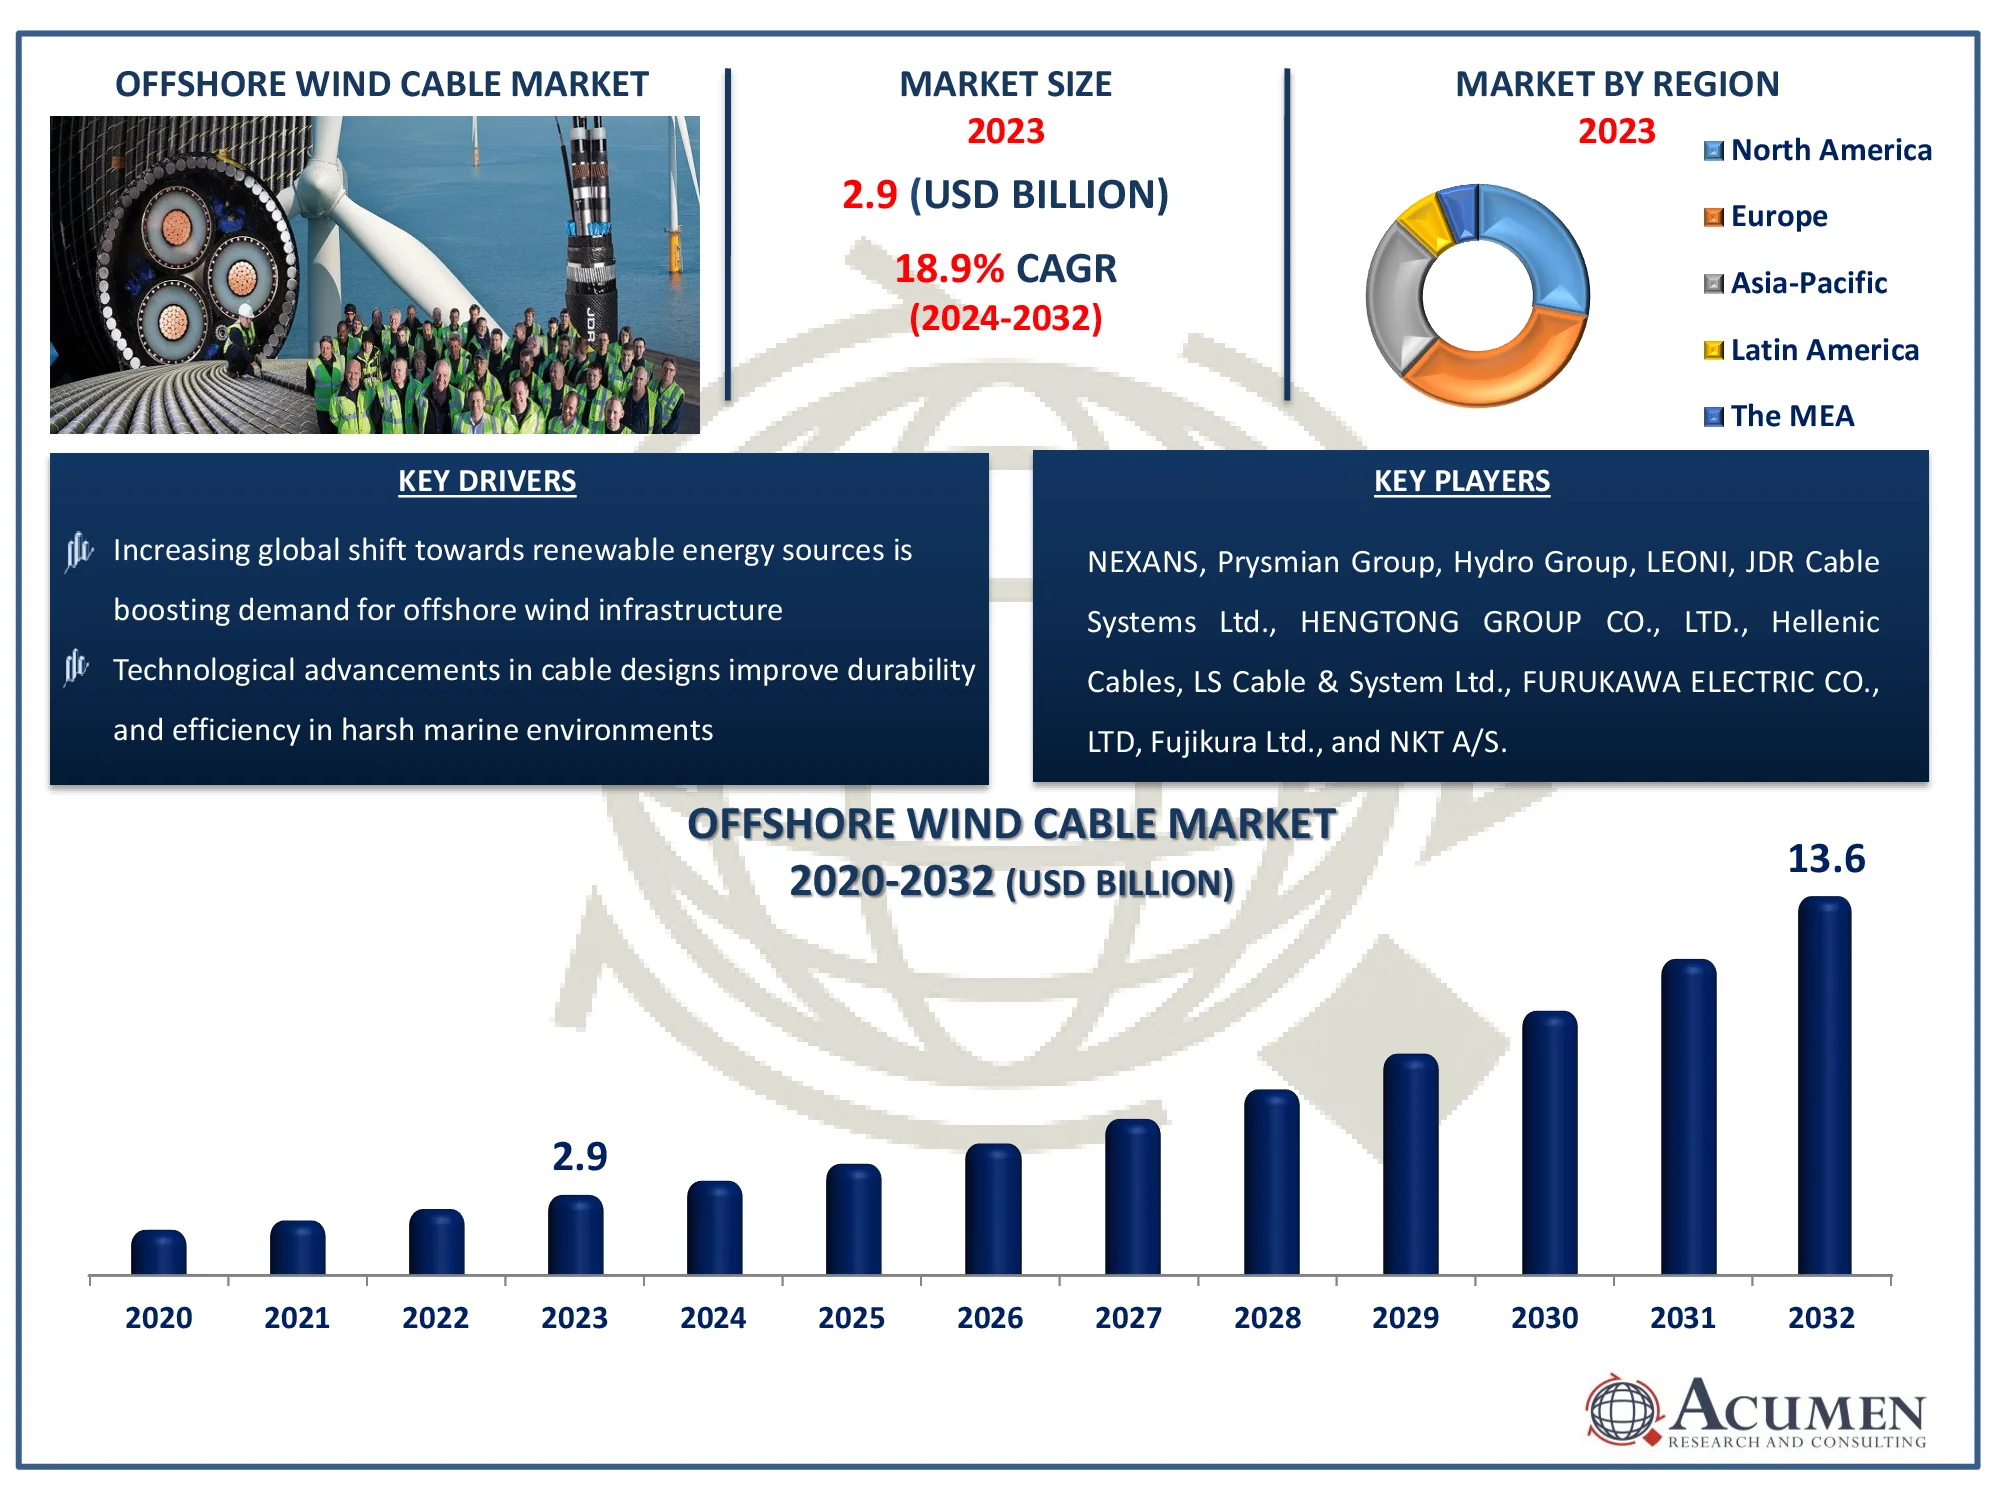
The Global Offshore Wind Cable Market Size accounted for USD 2.9 Billion in 2023 and is estimated to achieve a market size of USD 13.6 Billion by 2032 growing at a CAGR of 18.9% from 2024 to 2032.
Offshore Wind Cable Market Highlights
- Global offshore wind cable market revenue is poised to garner USD 13.6 billion by 2032 with a CAGR of 18.9% from 2024 to 2032
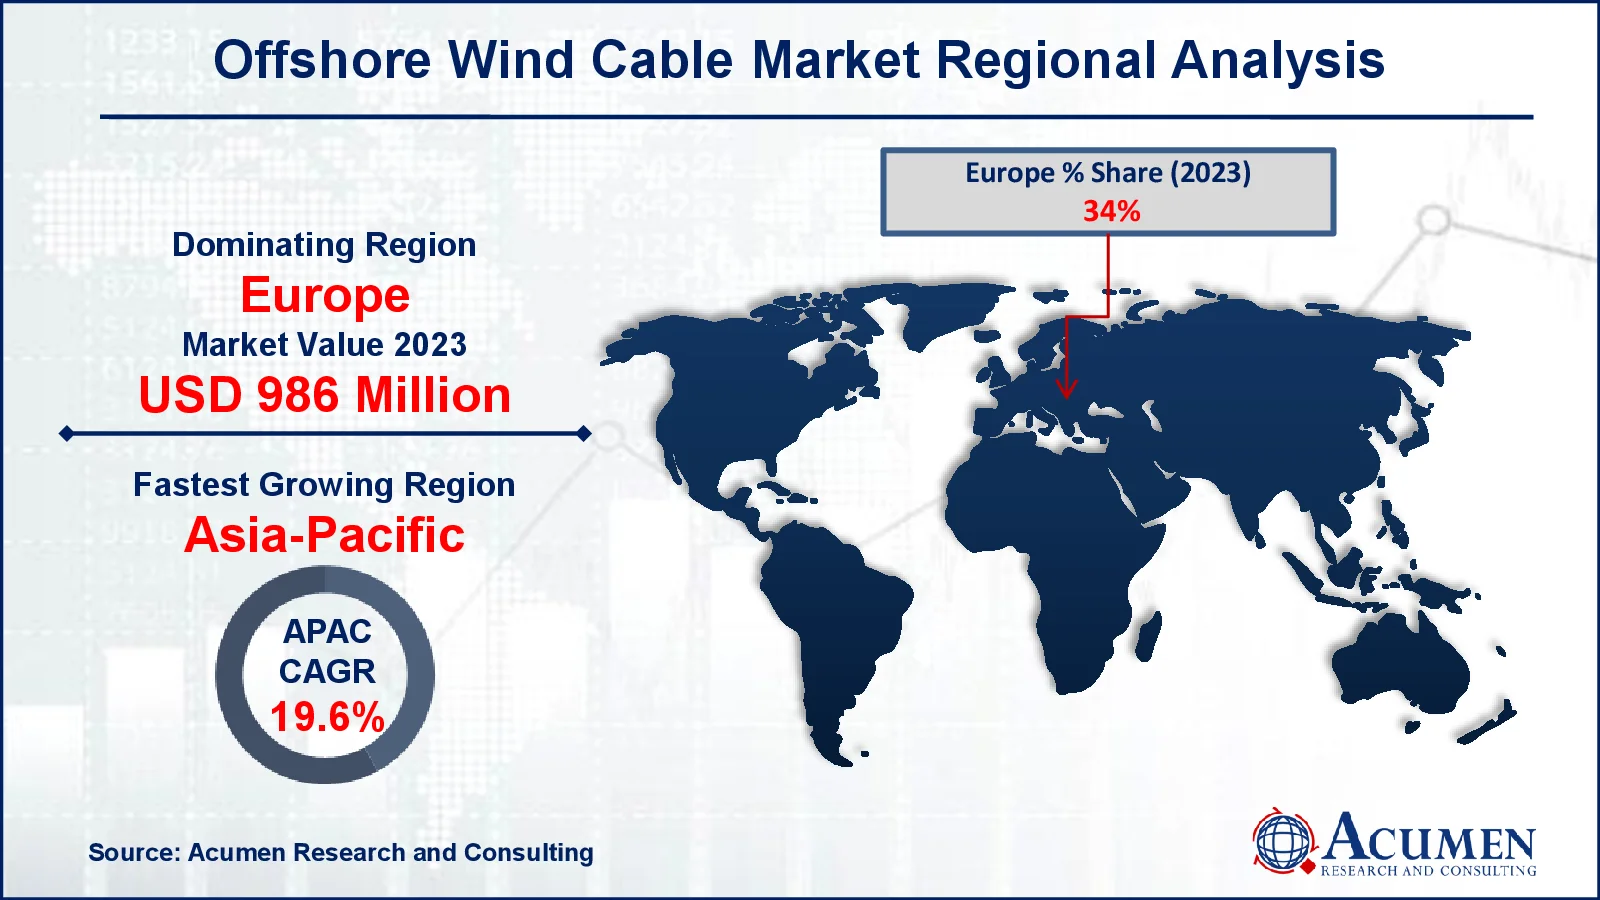
- Europe offshore wind cable market value occupied around USD 986 million in 2023
- Asia-Pacific offshore wind cable market growth will record a CAGR of more than 19.6% from 2024 to 2032
- Among product, the export sub-segment generated noteworthy market share of 69% in 2023
- Based on conductor material, the copper sub-segment generated significant offshore wind cable market share of 97% in 2023
- Growing interest in hybrid energy systems combining offshore wind with other renewable sources is a popular offshore wind cable market trend that fuels the industry demand

Offshore wind cables are specialized power cables that transfer electricity from offshore wind turbines to onshore grids or energy storage facilities. These cables serve an important role in delivering high-voltage energy across marine environments, where they must contend with specific obstacles such as extreme weather, water pressure, corrosion, and interference from marine life. There are two basic types: inter-array cables, which connect turbines within a wind farm, and export cables, which transport electricity from the wind farm to the shore. These cables, designed to resist harsh underwater conditions, are critical for allowing the transition to renewable energy by supporting large-scale offshore wind projects that provide clean power to millions, reducing dependency on fossil fuels and lowering greenhouse gas emissions.
Global Offshore Wind Cable Market Dynamics
Market Drivers
- Increasing global shift towards renewable energy sources is boosting demand for offshore wind infrastructure
- Technological advancements in cable designs improve durability and efficiency in harsh marine environments
- Growing offshore wind installations are driving demand for high-capacity cables to support energy transmission
- Government incentives and policies supporting offshore wind energy expansion
Market Restraints
- High installation and maintenance costs for offshore wind cables limit widespread adoption
- Environmental challenges, including corrosion and impact of marine life, add complexity to cable deployment
- Supply chain disruptions, particularly for raw materials, can lead to project delays and increased costs
Market Opportunities
- Rising investments in offshore wind projects in emerging economies create growth avenues for cable manufacturers
- Development of floating wind farms expands market potential, requiring specialized and flexible cable solutions
- Increased focus on grid integration and interconnection across countries opens up demand for long-distance transmission cables
Offshore Wind Cable Market Report Coverage
| Market | Offshore Wind Cable Market |
| Offshore Wind Cable Market Size 2022 |
USD 2.9 Billion |
| Offshore Wind Cable Market Forecast 2032 | USD 13.6 Billion |
| Offshore Wind Cable Market CAGR During 2023 - 2032 | 18.9% |
| Offshore Wind Cable Market Analysis Period | 2020 - 2032 |
| Offshore Wind Cable Market Base Year |
2022 |
| Offshore Wind Cable Market Forecast Data | 2024 - 2032 |
| Segments Covered | By Technology, By Conductor Material, And By Geography |
| Regional Scope | North America, Europe, Asia Pacific, Latin America, and Middle East & Africa |
| Key Companies Profiled | NEXANS, Prysmian Group, Hydro Group, LEONI, JDR Cable Systems Ltd., HENGTONG GROUP CO., LTD., Hellenic Cables, LS Cable & System Ltd., FURUKAWA ELECTRIC CO., LTD, Fujikura Ltd., and NKT A/S. |
| Report Coverage |
Market Trends, Drivers, Restraints, Competitive Analysis, Player Profiling, Covid-19 Analysis, Regulation Analysis |
Offshore Wind Cable Market Insights
The energy produced by an offshore wind generator is supplied by energy cable to an offshore substation. The energy is gathered from several generators by means of an inter-array cable, depending on the energy capability. Power from the substation is transferred via an import cable to the continental grid. Export wires can be HVAC or HVDC according to the range and rank of the project, while inter-array wires mostly use AC.
The demand for offshore wind cables has seen significant development because of the paradigm shift towards the development of fresh renewable techniques that are increasingly aware of limiting carbon emissions. According to the Global Wind Energy Council (GWEC), the annual offshore wind deployment worldwide increased by 0.5 percent relative to 2017 in 2018. In addition, increased research and development operations in line with the Capacity use factor (CUF) improvement for multiple clean energy sources will enhance the company perspective to attain price skills.
Growing power usage across developing countries, combined with major public attempts to decrease damaging greenhouse gas (GHG) pollution, will have a positive effect on the share of the offshore wind power industry. In addition, low maintenance, restricted land use and restricted human interventions will improve item acceptance. In fact, increased technological developments aimed at reducing the price of components are expected to improve company prospects. The introduction of varying transmission equipment, intelligent tracking and sophisticated forecasting techniques are some of the few essential parameters that will considerably increase the scope of the sector. Increased investment in the creation of state-of - the-art equipment in line with burgeoning high-capacity comprehensive transmission technologies will further fuel consumer requirement.
Offshore Wind Cable Market Segmentation
The worldwide market for offshore wind cable is split based on technology, conductor material, and geography.
Offshore Wind Cable Market By Technology
- Export
- 132kV & Less
- 132 kV & Above
- Inter Array
- 11 kV to 33 kV
- 34kV to 66kV
According to offshore wind cable industry analysis, the industry is experiencing substantial growth due to increasing demand for reliable and efficient inter-array and export cables. Within the inter-array cable segment specifically in the 11 kV to 36 kV range—there is a projected growth rate exceeding 8%. This component is crucial for linking turbines within offshore wind farms and guaranteeing continuous energy transfer throughout the network. Low-capacity offshore wind farms are increasingly using complex interface wires, and there is a growing interest in cost-effective cables with low life cycle costs. Nexans, for example, has been won contracts to create innovative inter-array cable systems, such as Blyth's first 66 kV interchangeable cable project in the United Kingdom. These projects demonstrate the increased demand for inter-array cabling, as well as technological advancements.
Export cables are also gaining popularity in the offshore wind cable market, owing to rising need for efficient electricity transmission over long distances from offshore substations to onshore grids. As offshore wind farms migrate further away from shore, there is a greater demand for high-performance export cables that can reduce energy losses over long distances. Investment in R&D has accelerated advancement in this business, with an emphasis on the endurance and sustainability of cables in severe offshore environments. These export cables are key for lowering energy transmission losses and enhancing overall efficiency, both of which are essential for offshore wind farms' economic viability.
Offshore Wind Cable Market By Conductor Material
Copper-based offshore wind cables represent a significant portion of the offshore wind cable market. Copper’s specific weight, flexibility, and robustness under extreme weather conditions make it an ideal material for offshore applications, allowing it to resist the challenges posed by marine environments. This demand is further driven by the expansion of sea-based assembly capabilities, including offshore wind and solar energy projects. For example, the Prysmian Group has won a substantial contract to supply 52 kilometers of copper cable to the Deutsche Bucht project, a 252 MW offshore wind farm. Copper cables' robustness and capacity to survive hostile marine environments continue to make them the preferred material for offshore wind generating installations.
At the same time, aluminum-based offshore wind cables are gaining popularity as a cost-effective option. Aluminum cables are easier to produce and have more flexible combinations than copper wires. They also have reduced manufacturing and maintenance costs. Aluminum cables, which have a long life cycle and minimal transmission losses, are increasingly being employed in applications that require great durability and cost savings. An example of this shift is JDR’s contract, awarded in June 2019, to supply 78 kilometers of aluminum cable, connectors, and repair joints for a wind farm project in Taiwan. This development demonstrates a growing preference for aluminum in offshore wind projects, especially where the lighter weight and lower costs of aluminum are advantageous.
Offshore Wind Cable Market Regional Outlook
North America
- U.S.
- Canada
Europe
- U.K.
- Germany
- France
- Spain
- Rest of Europe
Asia-Pacific
- India
- Japan
- China
- Australia
- South Korea
- Rest of Asia-Pacific
Latin America
- Brazil
- Mexico
- Rest of Latin America
The Middle East & Africa
- South Africa
- GCC Countries
- Rest of the Middle East & Africa (ME&A)

Offshore Wind Cable Market Regional Analysis
In terms of offshore wind cable market analysis, the industry is divided into North America, Latin America, Europe, Asia Pacific and the Middle East & Africa regionally. The Asia Pacific offshore wind cable industry will be driven by positive economic outlook along with favourable public decarbonisation policies and laws. Furthermore, price mitigation will increase the consumer action through the realization of economies of scale and distribution of funds from global funding institutions. Taiwan, for example, the Ministry of Economic Affairs (MOEA) has announced plans to introduce 5.6 GW of offshore wind capability. North America, dominated by the U.S., is regarded by the offshore wind sector as an evolving market. Increased customer knowledge of environmental effects, together with the recognition of wind capacity across the US, will affect the dynamics of the sector favorably. The U.S. commissioned its first commercial offshore wind farm in December 2016 with a capacity of 30 MW, comprising a bidirectional 34.6kV Block Island transmission system of 35 km.
Offshore Wind Cable Market Players
Some of the top offshore wind cable market companies offered in our report includes NEXANS, Prysmian Group, Hydro Group, LEONI, JDR Cable Systems Ltd., HENGTONG GROUP CO., LTD., Hellenic Cables, LS Cable & System Ltd., FURUKAWA ELECTRIC CO., LTD, Fujikura Ltd., and NKT A/S.
Frequently Asked Questions
How big is the offshore wind cable market?
The offshore wind cable market size was valued at USD 2.9 billion in 2023.
What is the CAGR of the global offshore wind cable market from 2024 to 2032?
The CAGR of offshore wind cable is 18.9% during the analysis period of 2024 to 2032.
Which are the key players in the offshore wind cable market?
The key players operating in the global market are including NEXANS, Prysmian Group, Hydro Group, LEONI, JDR Cable Systems Ltd., HENGTONG GROUP CO., LTD., Hellenic Cables, LS Cable & System Ltd., FURUKAWA ELECTRIC CO., LTD, Fujikura Ltd., and NKT A/S.
Which region dominated the global offshore wind cable market share?
Europe held the dominating position in offshore wind cable industry during the analysis period of 2024 to 2032.
Which region registered fastest CAGR from 2024 to 2032?
Asia-Pacific region exhibited fastest growing CAGR for market of offshore wind cable during the analysis period of 2024 to 2032.
What are the current trends and dynamics in the global Offshore Wind Cable industry?
The current trends and dynamics in the offshore wind cable industry include increasing global shift towards renewable energy sources is boosting demand for offshore wind infrastructure, technological advancements in cable designs improve durability and efficiency in harsh marine environments, growing offshore wind installations are driving demand for high-capacity cables to support energy transmission, and government incentives and policies supporting offshore wind energy expansion.
Which conductor material held the maximum share in 2023?
The copper conductor material held the maximum share of the offshore wind cable industry.


