Copper Market Size - Global Industry, Share, Analysis, Trends and Forecast 2023 - 2032
Published :
Report ID:
Pages :
Format :
Copper Market Size - Global Industry, Share, Analysis, Trends and Forecast 2023 - 2032
Report Coverage
- Industry Dynamics
- Market Size and Forecast Data
- Segment Analysis
- Competitive Landscape
- Regional Analysis with a Niche Focus on Country-Level Data
- High Level Analysis - Porter's, PESTEL, Value Chain, etc.
- Company Profiles of Key Players
- Option to Customize the Report As Per Your Specific Need
Request Sample Report
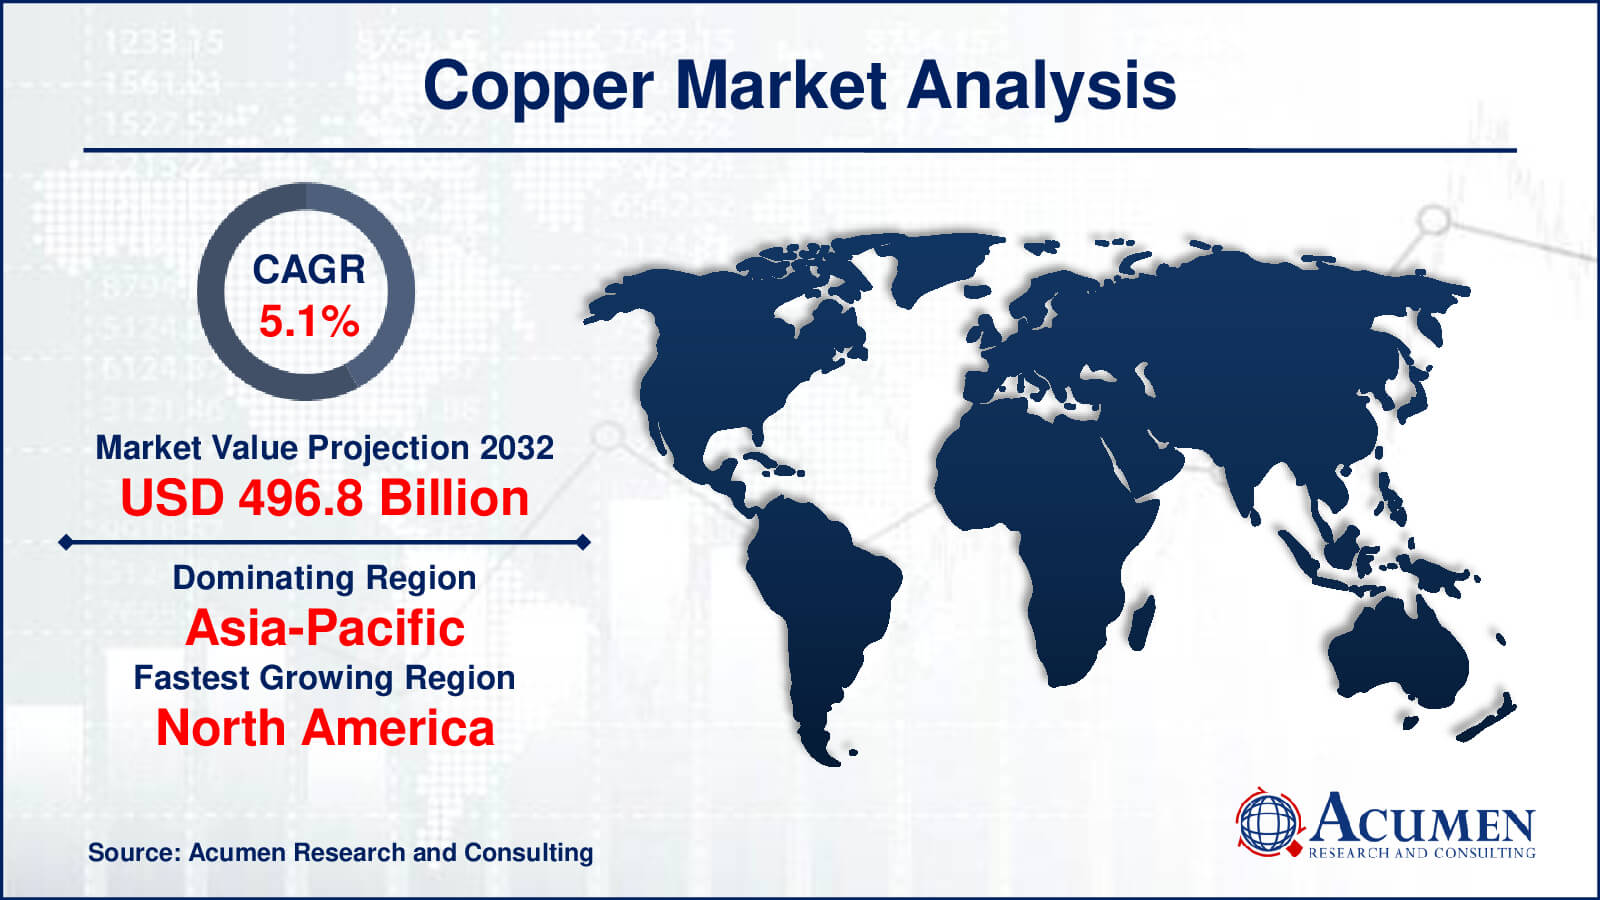
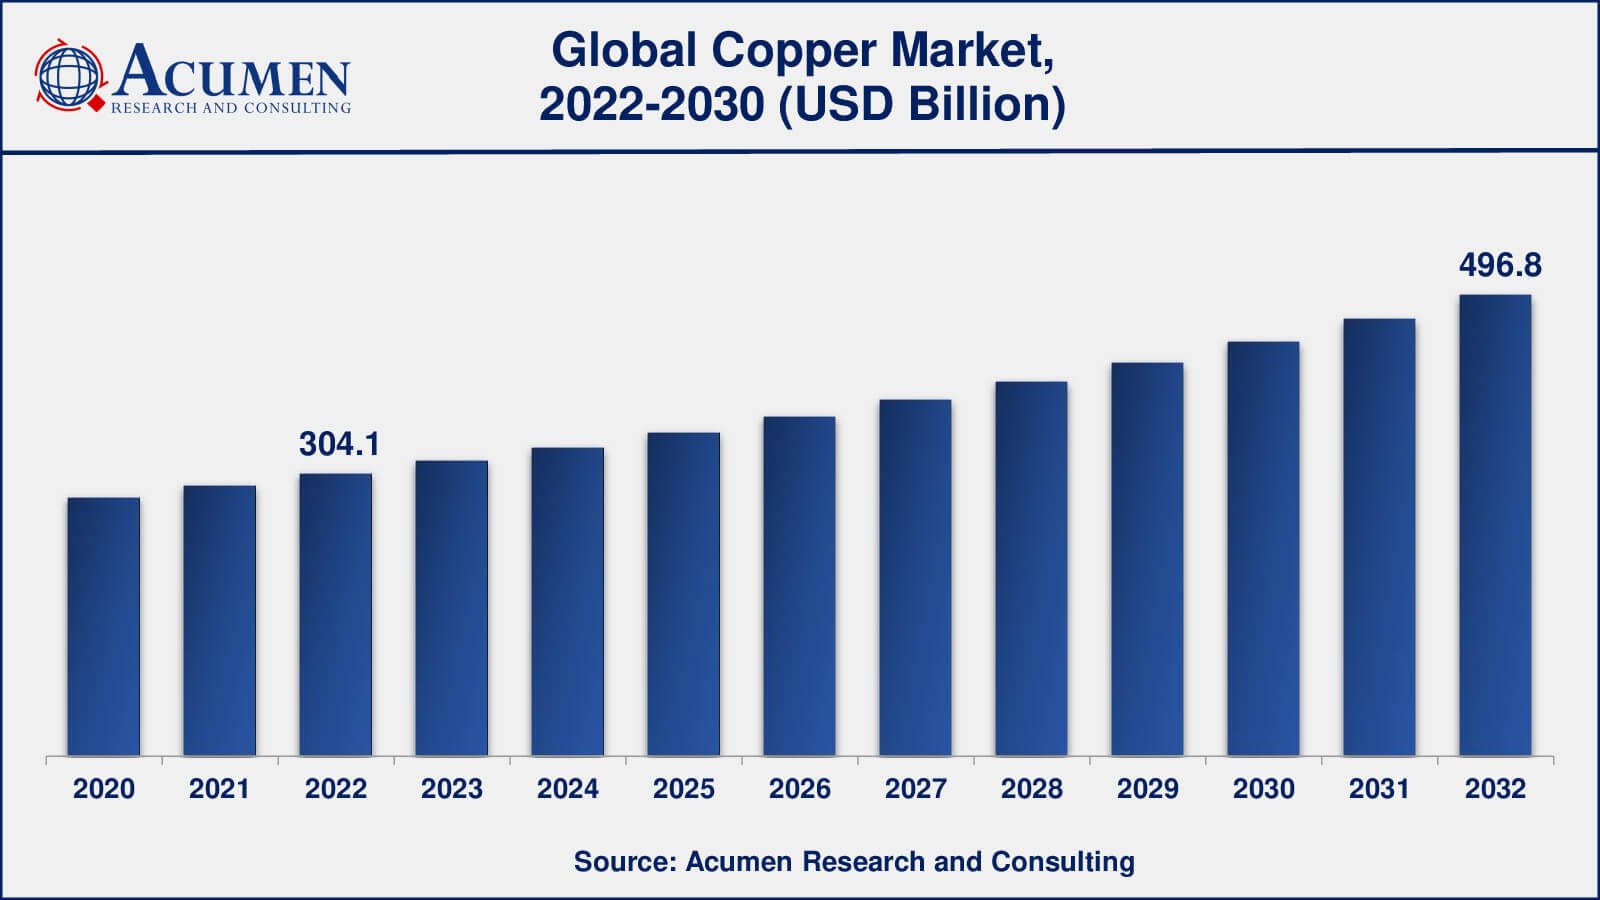
The Global Copper Market Size accounted for USD 304.1 Billion in 2022 and is estimated to achieve a market size of USD 496.8 Billion by 2032 growing at a CAGR of 5.1% from 2023 to 2032.
Copper Market Highlights
- Global copper market revenue is poised to garner USD 496.8 billion by 2032 with a CAGR of 5.1% from 2023 to 2032
- Asia-Pacific copper market value occupied around USD 203 billion in 2022
- North America copper market growth will record a CAGR of more than 18% from 2023 to 2032
- Among application, the electrical & electronics sub-segment generated US$ 104 billion revenue in 2022
- Based on application, the defense and military sub-segment generated around 24% share in 2022
- Rising trend of electric vehicles is a popular copper market trend that fuels the industry demand

The increasing demand for copper could be met through developments in mining technology, well-organized designs for ore processing, and the discovery of new copper reserves. According to the United States Geological Survey (USGS), international copper reserves rose by approximately 720 million tons in 2017, and undiscovered copper reserves are estimated to be approximately 3,500 million tons. In Europe, the total number of copper reserves is minimal, and these reserves fail to meet the gap between the demand and supply for copper in the region. Copper is the only metal that retains its chemical and physical properties after reprocessing. Manufacturers in the region are taking advantage of this by utilizing the circular economy of copper to meet the growing demand for the metal. The term 'circular economy of copper' refers to the renewable nature of copper, driven by its reprocessing and reuse. Used copper products are recycled to extract copper, and the extracted copper is reused to manufacture new products.

Global Copper Market Dynamics
Market Drivers
- Growing demand in electronics industry
- Increasing production from copper mine
- Rising number of construction projects in developing nations
- Rising global demand for copper
Market Restraints
- Presence of alternatives
- Fluctuating prices
- Stringent regulations associated with mining
Market Opportunities
- Rising trend of electric vehicles
- Extensive demand in medical devices
- The rising urbanization and infrastructural development
Copper Market Report Coverage
| Market | Copper Market |
| Copper Market Size 2022 | USD 304.1 Billion |
| Copper Market Forecast 2032 | USD 496.8 Billion |
| Copper Market CAGR During 2023 - 2032 | 5.1% |
| Copper Market Analysis Period | 2020 - 2032 |
| Copper Market Base Year |
2022 |
| Copper Market Forecast Data | 2023 - 2032 |
| Segments Covered | By Type, By Form, By Application, And By Geography |
| Regional Scope | North America, Europe, Asia Pacific, Latin America, and Middle East & Africa |
| Key Companies Profiled | Jiangxi Copper Corporation, Tongling Non-Ferrous Metals Group, BHP Bilition, Antofagasta Plc., LS-Nikko Co., Group Mexico, Aurubis, Vedanta Resources Plc, Freeport McMoRan Inc., Codelco, Rio Tinto, Glencore International AG, and Sumitomo Metal Mining Co. Ltd. |
| Report Coverage |
Market Trends, Drivers, Restraints, Competitive Analysis, Player Profiling, Covid-19 Analysis, Regulation Analysis |
Copper Market Insights
Some of the major factors driving the growth of this market include the upgrading of living standards and the growing purchasing power of people, especially in developing economies. This will propel the copper market. The incredible growth in the number of electronic gadgets such as laptops, cell phones, smart devices, and television sets across the globe is increasing the demand for the product. One of the primary drivers of the copper market is economic growth. Copper is known as an industrial metal, and its demand is closely tied to economic activity. Copper is in high demand in construction, industrial, and infrastructure projects during periods of strong economic expansion. Copper consumption is mostly driven by the building industry. Copper is utilized in building and infrastructure projects for wiring, plumbing, roofing, and different structural Forms. In growing economies, urbanization and infrastructure development contribute to increased copper consumption.
Growing environmental concerns and an emphasis on sustainability are important restricting forces in the copper market. Copper mining and processing can have serious environmental consequences, such as habitat destruction, water pollution, and greenhouse gas emissions. There is an increasing demand for responsible and sustainable mining practices as worldwide awareness of environmental issues and climate change rises.
Copper Market Segmentation
The worldwide market for copper is split based on type, form, application, and geography.
Copper Types
- Primary Copper
- Secondary Copper
Within the type segment, the copper market is divided into primary copper and secondary copper. Primary copper has experienced significant growth during the forecast period. It is derived directly from mining operations and is the purest form of copper. Primary copper serves as the primary source of supply for various industries, including construction, electronics, and manufacturing. In terms of volume, primary copper production often constitutes the largest contributor to the copper market.
The secondary copper market, also known as copper recycling, makes a significant contribution to the overall copper supply. Recycled copper is obtained from sources such as copper waste, discarded electrical wiring, and outdated copper items. Recycling reduces the demand for primary copper production and conserves natural resources, making it an essential Form of the copper market.
Copper Forms
- Wire Rods
- Plates
- Sheets and Strips
- Tubes
- Bars and Sections
- Others
Within the form segment, the wire rods category emerged as the leader in terms of revenue share in previous years. Wire rods are an important component of the copper market since they are used to make wires, cables, and electrical conductors. Because copper wires are widely utilised in electrical and telecommunication applications, wire rods are a critical component of the copper industry. The expansion of the electrical and electronics industries, as well as the increasing usage of electric vehicles, has contributed to this segment's supremacy. The Sheets and Strips is expected to grow second fastest segment. Copper sheets and strips, as well as copper foils, are used in a variety of industries, including roofing, construction, automotive manufacture, and electronics. Copper foils, in particular, are utilised extensively in the electronics sector for printed circuit boards (PCBs). The ongoing expansion of the electronics sector, as well as the demand for high-tech equipment, have increased the importance of sheets and strips in the copper market.
Copper Applications
- Building & Construction
- Electrical & Electronics
- Industrial Machinery & Equipment
- Transportation
- Consumer & General Products
By application, the market is categorized into building & construction, electrical & electronics, industrial machinery & equipment, transportation, and consumer & general products. As per the copper market forecast, he electrical and electronics application are expected to lead the market in the coming years. Rising application in the electrical power industry such as wire, cable, residential electric circuits, transformers, plug components, connectors, and motor manufacturing is anticipated to drive its consumption over the forecast period. Furthermore, copper brazing material and copper foils are being gradually used in vacuum electronic devices such as high-frequency tubes, magnetrons, and copper-printed circuits.
Copper Market Regional Outlook
North America
- U.S.
- Canada
Europe
- U.K.
- Germany
- France
- Spain
- Rest of Europe
Asia-Pacific
- India
- Japan
- China
- Australia
- South Korea
- Rest of Asia-Pacific
Latin America
- Brazil
- Mexico
- Rest of Latin America
The Middle East & Africa
- South Africa
- GCC Countries
- Rest of the Middle East & Africa (ME&A)
Copper Market Regional Analysis
Asia-Pacific dominated the global copper market, holding over 67% of the market share in 2022, followed by North America and Europe. In Asia-Pacific, China established a significant share of the copper market, both in terms of volume and revenue, in 2022. The presence of key copper refineries and manufacturers, along with increasing demand for construction driven by growing urbanization in the nation, is fueling the demand for copper in China. Additionally, the rapid development of electric vehicles in countries like China, Japan, and India is expected to boost the Asia-Pacific copper market.
By the end of 2021, there were 10 million electric cars on the road worldwide, according to the International Energy Agency (IEA). Despite the pandemic-related global decline in auto sales, which saw a 16% decrease in global auto sales in 2021, electric car registrations increased by 41%. The market has expanded in this area due to factors such as a growing population and rising demand for high-quality goods.
The copper market in North America, Europe, and Asia-Pacific is anticipated to develop at a high CAGR during the estimated period. In contrast, the copper market in Latin America and the Middle East & Africa is expected to grow at a slower pace during the forecast period.
Copper Market Players
Some of the top copper companies offered in our report include Jiangxi Copper Corporation, Tongling Non-Ferrous Metals Group, BHP Bilition, Antofagasta Plc., LS-Nikko Co., Group Mexico, Aurubis, Vedanta Resources Plc, Freeport McMoRan Inc., Codelco, Rio Tinto, Glencore International AG, and Sumitomo Metal Mining Co. Ltd.
Frequently Asked Questions
What was the market size of the copper in 2022?
The market size of copper was USD 304.1 billion in 2022.
What is the CAGR of the global copper market from 2023 to 2032?
The CAGR of copper is 5.1% during the analysis period of 2023 to 2032.
Which are the key players in the copper market?
The key players operating in the global market are including Jiangxi Copper Corporation, Tongling Non-Ferrous Metals Group, BHP Bilition, Antofagasta Plc., LS-Nikko Co., Group Mexico, Aurubis, Vedanta Resources Plc, Freeport McMoRan Inc., Codelco, Rio Tinto, Glencore International AG, and Sumitomo Metal Mining Co. Ltd.
Which region dominated the global copper market share?
Asia-Pacific held the dominating position in copper industry during the analysis period of 2023 to 2032.
Which region registered fastest CAGR from 2023 to 2032?
North America region exhibited fastest growing CAGR for market of copper during the analysis period of 2023 to 2032.
What are the current trends and dynamics in the global copper industry?
The current trends and dynamics in the copper industry include growing demand in electronics industry, increasing production from copper mine, rising number of construction projects in developing nations, and rising global demand for copper.
Which type held the maximum share in 2022?
The primary copper type held the maximum share of the copper industry.


