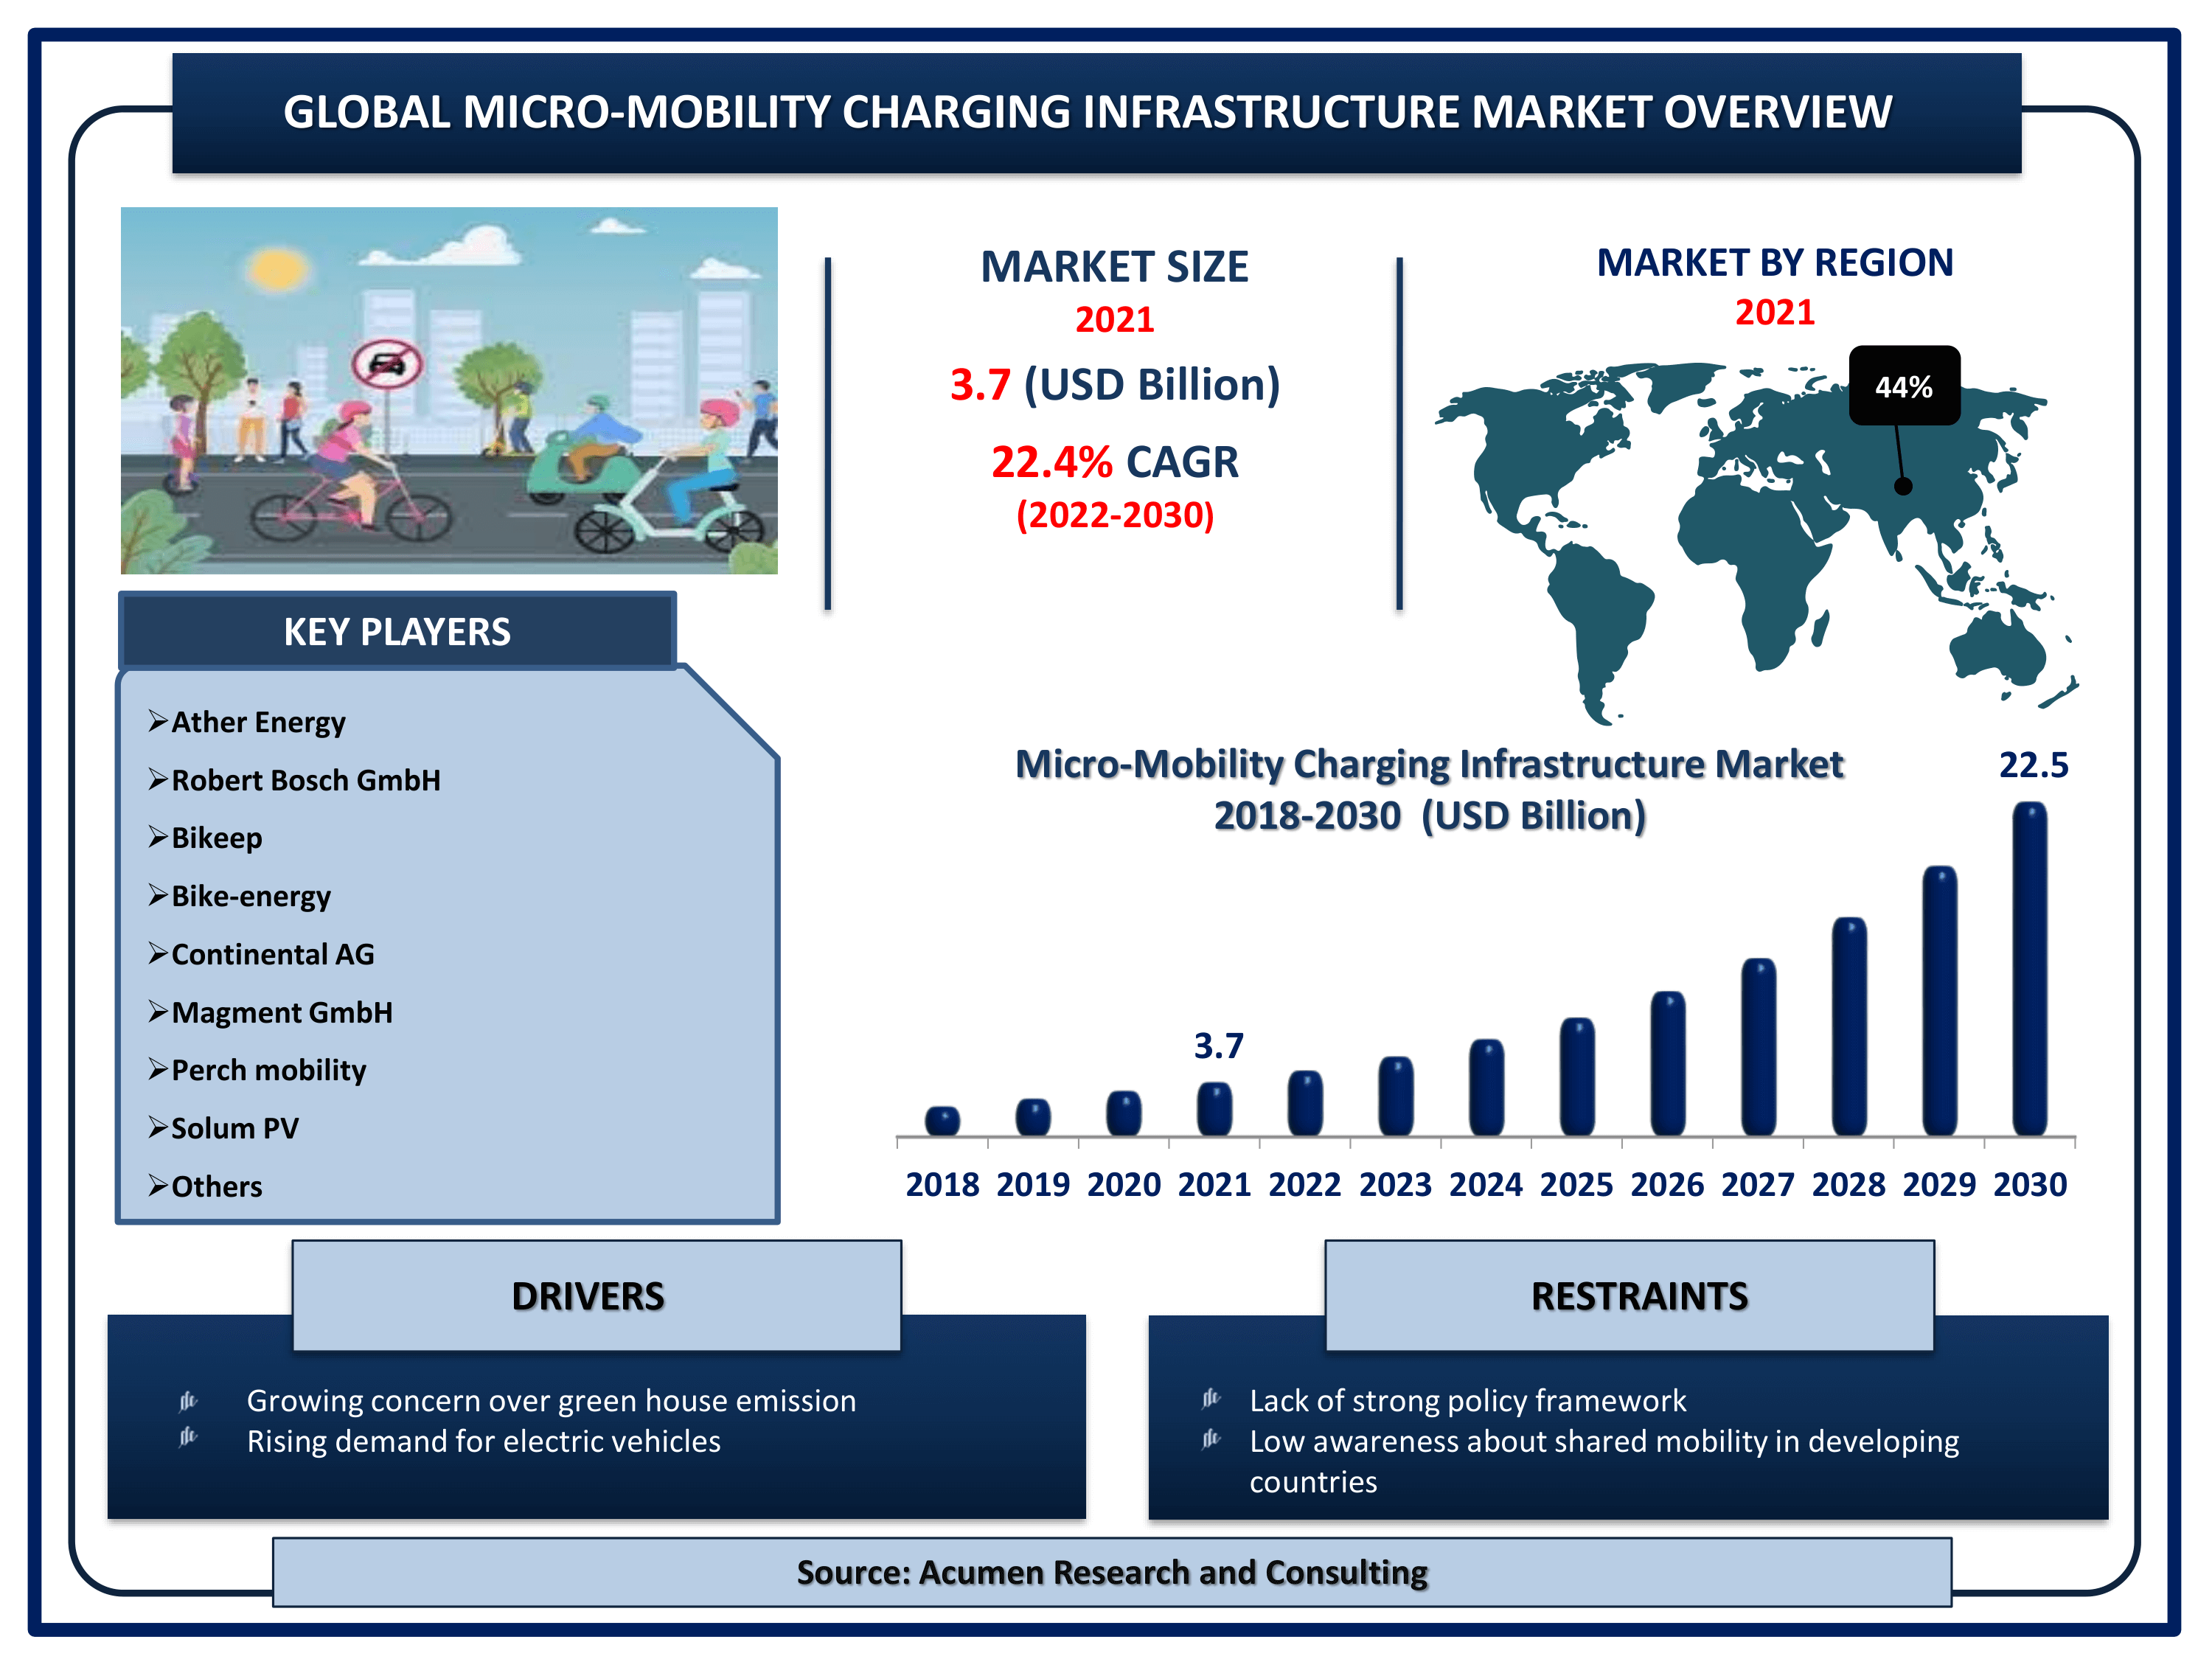
The Global Micro-Mobility Charging Infrastructure Market Size accounted for USD 3.7 Billion in 2021 and is projected to achieve a market size of USD 22.5 Billion by 2030 rising at a CAGR of 22.4% from 2022 to 2030. Micro-mobility solutions (such as electric hover boards, bikes, and scooters) are rapidly expanding in towns and cities. "Charge," a micro-mobility company based in the United States, has expanded its global footprint, particularly in the United States and Europe, by installing charging stations for e-scooters and other micro-mobility vehicles in 6,000 locations. Micro-mobility is also supported by very light vehicles such as e-scooters and skateboards.
Micro-Mobility Charging Infrastructure Market Report Statistics
- Global micro-mobility charging infrastructure market revenue is estimated to reach USD 22.5 Billion by 2030 with a CAGR of 22.4% from 2022 to 2030
- According to our recent estimates, the worldwide sales of electric scooters and bicycles reached over 50 million units in 2020
- Asia-Pacific micro-mobility charging infrastructure market share accounted for over 44% shares in 2021
- North America micro-mobility charging infrastructure market growth will record fastest CAGR from 2022 to 2030
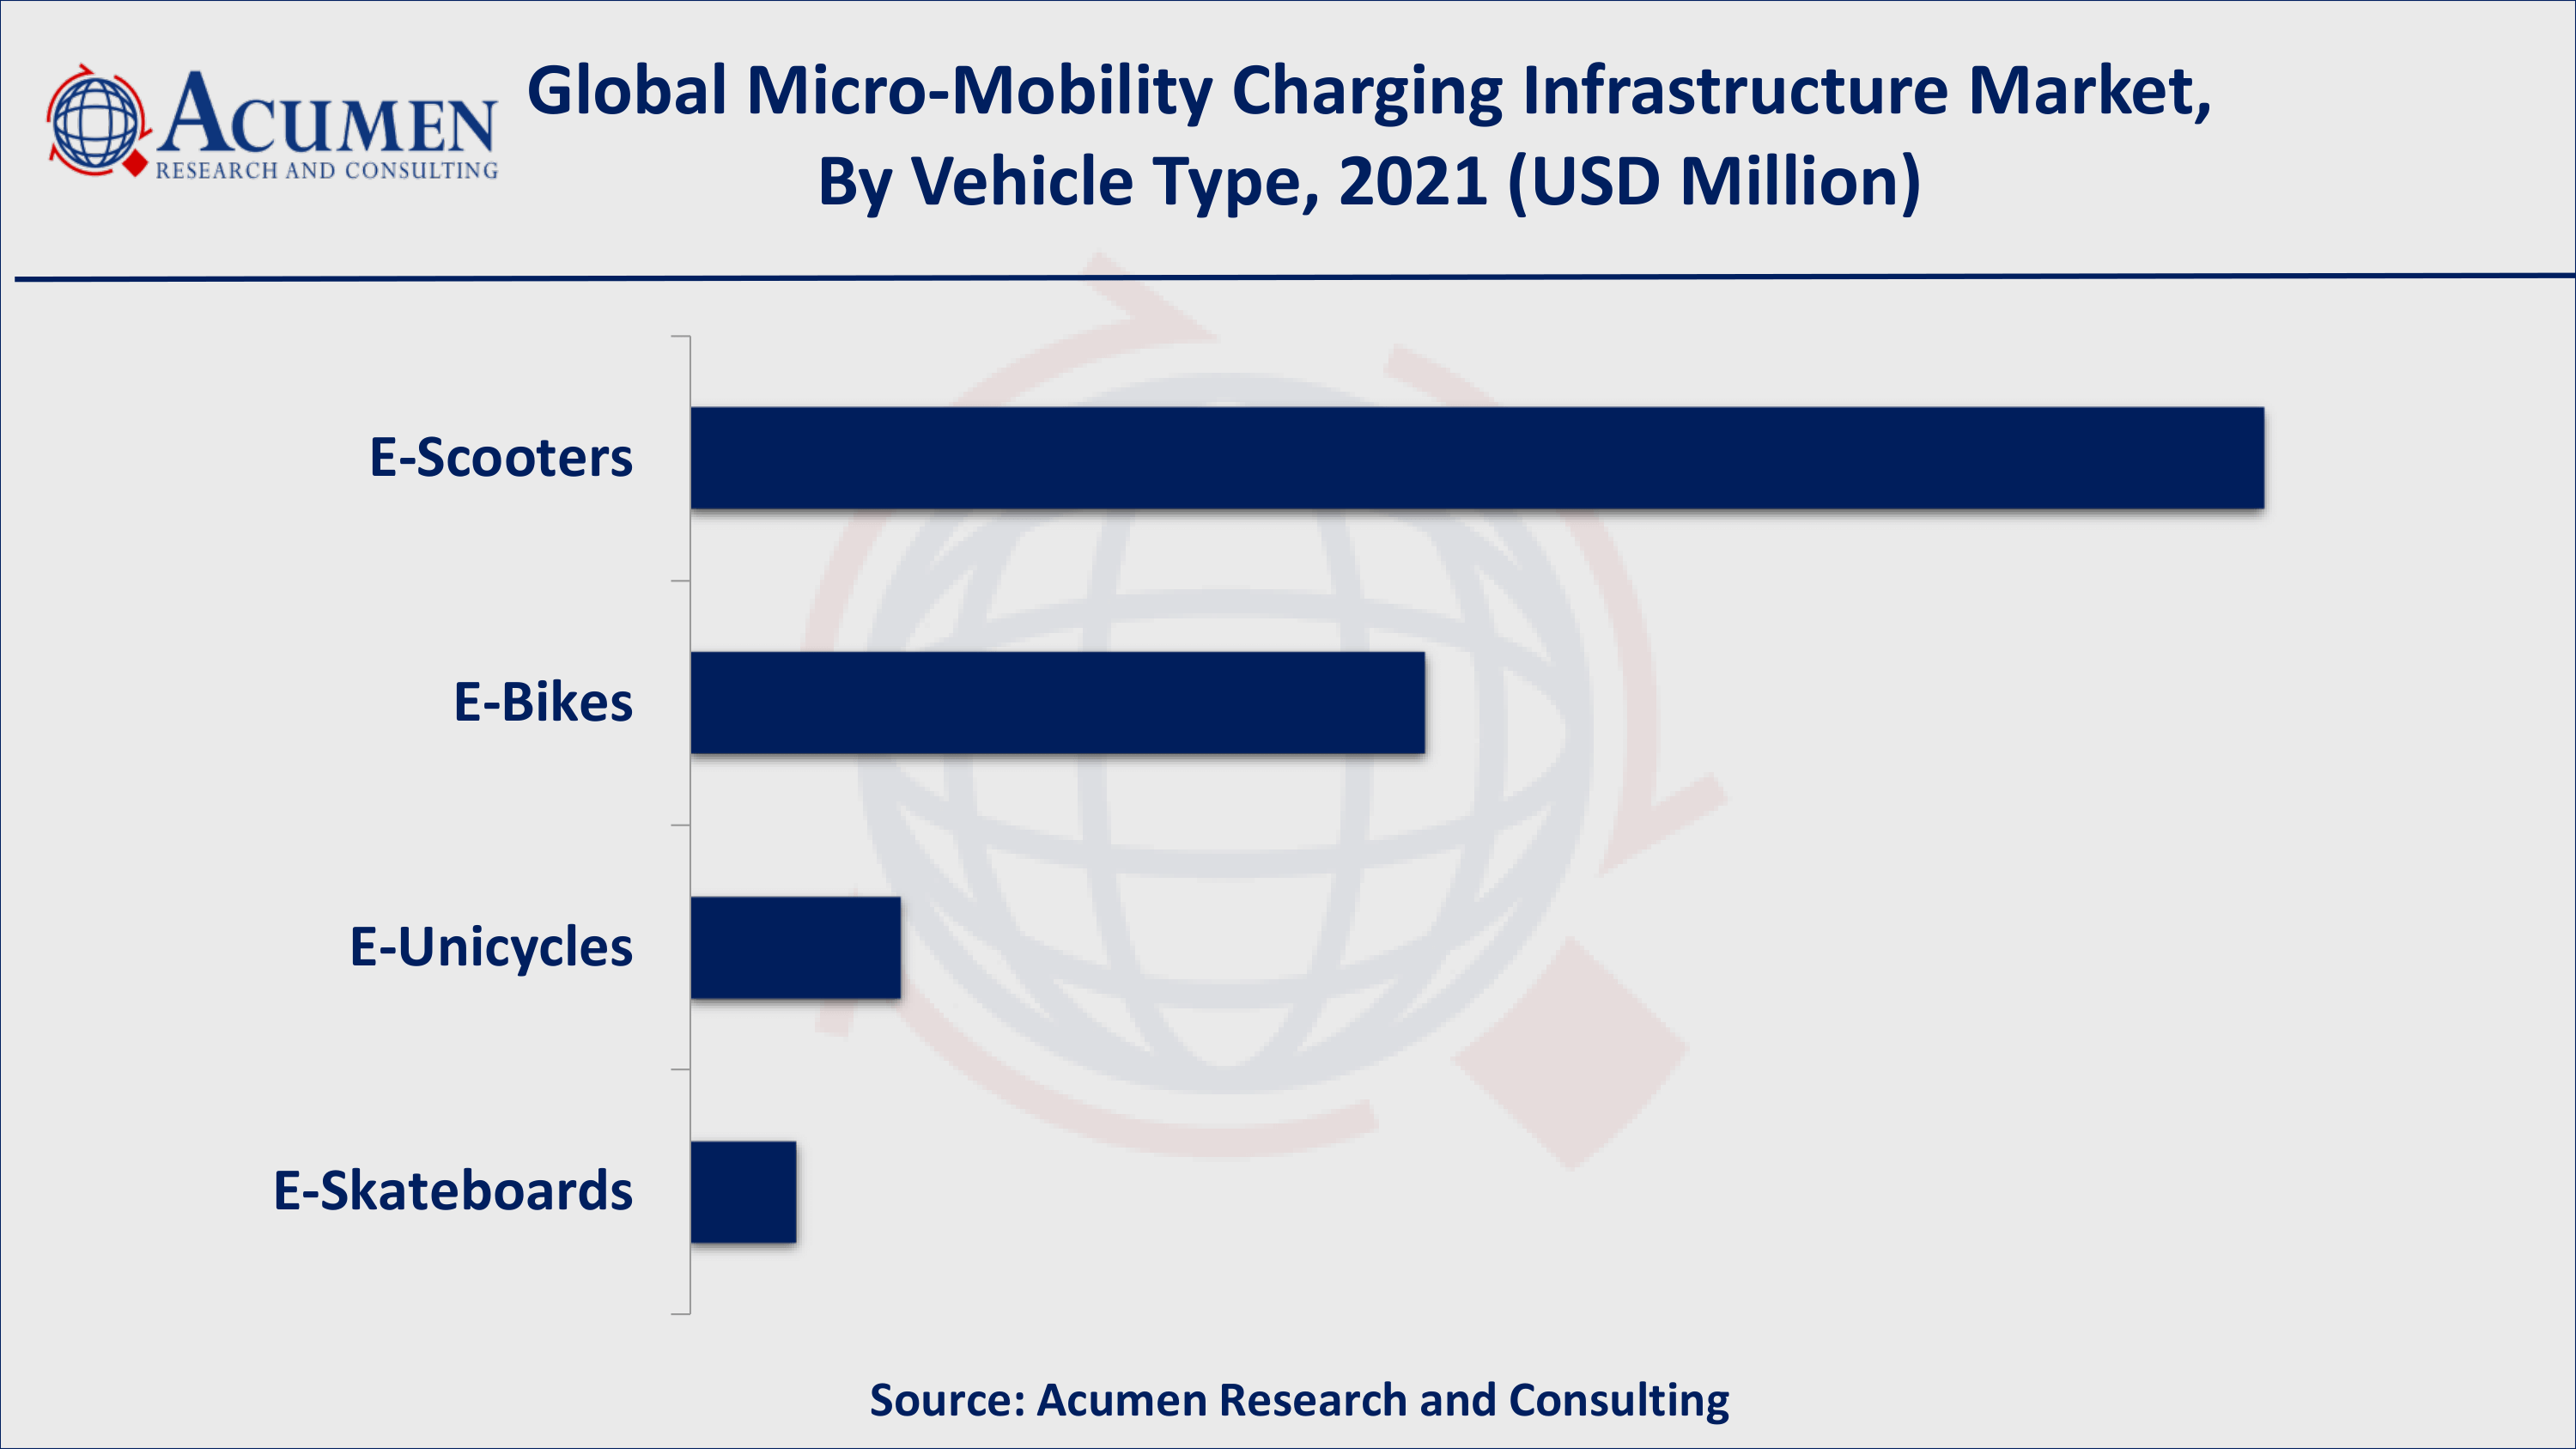
- Based on vehicle type, e-scooters over 60% of the overall market share in 2021
- Growing investment in micro-mobility will fuel the global micro-mobility charging infrastructure market value
- Increasing technological advancements in micro-mobility is a popular micro-mobility charging infrastructure market trend that is fueling the industry demand
Micro-Mobility Charging Infrastructure Market Trends
Big Calls for Solar Micro-Mobility Have Gained Significant Attention in the Worldwide Market
The development and implementation of solar charging stations for two-wheeler vehicles involving personal or shared e-bicycle or e-scooter services constitutes solar micro-mobility infrastructure. The Sol Design Lab's Electric Drive Solar Kiosk, for example, is an innovation and combination of solar technology, energy storage, public art, and civil place making. The solar-powered kiosk has charging stations for e-bikes, scooters, and wheelchairs, as well as mobile electronics. In addition, Austin Energy received US$1.6 million from the Texas Commission on Environmental Quality to expand their EV charging infrastructure in response to the success and popularity of the Electric Drive pilot program, which won the Austin Green Award in 2017. As a result, solar charging infrastructure has a significant impact on this new mode of transportation.
Global Micro-Mobility Charging Infrastructure Market Dynamics
Market Drivers
- Growing concern over green house emission
- Rising demand for electric vehicles
- Increasing number of e-scooters due to increased fuel prices
- Decreasing prices of batteries
Market Restraints
- Low awareness about shared mobility in developing countries
- Lack of strong policy framework
Market Opportunities
- Increased government subsidy for the use of electric mobility
- Rising number of charging infrastructures
Micro-Mobility Charging Infrastructure Market Report Coverage
Market |
Micro-Mobility Charging Infrastructure Market |
Micro-Mobility Charging Infrastructure Market Size 2021 |
USD 3.7 Billion |
Micro-Mobility Charging Infrastructure Market Forecast 2030 |
USD 22.5 Billion |
Micro-Mobility Charging Infrastructure Market CAGR During 2022 - 2030 |
22.4% |
Micro-Mobility Charging Infrastructure Market Analysis Period |
2018 - 2030 |
Micro-Mobility Charging Infrastructure Market Base Year |
2021 |
Micro-Mobility Charging Infrastructure Market Forecast Data |
2022 - 2030 |
Segments Covered |
By Vehicle Type, By Charger Type, By Power Source, By End-Use, And By Geography
|
Regional Scope |
North America, Europe, Asia Pacific, Latin America, and Middle East & Africa |
Key Companies Profiled |
Ather Energy, Robert Bosch GmbH, Bikeep, Bike-energy, Continental AG, Magment GmbH, Perch mobility, Solum PV, Electrify America, Ground Control Systems, Neuron Mobility, SWIFTMILE, and others. |
Report Coverage
|
Market Trends, Drivers, Restraints, Competitive Analysis, Player Profiling, Regulation Analysis |
Micro-Mobility Charging Infrastructure Market Growth Factors
Market Driver
High Adoption of Micro-Mobility Charging Infrastructure Controls Environmental Pollution Acts as a Cost Effective Technique
Micro-mobility charging infrastructure is becoming increasingly important in the global market. For example, Tier, a German micromobility operator, recently received a US$296.3 Mn investment from Softbank to establish an energy network. Charging infrastructure is a critical component in making micro mobility operations financially sustainable. Apart from that, most station providers have a proprietary connector that is added to the various vehicles, allowing them to be docked and charged in their network premises. This process is inconvenient and slows the expansion of the micro-mobility charging infrastructure network.
Different Charging Techniques Bolster the Growth of Global Micro-Mobility Charging Infrastructure Market
Improvements in charging techniques, such as wireless charging, reduce the number of refueling stops needed by electric vehicles (EV). Some of the major wireless charger manufacturers claimed to have achieved 94% efficiency. The charging time of an EV needed to be reduced for faster adoption of EVs, resulting in the development of fast acting chargers of around 350 KW. To accomplish this, the power handling capacity of batteries must be increased to allow for fast charging without reducing their life span. Furthermore, fast chargers should be made more affordable on the global market. Manufacturers are designing systems and parts for EVs that include liquid cooled charging inlets and couplers designed to extract waste heat through fast charging in order to meet such criteria as fast charging or large scale rapid charging infrastructure. Battery swapping is another option for reducing charging time, in which a new battery replaces a discharged one during installation.
High Government Involvement Stimulates the Growth of Global Micro-Mobility Infrastructure Market
According to a report released by Electric Autonomy Canada in April 2021, the government's investment in electric vehicle charging infrastructure to date totals US$376 Mn. These include US$226 Mn spent between December 2016 and 2020, as well as an additional US$150 Mn spent between December 2020 and December 2024. Furthermore, public charging necessitates greater investment in order for the global micro-mobility charging infrastructure market to expand. Furthermore, the study estimates that in order to achieve 100% passenger electric vehicle sales in the United States by 2035, the country will need to invest US$87 Bn in charging infrastructure between 2021 and 2030. Nearly 45% of these, or approximately US$39 Bn, should be sanctioned for public charging. As a result, the assessment recommends US$6.9 Bn in funding to successfully implement a charging network to support full electrification in the United States beginning in 2021.
COVID-19 Impact Analysis on Micro-Mobility Charging Infrastructure Market
According to a Catapult report, as lockdowns become easier, Chinese cities are shifting away from public transportation and toward private vehicles. 45% of those polled by Venson Automotive Solutions saw a significant improvement in air quality as a result of the lockdown, prompting them to consider purchasing an EV. In addition, 17% confirmed their intention to purchase an electric vehicle. As a result of the pandemic, there has been an increase in micro-mobility, which provides a unique solution to the first mile/last mile problem, particularly in rural areas that are underserved by public transportation. As a result of the past lockdown experience, micro-mobility charging infrastructure would benefit from building more micro-mobility friendly street infrastructure, as well as stimulus packages and investments triggering EV infrastructure as part of the recovery.
Micro-Mobility Charging Infrastructure Market Segmentation
The worldwide micro mobility charging infrastructure market is split based on vehicle type, charger type, power source, end-use, and geography.
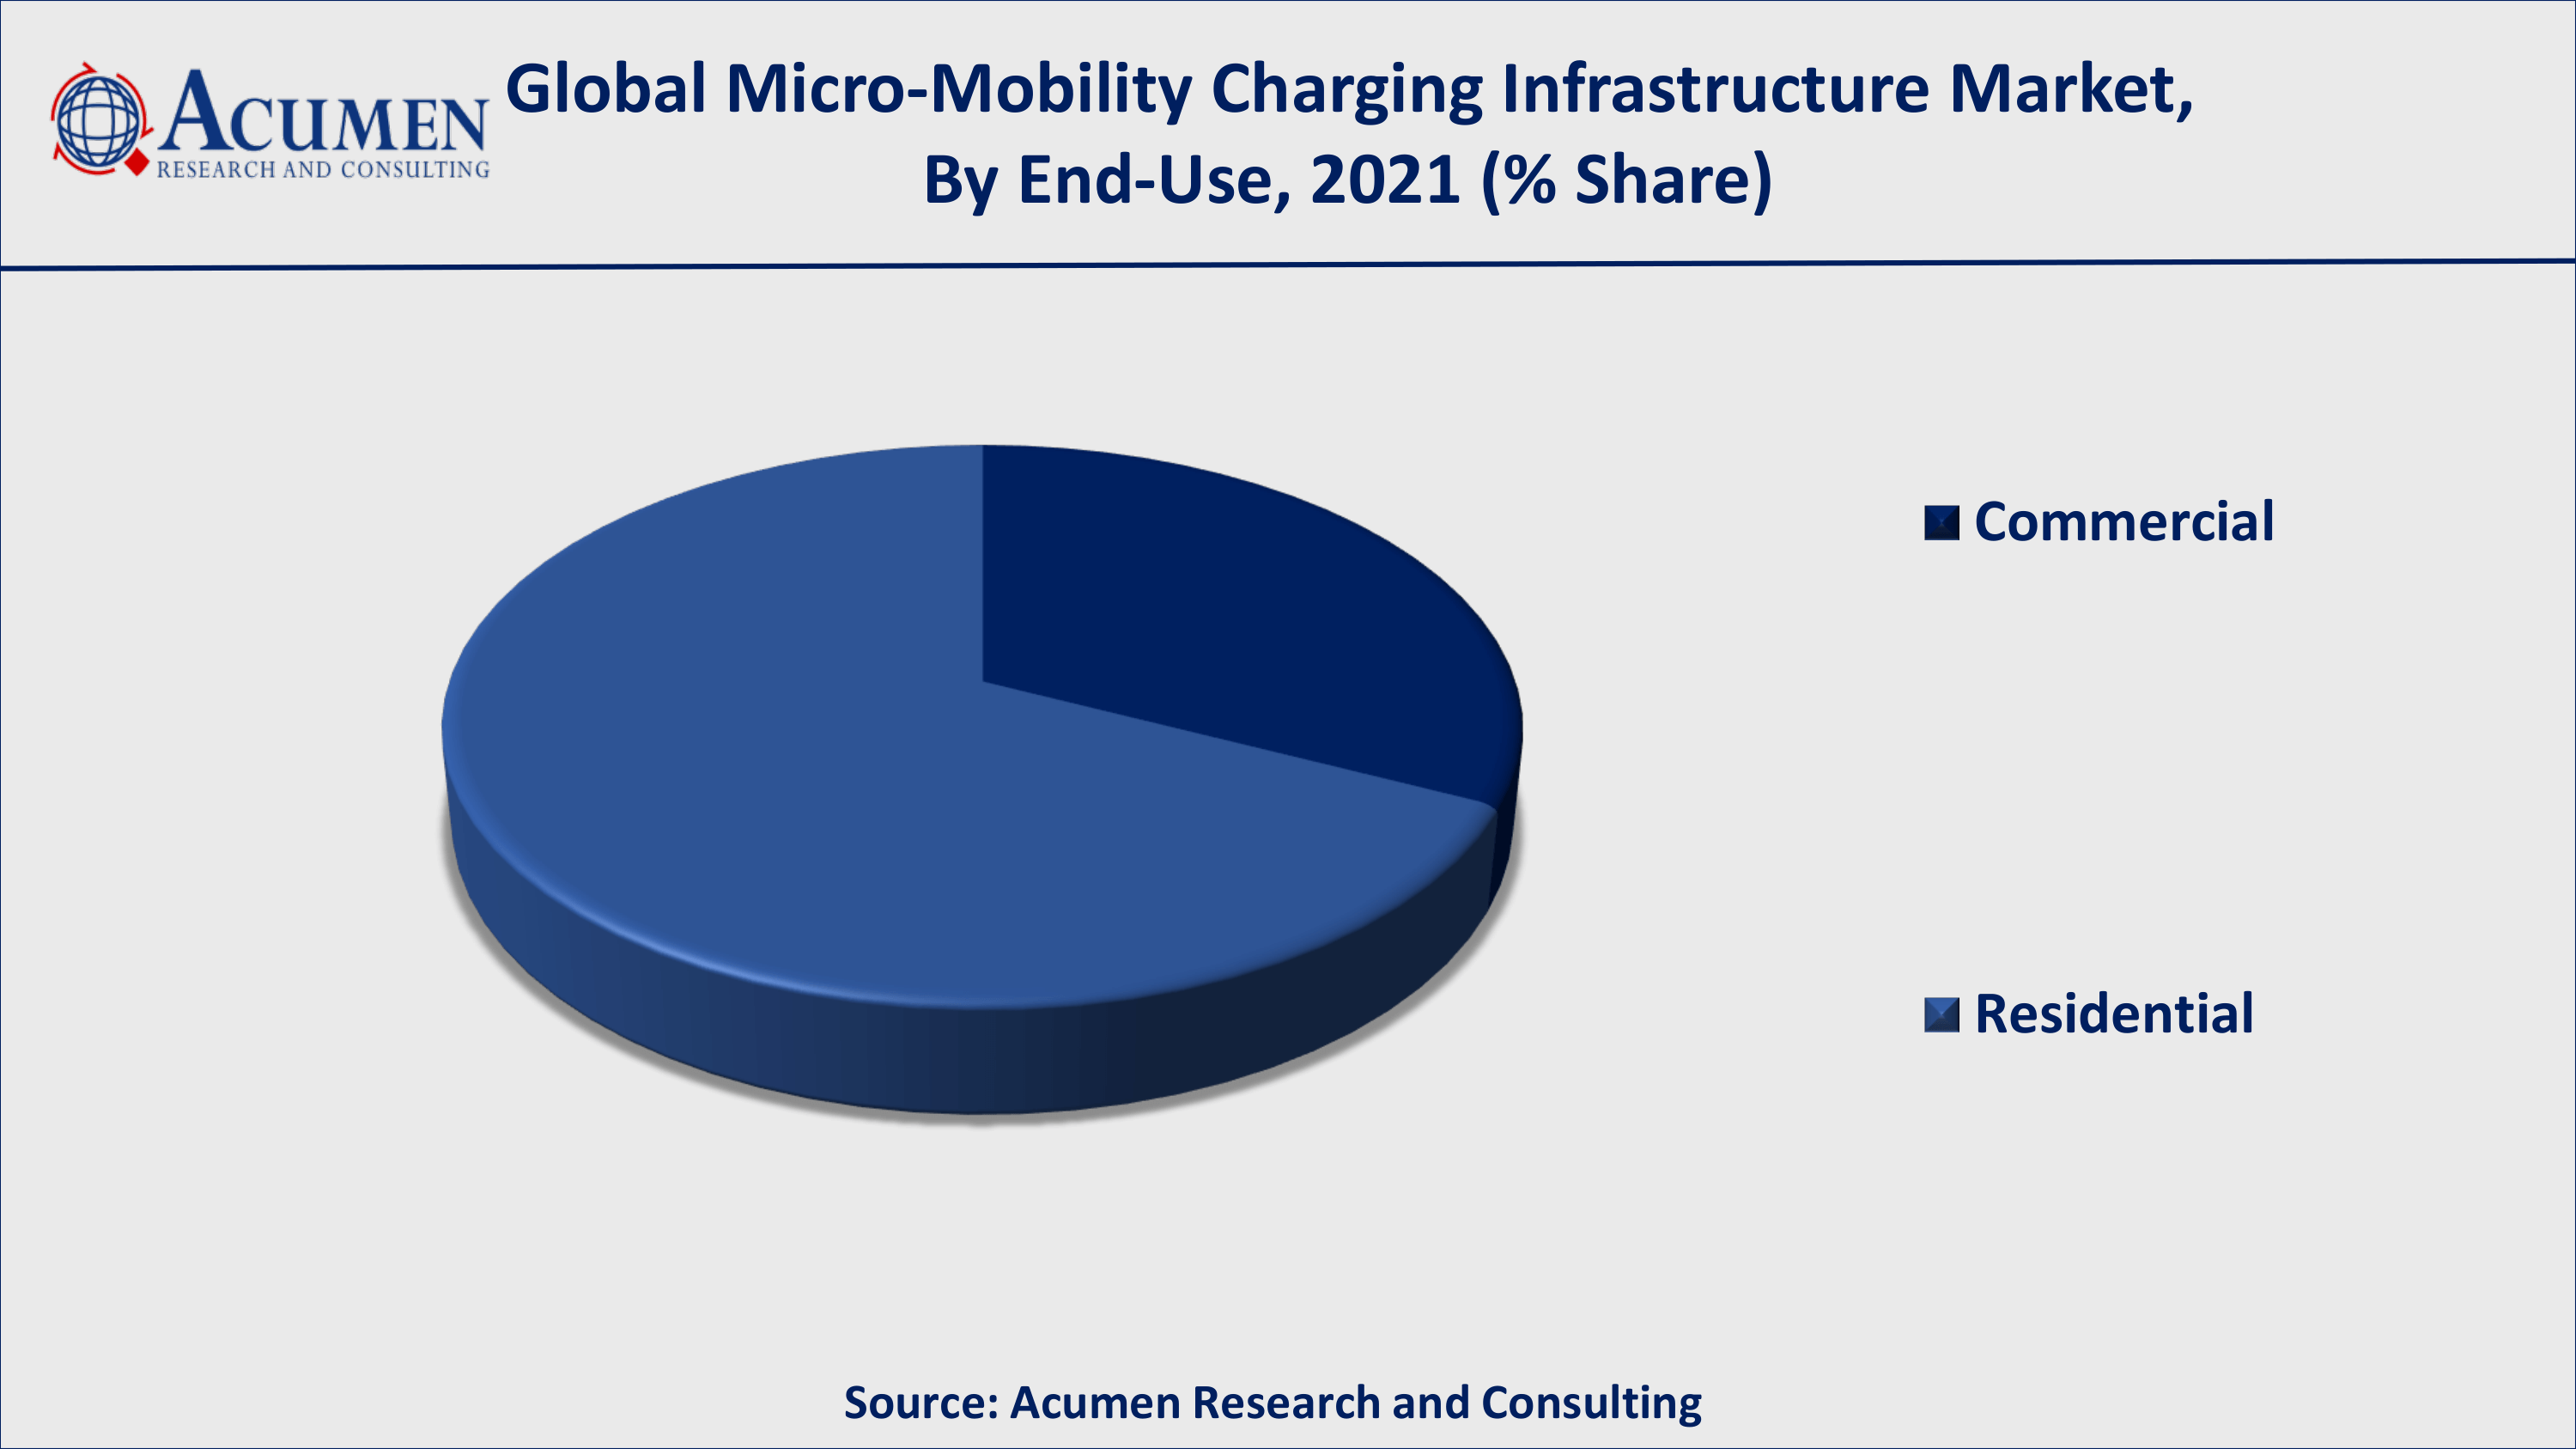
Based on vehicle type, the e-scooters segment will record reasonable market share for the micro-mobility charging infrastructure market. By charger type, the wired segment holds the dominating share for the micro-mobility charging infrastructure market. Based on power source, the battery-powered segment dominates the market by recording reasonable market share contributing for the growth of global micro-mobility charging infrastructure market. Furthermore, based on end-user, the residential segment contributes maximum for the growth of global micro-mobility charging infrastructure market by accounting reasonable share
Micro-Mobility Charging Infrastructure Market By Vehicle Type
- E-Scooters
- E-Bikes
- E-Unicycles
- E-skateboards
Micro-Mobility Charging Infrastructure Market By Charger Type
Micro-Mobility Charging Infrastructure Market By Power Source
- Solar Powered
- Battery Powered
Micro-Mobility Charging Infrastructure Market By End-Use
Micro-Mobility Charging Infrastructure Market Regional Outlook
North America
Europe
- U.K.
- Germany
- France
- Spain
- Rest of Europe
Asia-Pacific
- India
- Japan
- China
- Australia
- South Korea
- Rest of Asia-Pacific
Latin America
- Brazil
- Mexico
- Rest of Latin America
The Middle East & Africa
- South Africa
- GCC Countries
- Rest of the Middle East & Africa (ME&A)
Micro-Mobility Charging Infrastructure Market Regional Analysis
Asia-Pacific Dominates; North America Accounts For the Fastest Growing Regional Market for Micro-Mobility Charging Infrastructure Market
Asia-Pacific will dominate the market for micro-mobility charging infrastructure. This is due to the high level of interest among leading players or companies and startups in introducing newer micro-mobility projects in automotive. This is one of the most important factors driving the growth of the micro-mobility charging infrastructure market. For example, Neuron Mobility, a Singapore-based smart e-scooter startup, saw e-mobility as a lucrative opportunity for the country to remain competitive. Neuron Mobility, founded in 2016, has some of the industry's earliest patents on a smart scooter and intelligent charging solutions for the personal mobility space.
Micro-Mobility Charging Infrastructure Market Players
Some of the global micro-mobility charging infrastructure companies include Ather Energy, Robert Bosch GmbH, Bikeep, Bike-energy, Continental AG, Magment GmbH, Perch mobility, Solum PV, Electrify America, Ground Control Systems, Neuron Mobility, SWIFTMILE, and others.

CHAPTER 1. Industry Overview of Micro-Mobility Charging Infrastructure Market
1.1. Definition and Scope
1.1.1. Definition of Micro-Mobility Charging Infrastructure
1.1.2. Market Segmentation
1.1.3. Years Considered for the Study
1.1.4. Assumptions and Acronyms Used
1.1.4.1. Market Assumptions and Market Forecast
1.1.4.2. Acronyms Used in Global Micro-Mobility Charging Infrastructure Market
1.2. Summary
1.2.1. Executive Summary
1.2.2. Micro-Mobility Charging Infrastructure Market By Vehicle Type
1.2.3. Micro-Mobility Charging Infrastructure Market By Charger Type
1.2.4. Micro-Mobility Charging Infrastructure Market By Power Source
1.2.5. Micro-Mobility Charging Infrastructure Market By End-Use
1.2.6. Micro-Mobility Charging Infrastructure Market By Region
CHAPTER 2. Research Approach
2.1. Methodology
2.1.1. Research Programs
2.1.2. Market Size Estimation
2.1.3. Market Breakdown and Data Triangulation
2.2. Data Source
2.2.1. Secondary Sources
2.2.2. Primary Sources
CHAPTER 3. Market Dynamics And Competition Analysis
3.1. Market Drivers
3.1.1. Driver 1
3.1.2. Driver 2
3.2. Restraints and Challenges
3.2.1. Restraint 1
3.2.2. Restraint 2
3.3. Growth Opportunities
3.3.1. Opportunity 1
3.3.2. Opportunity 2
3.4. Porter’s Five Forces Analysis
3.4.1. Bargaining Power of Suppliers
3.4.2. Bargaining Power of Buyers
3.4.3. Threat of Substitute
3.4.4. Threat of New Entrants
3.4.5. Degree of Competition
3.5. Market Concentration Ratio and Market Maturity Analysis of Micro-Mobility Charging Infrastructure Market
3.5.1. Go To Market Strategy
3.5.1.1. Introduction
3.5.1.2. Growth
3.5.1.3. Maturity
3.5.1.4. Saturation
3.5.1.5. Possible Development
3.6. Technological Roadmap for Micro-Mobility Charging Infrastructure Market
3.7. Value Chain Analysis
3.7.1. List of Key Manufacturers
3.7.2. List of Customers
3.7.3. Level of Integration
3.8. Regulatory Compliance
3.9. Competitive Landscape, 2021
3.9.1. Player Positioning Analysis
3.9.2. Key Strategies Adopted By Leading Players
CHAPTER 4. Micro-Mobility Charging Infrastructure Market By Vehicle Type
4.1. Introduction
4.2. Micro-Mobility Charging Infrastructure Revenue By Vehicle Type
4.2.1. Micro-Mobility Charging Infrastructure Revenue (USD Million) and Forecast, By Vehicle Type, 2018-2030
4.2.2. E-Scooters
4.2.2.1. E-Scooters Market Revenue (USD Million) and Growth Rate (%), 2018-2030
4.2.3. E-Bikes
4.2.3.1. E-Bikes Market Revenue (USD Million) and Growth Rate (%), 2018-2030
4.2.4. E-Unicycles
4.2.4.1. E-Unicycles Market Revenue (USD Million) and Growth Rate (%), 2018-2030
4.2.5. E-Skateboards
4.2.5.1. E-Skateboards Market Revenue (USD Million) and Growth Rate (%), 2018-2030
CHAPTER 5. Micro-Mobility Charging Infrastructure Market By Charger Type
5.1. Introduction
5.2. Micro-Mobility Charging Infrastructure Revenue By Charger Type
5.2.1. Micro-Mobility Charging Infrastructure Revenue (USD Million) and Forecast, By Charger Type, 2018-2030
5.2.2. Wired
5.2.2.1. Wired Market Revenue (USD Million) and Growth Rate (%), 2018-2030
5.2.3. Wireless
5.2.3.1. Wireless Market Revenue (USD Million) and Growth Rate (%), 2018-2030
CHAPTER 6. Micro-Mobility Charging Infrastructure Market By Power Source
6.1. Introduction
6.2. Micro-Mobility Charging Infrastructure Revenue By Power Source
6.2.1. Micro-Mobility Charging Infrastructure Revenue (USD Million) and Forecast, By Power Source, 2018-2030
6.2.2. Solar Powered
6.2.2.1. Solar Powered Market Revenue (USD Million) and Growth Rate (%), 2018-2030
6.2.3. Battery Powered
6.2.3.1. Battery Powered Market Revenue (USD Million) and Growth Rate (%), 2018-2030
CHAPTER 7. Micro-Mobility Charging Infrastructure Market By End-Use
7.1. Introduction
7.2. Micro-Mobility Charging Infrastructure Revenue By End-Use
7.2.1. Micro-Mobility Charging Infrastructure Revenue (USD Million) and Forecast, By End-Use, 2018-2030
7.2.2. Commercial
7.2.2.1. Commercial Market Revenue (USD Million) and Growth Rate (%), 2018-2030
7.2.3. Residential
7.2.3.1. Residential Market Revenue (USD Million) and Growth Rate (%), 2018-2030
CHAPTER 8. North America Micro-Mobility Charging Infrastructure Market By Country
8.1. North America Micro-Mobility Charging Infrastructure Market Overview
8.2. U.S.
8.2.1. U.S. Micro-Mobility Charging Infrastructure Revenue (USD Million) and Forecast By Vehicle Type, 2018-2030
8.2.2. U.S. Micro-Mobility Charging Infrastructure Revenue (USD Million) and Forecast By Charger Type, 2018-2030
8.2.3. U.S. Micro-Mobility Charging Infrastructure Revenue (USD Million) and Forecast By Power Source, 2018-2030
8.2.4. U.S. Micro-Mobility Charging Infrastructure Revenue (USD Million) and Forecast By End-Use, 2018-2030
8.3. Canada
8.3.1. Canada Micro-Mobility Charging Infrastructure Revenue (USD Million) and Forecast By Vehicle Type, 2018-2030
8.3.2. Canada Micro-Mobility Charging Infrastructure Revenue (USD Million) and Forecast By Charger Type, 2018-2030
8.3.3. Canada Micro-Mobility Charging Infrastructure Revenue (USD Million) and Forecast By Power Source, 2018-2030
8.3.4. Canada Micro-Mobility Charging Infrastructure Revenue (USD Million) and Forecast By End-Use, 2018-2030
8.4. North America PEST Analysis
CHAPTER 9. Europe Micro-Mobility Charging Infrastructure Market By Country
9.1. Europe Micro-Mobility Charging Infrastructure Market Overview
9.2. U.K.
9.2.1. U.K. Micro-Mobility Charging Infrastructure Revenue (USD Million) and Forecast By Vehicle Type, 2018-2030
9.2.2. U.K. Micro-Mobility Charging Infrastructure Revenue (USD Million) and Forecast By Charger Type, 2018-2030
9.2.3. U.K. Micro-Mobility Charging Infrastructure Revenue (USD Million) and Forecast By Power Source, 2018-2030
9.2.4. U.K. Micro-Mobility Charging Infrastructure Revenue (USD Million) and Forecast By End-Use, 2018-2030
9.3. Germany
9.3.1. Germany Micro-Mobility Charging Infrastructure Revenue (USD Million) and Forecast By Vehicle Type, 2018-2030
9.3.2. Germany Micro-Mobility Charging Infrastructure Revenue (USD Million) and Forecast By Charger Type, 2018-2030
9.3.3. Germany Micro-Mobility Charging Infrastructure Revenue (USD Million) and Forecast By Power Source, 2018-2030
9.3.4. Germany Micro-Mobility Charging Infrastructure Revenue (USD Million) and Forecast By End-Use, 2018-2030
9.4. France
9.4.1. France Micro-Mobility Charging Infrastructure Revenue (USD Million) and Forecast By Vehicle Type, 2018-2030
9.4.2. France Micro-Mobility Charging Infrastructure Revenue (USD Million) and Forecast By Charger Type, 2018-2030
9.4.3. France Micro-Mobility Charging Infrastructure Revenue (USD Million) and Forecast By Power Source, 2018-2030
9.4.4. France Micro-Mobility Charging Infrastructure Revenue (USD Million) and Forecast By End-Use, 2018-2030
9.5. Spain
9.5.1. Spain Micro-Mobility Charging Infrastructure Revenue (USD Million) and Forecast By Vehicle Type, 2018-2030
9.5.2. Spain Micro-Mobility Charging Infrastructure Revenue (USD Million) and Forecast By Charger Type, 2018-2030
9.5.3. Spain Micro-Mobility Charging Infrastructure Revenue (USD Million) and Forecast By Power Source, 2018-2030
9.5.4. Spain Micro-Mobility Charging Infrastructure Revenue (USD Million) and Forecast By End-Use, 2018-2030
9.6. Rest of Europe
9.6.1. Rest of Europe Micro-Mobility Charging Infrastructure Revenue (USD Million) and Forecast By Vehicle Type, 2018-2030
9.6.2. Rest of Europe Micro-Mobility Charging Infrastructure Revenue (USD Million) and Forecast By Charger Type, 2018-2030
9.6.3. Rest of Europe Micro-Mobility Charging Infrastructure Revenue (USD Million) and Forecast By Power Source, 2018-2030
9.6.4. Rest of Europe Micro-Mobility Charging Infrastructure Revenue (USD Million) and Forecast By End-Use, 2018-2030
9.7. Europe PEST Analysis
CHAPTER 10. Asia Pacific Micro-Mobility Charging Infrastructure Market By Country
10.1. Asia Pacific Micro-Mobility Charging Infrastructure Market Overview
10.2. China
10.2.1. China Micro-Mobility Charging Infrastructure Revenue (USD Million) and Forecast By Vehicle Type, 2018-2030
10.2.2. China Micro-Mobility Charging Infrastructure Revenue (USD Million) and Forecast By Charger Type, 2018-2030
10.2.3. China Micro-Mobility Charging Infrastructure Revenue (USD Million) and Forecast By Power Source, 2018-2030
10.2.4. China Micro-Mobility Charging Infrastructure Revenue (USD Million) and Forecast By End-Use, 2018-2030
10.3. Japan
10.3.1. Japan Micro-Mobility Charging Infrastructure Revenue (USD Million) and Forecast By Vehicle Type, 2018-2030
10.3.2. Japan Micro-Mobility Charging Infrastructure Revenue (USD Million) and Forecast By Charger Type, 2018-2030
10.3.3. Japan Micro-Mobility Charging Infrastructure Revenue (USD Million) and Forecast By Power Source, 2018-2030
10.3.4. Japan Micro-Mobility Charging Infrastructure Revenue (USD Million) and Forecast By End-Use, 2018-2030
10.4. India
10.4.1. India Micro-Mobility Charging Infrastructure Revenue (USD Million) and Forecast By Vehicle Type, 2018-2030
10.4.2. India Micro-Mobility Charging Infrastructure Revenue (USD Million) and Forecast By Charger Type, 2018-2030
10.4.3. India Micro-Mobility Charging Infrastructure Revenue (USD Million) and Forecast By Power Source, 2018-2030
10.4.4. India Micro-Mobility Charging Infrastructure Revenue (USD Million) and Forecast By End-Use, 2018-2030
10.5. Australia
10.5.1. Australia Micro-Mobility Charging Infrastructure Revenue (USD Million) and Forecast By Vehicle Type, 2018-2030
10.5.2. Australia Micro-Mobility Charging Infrastructure Revenue (USD Million) and Forecast By Charger Type, 2018-2030
10.5.3. Australia Micro-Mobility Charging Infrastructure Revenue (USD Million) and Forecast By Power Source, 2018-2030
10.5.4. Australia Micro-Mobility Charging Infrastructure Revenue (USD Million) and Forecast By, 2018-2030
10.6. South Korea
10.6.1. South Korea Micro-Mobility Charging Infrastructure Revenue (USD Million) and Forecast By Vehicle Type, 2018-2030
10.6.2. South Korea Micro-Mobility Charging Infrastructure Revenue (USD Million) and Forecast By Charger Type, 2018-2030
10.6.3. South Korea Micro-Mobility Charging Infrastructure Revenue (USD Million) and Forecast By Power Source, 2018-2030
10.6.4. South Korea Micro-Mobility Charging Infrastructure Revenue (USD Million) and Forecast By End-Use, 2018-2030
10.7. Rest of Asia-Pacific
10.7.1. Rest of Asia-Pacific Micro-Mobility Charging Infrastructure Revenue (USD Million) and Forecast By Vehicle Type, 2018-2030
10.7.2. Rest of Asia-Pacific Micro-Mobility Charging Infrastructure Revenue (USD Million) and Forecast By Charger Type, 2018-2030
10.7.3. Rest of Asia-Pacific Micro-Mobility Charging Infrastructure Revenue (USD Million) and Forecast By Power Source, 2018-2030
10.7.4. Rest of Asia-Pacific Micro-Mobility Charging Infrastructure Revenue (USD Million) and Forecast By End-Use, 2018-2030
10.8. Asia Pacific PEST Analysis
CHAPTER 11. Latin America Micro-Mobility Charging Infrastructure Market By Country
11.1. Latin America Micro-Mobility Charging Infrastructure Market Overview
11.2. Brazil
11.2.1. Brazil Micro-Mobility Charging Infrastructure Revenue (USD Million) and Forecast By Vehicle Type, 2018-2030
11.2.2. Brazil Micro-Mobility Charging Infrastructure Revenue (USD Million) and Forecast By Charger Type, 2018-2030
11.2.3. Brazil Micro-Mobility Charging Infrastructure Revenue (USD Million) and Forecast By Power Source, 2018-2030
11.2.4. Brazil Micro-Mobility Charging Infrastructure Revenue (USD Million) and Forecast By End-Use, 2018-2030
11.3. Mexico
11.3.1. Mexico Micro-Mobility Charging Infrastructure Revenue (USD Million) and Forecast By Vehicle Type, 2018-2030
11.3.2. Mexico Micro-Mobility Charging Infrastructure Revenue (USD Million) and Forecast By Charger Type, 2018-2030
11.3.3. Mexico Micro-Mobility Charging Infrastructure Revenue (USD Million) and Forecast By Power Source, 2018-2030
11.3.4. Mexico Micro-Mobility Charging Infrastructure Revenue (USD Million) and Forecast By End-Use, 2018-2030
11.4. Rest of Latin America
11.4.1. Rest of Latin America Micro-Mobility Charging Infrastructure Revenue (USD Million) and Forecast By Vehicle Type, 2018-2030
11.4.2. Rest of Latin America Micro-Mobility Charging Infrastructure Revenue (USD Million) and Forecast By Charger Type, 2018-2030
11.4.3. Rest of Latin America Micro-Mobility Charging Infrastructure Revenue (USD Million) and Forecast By Power Source, 2018-2030
11.4.4. Rest of Latin America Micro-Mobility Charging Infrastructure Revenue (USD Million) and Forecast By End-Use, 2018-2030
11.5. Latin America PEST Analysis
CHAPTER 12. Middle East & Africa Micro-Mobility Charging Infrastructure Market By Country
12.1. Middle East & Africa Micro-Mobility Charging Infrastructure Market Overview
12.2. GCC
12.2.1. GCC Micro-Mobility Charging Infrastructure Revenue (USD Million) and Forecast By Vehicle Type, 2018-2030
12.2.2. GCC Micro-Mobility Charging Infrastructure Revenue (USD Million) and Forecast By Charger Type, 2018-2030
12.2.3. GCC Micro-Mobility Charging Infrastructure Revenue (USD Million) and Forecast By Power Source, 2018-2030
12.2.4. GCC Micro-Mobility Charging Infrastructure Revenue (USD Million) and Forecast By End-Use, 2018-2030
12.3. South Africa
12.3.1. South Africa Micro-Mobility Charging Infrastructure Revenue (USD Million) and Forecast By Vehicle Type, 2018-2030
12.3.2. South Africa Micro-Mobility Charging Infrastructure Revenue (USD Million) and Forecast By Charger Type, 2018-2030
12.3.3. South Africa Micro-Mobility Charging Infrastructure Revenue (USD Million) and Forecast By Power Source, 2018-2030
12.3.4. South Africa Micro-Mobility Charging Infrastructure Revenue (USD Million) and Forecast By End-Use, 2018-2030
12.4. Rest of Middle East & Africa
12.4.1. Rest of Middle East & Africa Micro-Mobility Charging Infrastructure Revenue (USD Million) and Forecast By Vehicle Type, 2018-2030
12.4.2. Rest of Middle East & Africa Micro-Mobility Charging Infrastructure Revenue (USD Million) and Forecast By Charger Type, 2018-2030
12.4.3. Rest of Middle East & Africa Micro-Mobility Charging Infrastructure Revenue (USD Million) and Forecast By Power Source, 2018-2030
12.4.4. Rest of Middle East & Africa Micro-Mobility Charging Infrastructure Revenue (USD Million) and Forecast By End-Use, 2018-2030
12.5. Middle East & Africa PEST Analysis
CHAPTER 13. Player Analysis Of Micro-Mobility Charging Infrastructure Market
13.1. Micro-Mobility Charging Infrastructure Market Company Share Analysis
13.2. Competition Matrix
13.2.1. Competitive Benchmarking of key players by price, presence, market share, and R&D investment
13.2.2. New Product Launches and Product Enhancements
13.2.3. Mergers And Acquisition In Global Micro-Mobility Charging Infrastructure Market
13.2.4. Partnership, Joint Ventures and Strategic Alliances/ Sales Agreements
CHAPTER 14. Company Profile
14.1. Ather Energy
14.1.1. Company Snapshot
14.1.2. Business Overview
14.1.3. Financial Overview
14.1.3.1. Revenue (USD Million), 2021
14.1.3.2. Ather Energy 2021 Micro-Mobility Charging Infrastructure Business Regional Distribution
14.1.4. Product /Service and Specification
14.1.5. Recent Developments & Business Strategy
14.2. Robert Bosch GmbH
14.3. Bikeep
14.4. Bike-energy
14.5. Continental AG
14.6. Magment GmbH
14.7. Perch mobility
14.8. Solum PV
14.9. Electrify America
14.10. Ground Control Systems
14.11. Neuron Mobility
14.12. SWIFTMILE