Electric Vehicle Charging Infrastructure Market Size - Global Industry, Share, Analysis, Trends and Forecast 2022 � 2030
Published :
Report ID:
Pages :
Format :
Electric Vehicle Charging Infrastructure Market Size - Global Industry, Share, Analysis, Trends and Forecast 2022 � 2030
Report Coverage
- Industry Dynamics
- Market Size and Forecast Data
- Segment Analysis
- Competitive Landscape
- Regional Analysis with a Niche Focus on Country-Level Data
- High Level Analysis - Porter's, PESTEL, Value Chain, etc.
- Company Profiles of Key Players
- Option to Customize the Report As Per Your Specific Need
Request Sample Report
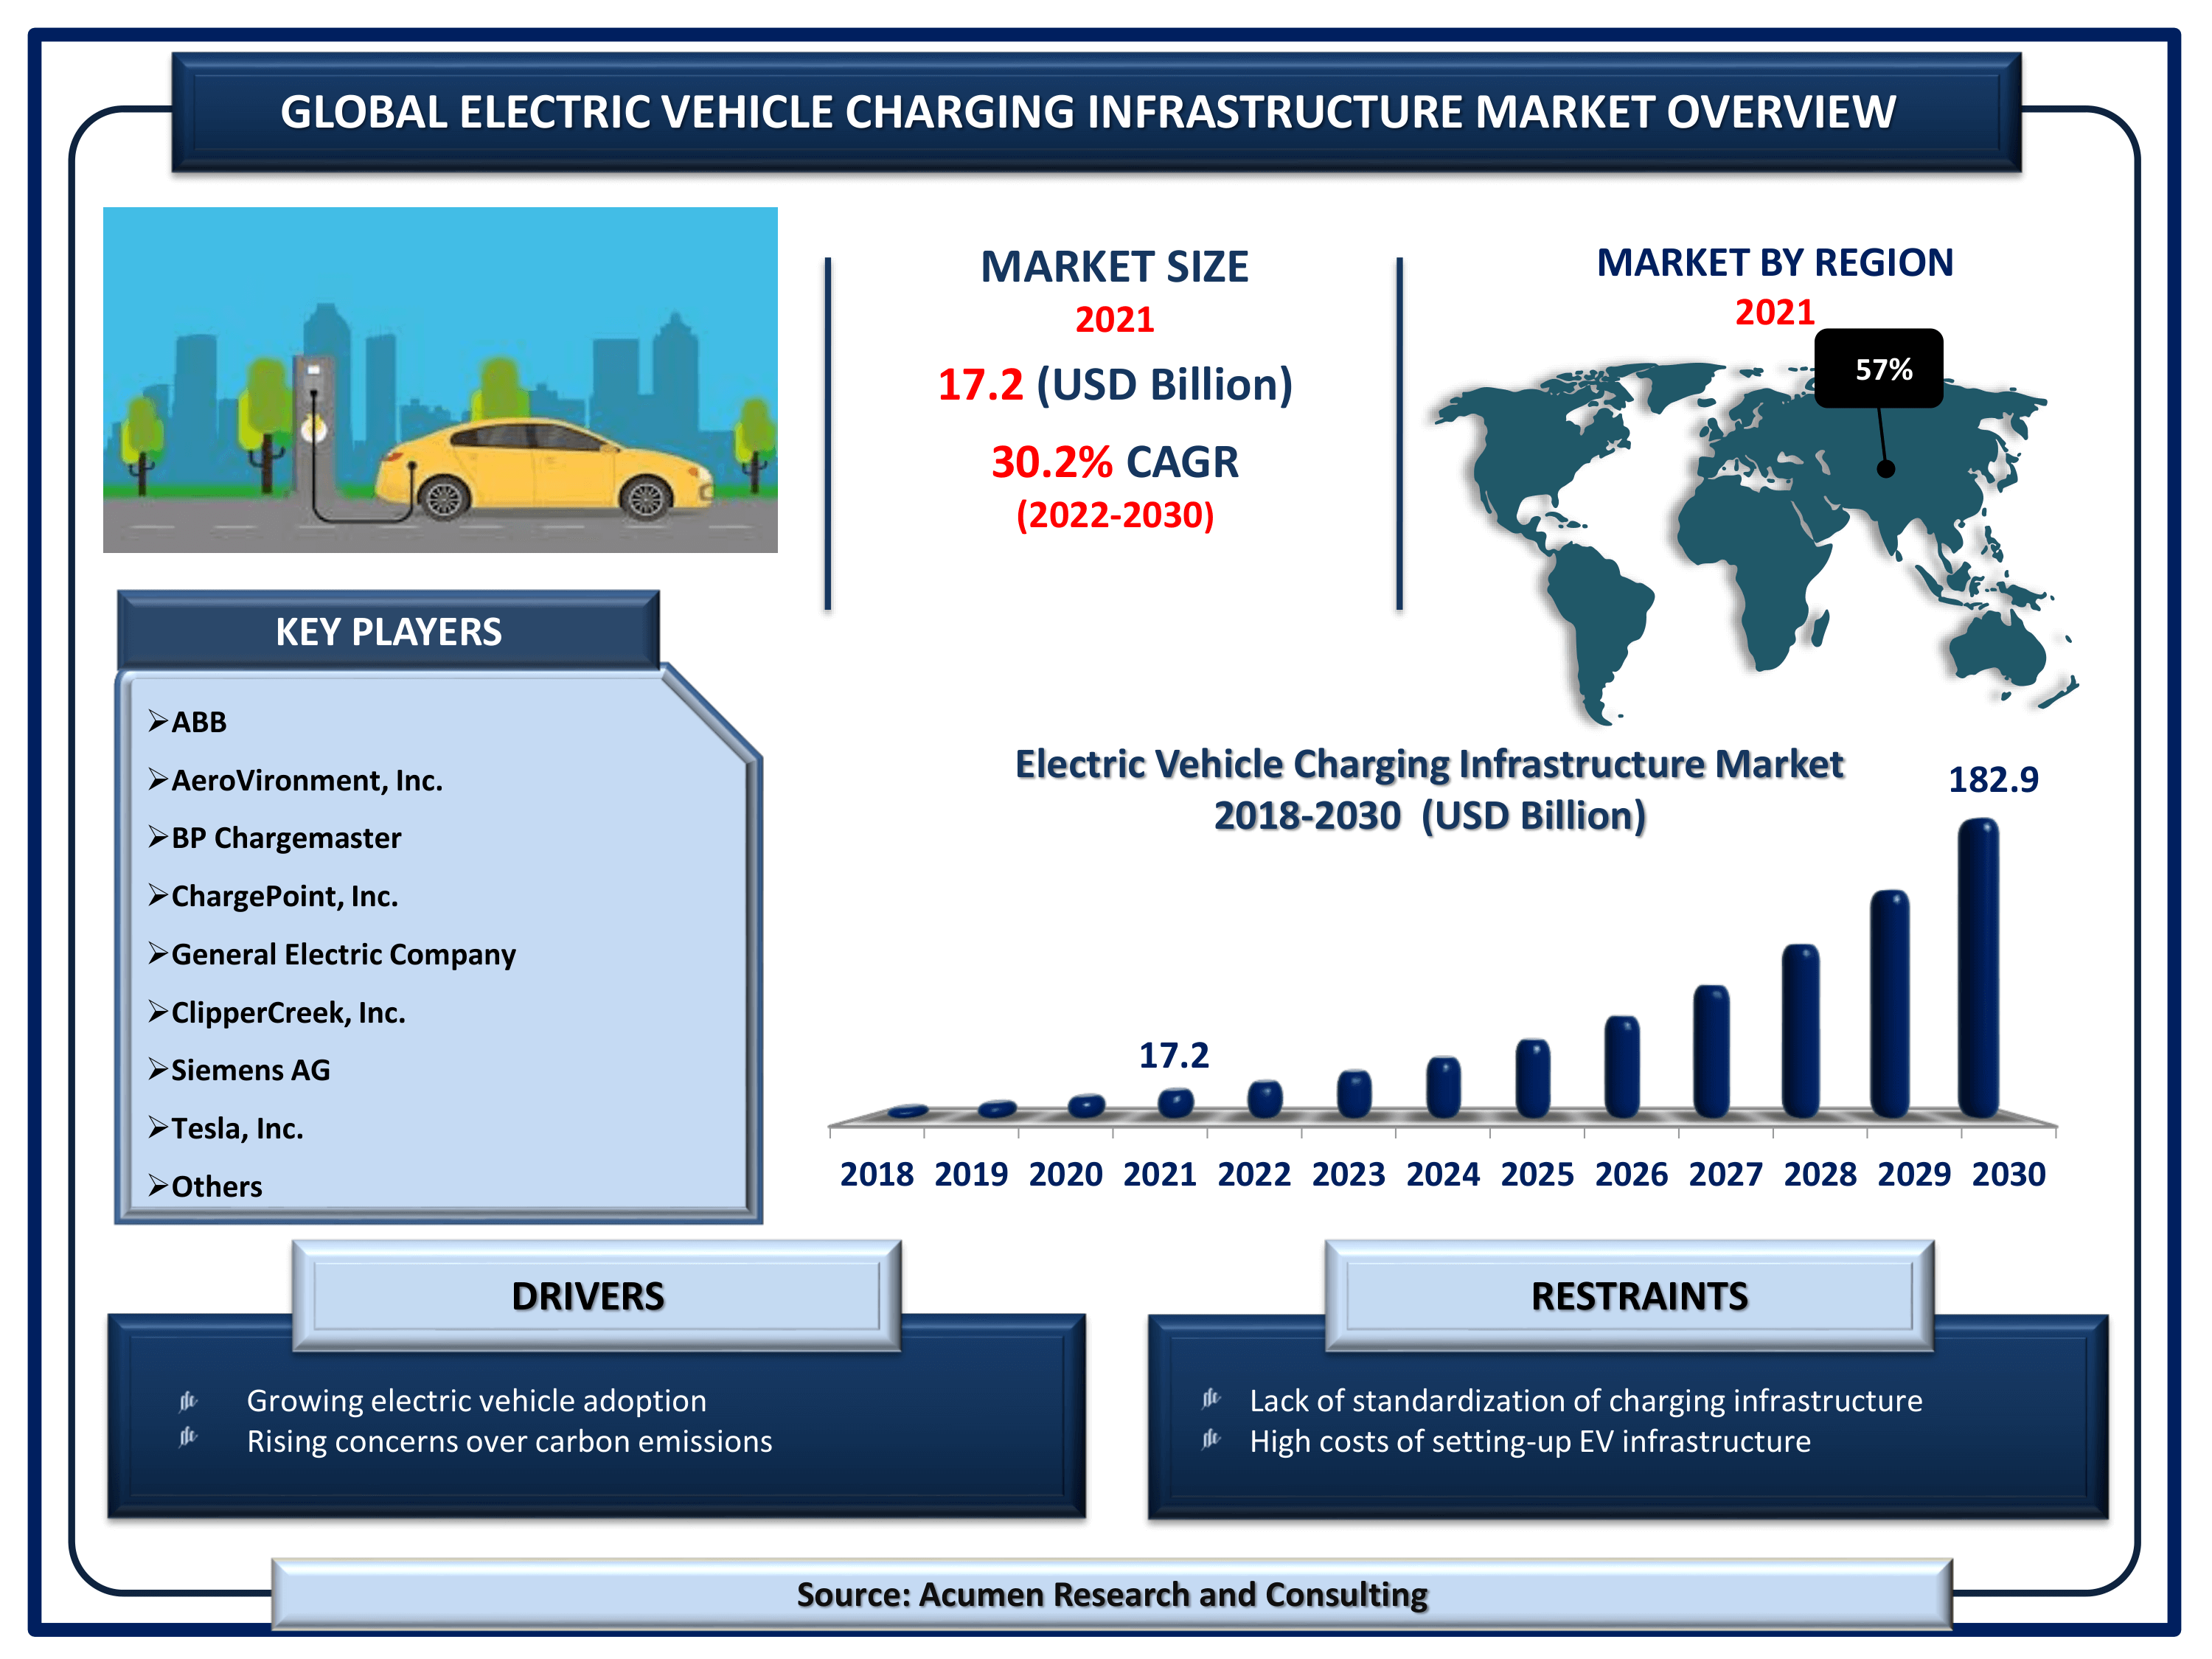
The Global Electric Vehicle Charging Infrastructure Market Size accounted for USD 17.2 Billion in 2021 and is projected to achieve a market size of USD 182.9 Billion by 2030 rising at a CAGR of 30.2% from 2022 to 2030. Rapidly rising sales of electric vehicles around the world is the leading aspect that is driving the global electric vehicle charging infrastructure market share. Additionally, the increasing adoption of IoT and smart infrastructure for load management is a popular electric vehicle charging station market trend that is expected to attain the fastest growth rate in the coming years.

Electric Vehicle (EV) Charging Infrastructure Market Report Statistics
- Global electric vehicle charging infrastructure market revenue is estimated to reach USD 182.9 Billion by 2030 with a CAGR of 30.2% from 2022 to 2030
- Asia-Pacific electric vehicle charging infrastructure market share accounted for over 57% shares in 2021
- According to a recent statistics, electric vehicles sales in China is projected to hit a record 6 million by 2022
- Asia-Pacific electric vehicle charging infrastructure market growth will record considerable CAGR from 2022 to 2030
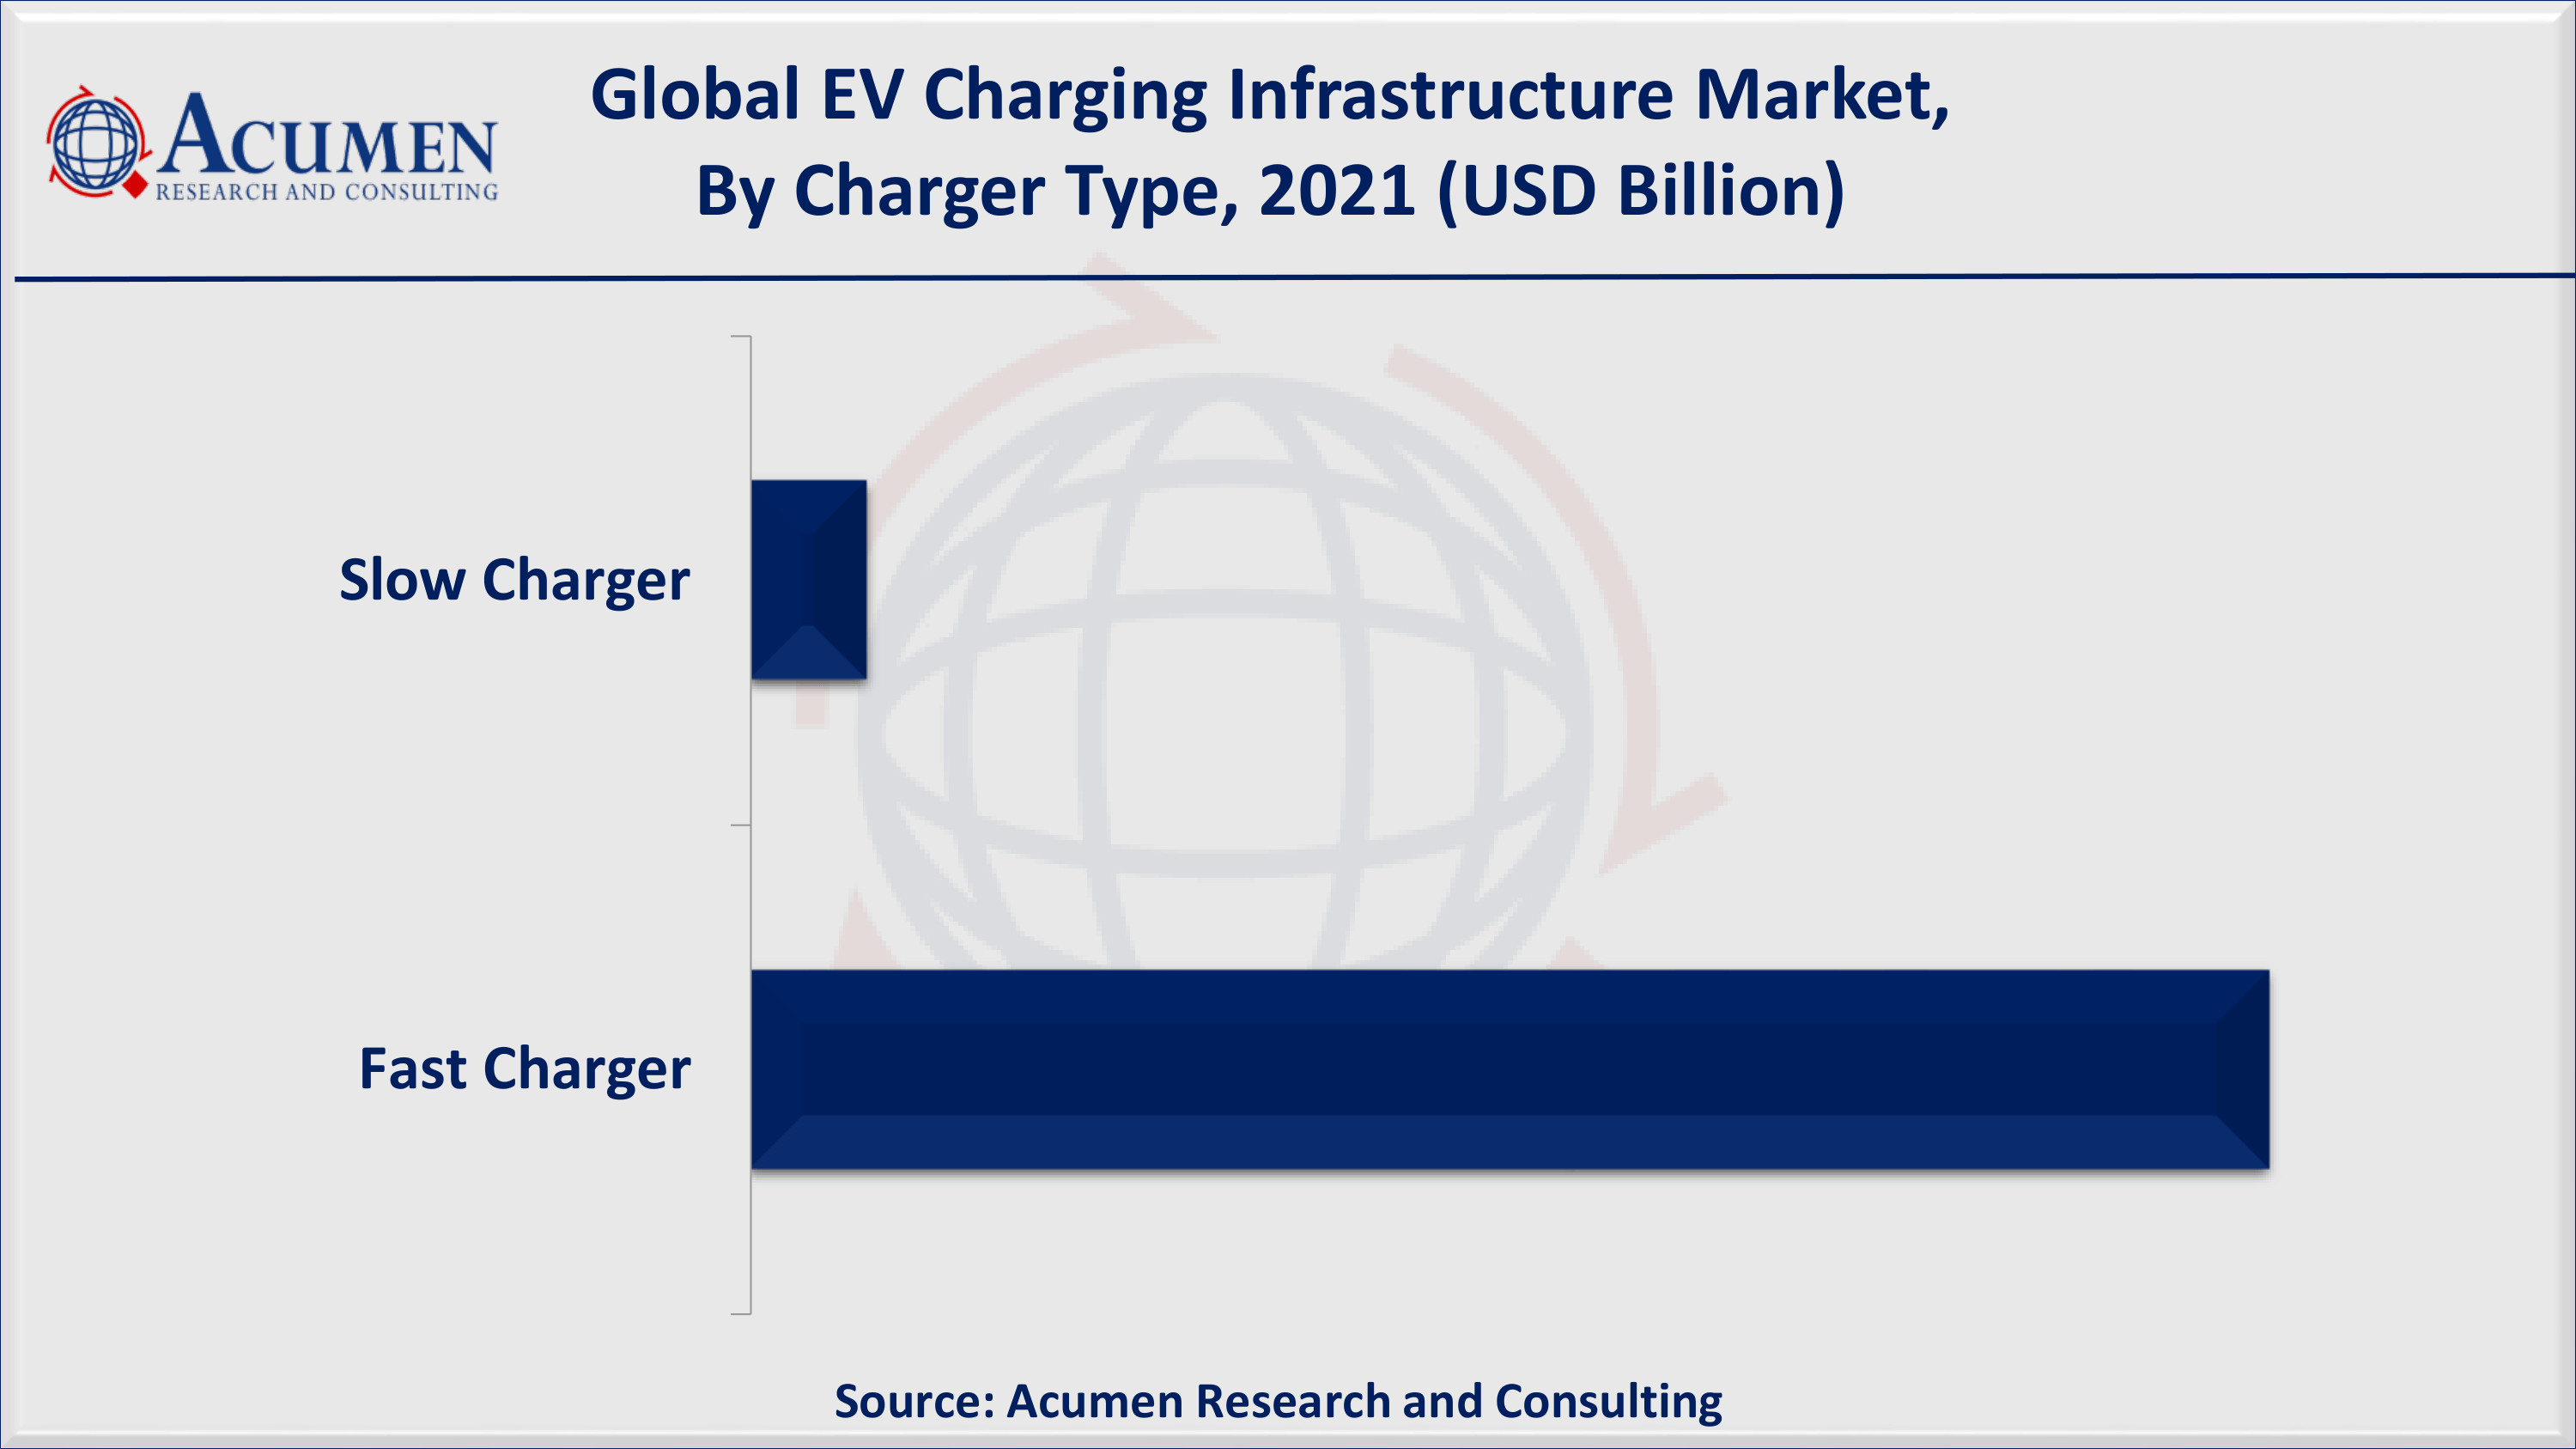
- Based on charger type, fast charger accounted for over 92% of the overall market share in 2021
- Development of EV charging stations fuels the global electric vehicle charging infrastructure market value
Consumers and fleets interested in plug-in electric vehicles (PEVs), which include plug-in hybrid electric vehicles (PHEVs) and all-electric vehicles (EVs), must have access to charging stations, also known as EVSE (electric vehicle supply equipment). Most drivers begin by charging at home or fleet facilities. Charging stations in workplaces and public places could help boost market acceptance. The EVI-Pro Lite tool can also be used to estimate the amount and type of charging infrastructure required to support regional PEV adoption by state or city/urban area. The charging infrastructure industry has agreed on a standard protocol, the Open Charge Point Interface (OCPI). As a result, the charging infrastructure counting logic in the station locator adheres to the OCPI hierarchy of stations, ports (also known as electric vehicle supply equipment, or EVSE), and connectors.
Global Electric Vehicle Charging Infrastructure Market Dynamics
Market Drivers
- Growing electric vehicle adoption
- Rising concerns over carbon emissions
- Surging government regulations
- Reducing price of EVs
Market Restraints
- Lack of standardization of charging infrastructure
- High costs of setting-up EV infrastructure
Market Opportunities
- Growing application V2G EV charging stations for electric vehicles
- Surging investments by private and public organization in the installation of EV charging stations
Electric Vehicle Charging Infrastructure Market Report Coverage
| Market | Electric Vehicle Charging Infrastructure Market |
| Electric Vehicle Charging Infrastructure Market Size 2021 | USD 17.2 Billion |
| Electric Vehicle Charging Infrastructure Market Forecast 2030 | USD 182.9 Billion |
| Electric Vehicle Charging Infrastructure Market CAGR During 2022 - 2030 | 30.2% |
| Electric Vehicle Charging Infrastructure Market Analysis Period | 2018 - 2030 |
| Electric Vehicle Charging Infrastructure Market Base Year | 2021 |
| Electric Vehicle Charging Infrastructure Market Forecast Data | 2022 - 2030 |
| Segments Covered | By Charger Type, By Connector, By Application, And By Geography |
| Regional Scope | North America, Europe, Asia Pacific, Latin America, and Middle East & Africa |
| Key Companies Profiled | AeroVironment, Inc., ABB, BP Chargemaster, ChargePoint, Inc., ClipperCreek, Inc., Eaton Corp., General Electric Company, Leviton Manufacturing Co., Inc., SemaConnect, Inc., Schneider Electric, Siemens AG, Tesla, Inc., and Webasto SE. |
| Report Coverage |
Market Trends, Drivers, Restraints, Competitive Analysis, Player Profiling, Regulation Analysis |
Electric Vehicle Charging Infrastructure Market Dynamics
How Will The Electric Vehicle Infrastructure Support The Developing Fleet?
This general trend of deploying charging in areas with higher EV adoption can be found throughout the country, and it has resulted in significant inequities in public charger access. According to a report released by the International Council on Clean Transportation, Los Angeles announced an aggressive goal for zero-emission vehicle (ZEV) penetration in 2019, aiming for 80% of total vehicles registered by 2035 and 100% by 2050. In addition, the city plans to install 28,000 public chargers by 2028. As of 2019, electric vehicle registrations accounted for about 5% of all light-duty vehicles registered in the city. In the future, thoughtful charging infrastructure deployment and incentive designs will have a significant impact on the EV market. The CalEnviroScreen tool identifies gaps and opportunities for infrastructure deployment by assessing the distribution of public charging infrastructure and the locations of disadvantaged communities. Recognizing the disparity in public charger deployment, California has made an effort to encourage public charging investments in underserved communities. For example, the California Public Utility Commission (CPUC) approved Southern California Edison's US$ 437 Mn proposal for an EV charging infrastructure program that would support the deployment of up to 38,000 new public chargers in August 2020. The program intends to construct at least 50% of the make-ready infrastructure in disadvantaged communities and at least 30% in multi-unit dwelling locations.
Government Funding Stimulates the Growth of Global Electric Vehicle (EV) Charging Infrastructure Market
According to the Australian Government's report, the Australian Government has launched the first round of a fund to address barriers to the rollout of new vehicle technologies. The first round of the Future Fuels Fund will provide grants totaling $16.5 Mn to fund battery electric vehicle fast-charging stations in capital cities and key regional centers. The funding will be used to address gaps in charging infrastructure, making it easier for consumers, businesses, and fleet owners to make the switch to electric vehicles. Furthermore, according to the WSDOT report, grant funds are to be used to support turn-key projects that finance, build, operate, and maintain electric vehicle fast charging and hydrogen fuel cell refueling stations at strategic locations along highway corridors in Washington State. The grant-funded projects must meet the requirements of the state and support interurban, interstate, and interregional travel for clean alternative fuel vehicles. Equipment purchases, electrical upgrades, installation, operations, and maintenance may all be covered by funding. WSDOT intends to award grants totaling approximately US$ 8 Mn for projects to be completed between July 2021 and June 2023.
Impact of COVID-19 on Electric Vehicle EV Charging Infrastructure Market
According to the IEA report, electric micro-mobility surged in the second half of 2020, one of the consumer trends that accelerated during the Covid-19 pandemic, boosted further by the construction of bike lanes and other mobility-promoting measures. During the peak of the second-quarter 2020 Covid-19 lockdowns, many shared micro-mobility operators reduced or suspended services. However, as restrictions were relaxed, services rebounded strongly, with 270 cities worldwide resuming operations. In the United States, sales of private e-bikes more than doubled in 2020, outpacing sales of all bikes, which were up an already healthy 65%. According to preliminary data from operators, average trip distances on e-scooters have increased by around 25% since the pandemic.
Electric Vehicle Charging Infrastructure Market Segmentation
The worldwide electric vehicle charging infrastructure market is split based on charger type, connector, application, and geography.
Electric Vehicle Charging Infrastructure Market By Charger Type
- Slow Charger
- Fast Charger

According to our electric vehicle charging infrastructure industry analysis, the fast charger segment accounts for the majority of the market share in the electric vehicle charging infrastructure market. This is because an electric car with a battery pack of around 30 kWh takes less than an hour to charge up to 80 percent of its battery capacity using a Fast Charger (50 kW). Currently available EVs across vehicle segments (2-wheeler, 3-wheeler, and 4-wheeler) can be charged from 0 percent to 80 percent in 1 – 5 hours using Slow/Moderate chargers, while EVs can be charged in less than 1 hour using Fast chargers. Fast chargers are primarily used to power electric four-wheelers.
Electric Vehicle Charging Infrastructure Market By Connector
- CHAdeMO
- Combined Charging System (CCS)
- Others
As per electric vehicle charging infrastructure market forecast, the CHAdeMO connector segment is expected to have a dominant share during 2022 to 2030. This is primarily due to its compatibility with the vast majority of EVs (including models from BMW, GM, and VW, among others) and ease of use. Furthermore, it allows for greater design flexibility in EVs because it only requires a single charging port, whereas CHAdeMO connectors require two charging ports due to their inability to support AC charging. Furthermore, the current CHAdeMO connectors can deliver 62.5 kW of DC and are specified by the Japan Electric Vehicle Standard (JEVS).
Electric Vehicle Charging Infrastructure Market By Application
- Commercial
- Residential

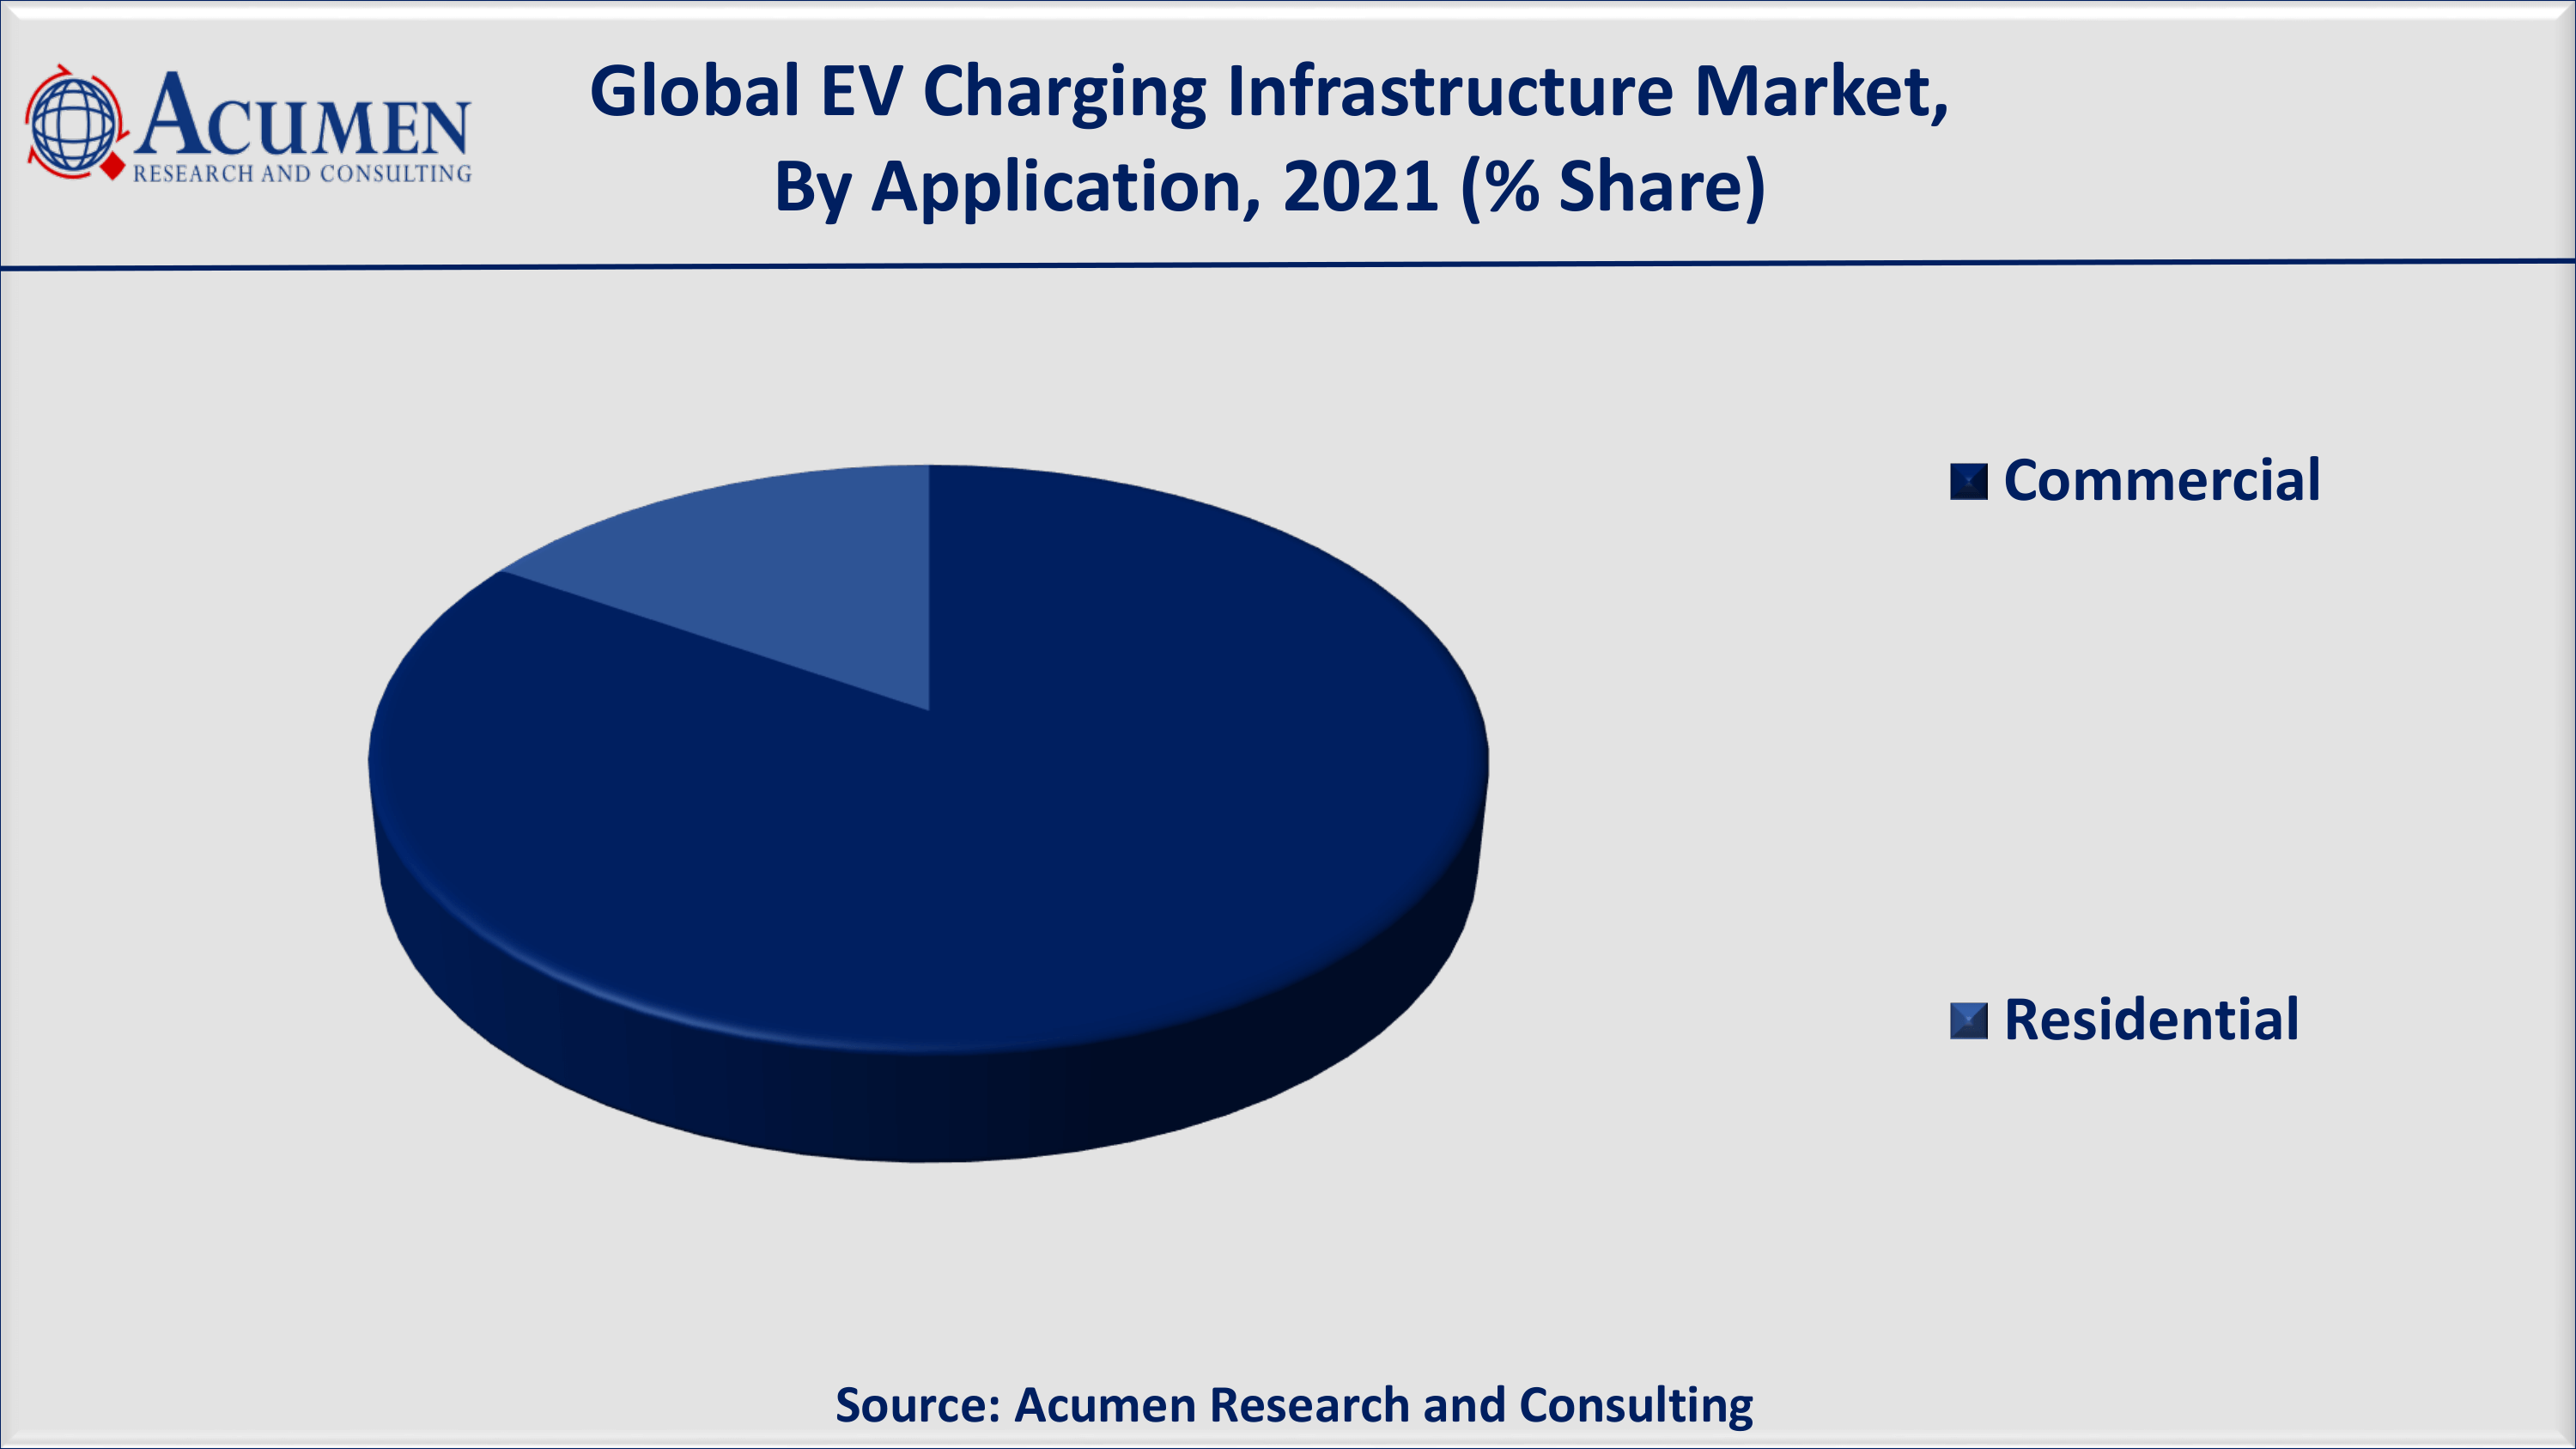
According to application, the commercial segment dominates the global electric vehicle charging infrastructure market. This is due to government initiatives and funding allocations for expanding public EVCI infrastructure by governments and automobile manufacturers. This is one of the most important factors contributing to the expansion of global electric vehicle charging infrastructure market.
Electric Vehicle Charging Infrastructure Market Regional Outlook
North America
- U.S.
- Canada
Europe
- U.K.
- Germany
- France
- Spain
- Rest of Europe
Latin America
- Mexico
- Brazil
- Rest of Latin America
Asia-Pacific
- India
- Japan
- China
- Australia
- South Korea
- Rest of Asia-Pacific
The Middle East & Africa (MEA)
- Gulf Cooperation Council (GCC)
- South Africa
- Rest of the Middle East & Africa
Electric Vehicle Charging Infrastructure Market Regional Analysis
Asia Pacific Registers Maximum Revenue Share for the Electric Vehicle Charging Infrastructure Market
Asia Pacific has taken the lead in the global market for electric vehicle charging infrastructure. Japan, China, and South Korea are the prominent APAC countries responsible for the growth of the global EV charging infrastructure market. According to the IEA report, new electric car registrations were lower than the overall car market in the first half of 2020. This trend reversed in the second half as China limited the spread of the pandemic. As a result, the company's sales share increased to 5.7%, up from 4.8% in 2019. BEVs accounted for roughly 80% of new electric vehicle registrations. Aside from that, in response to economic concerns about the pandemic, several cities relaxed car license policies, allowing more internal combustion engine vehicles to be registered in order to support local car industries.
Electric Vehicle Charging Infrastructure Market Players
Some of the key electric vehicle charging infrastructure companies in the market is ABB, AeroVironment, Inc., BP Chargemaster, ChargePoint, Inc., General Electric Company, ClipperCreek, Inc., Siemens AG, Tesla, Inc., Eaton Corp., SemaConnect, Inc., Schneider Electric, Leviton Manufacturing Co., Inc., and Webasto SE.
Frequently Asked Questions
What is the size of global electric vehicle charging infrastructure market in 2021?
The market size of electric vehicle charging infrastructure market in 2021 was accounted to be USD 17.2 Billion.
What is the CAGR of global electric vehicle charging infrastructure market during forecast period of 2022 to 2030?
The projected CAGR of electric vehicle charging infrastructure market during the analysis period of 2022 to 2030 is 30.2%.
Which are the key players operating in the market?
The prominent players of the global electric vehicle charging infrastructure market are ABB, AeroVironment, Inc., BP Chargemaster, ChargePoint, Inc., General Electric Company, ClipperCreek, Inc., Siemens AG, Tesla, Inc., Eaton Corp., SemaConnect, Inc., Schneider Electric, Leviton Manufacturing Co., Inc., and Webasto SE.
Which region held the dominating position in the global electric vehicle charging infrastructure market?
North America held the dominating electric vehicle charging infrastructure during the analysis period of 2022 to 2030.
Which region registered the fastest growing CAGR for the forecast period of 2022 to 2030?
Asia-Pacific region exhibited fastest growing CAGR for electric vehicle charging infrastructure during the analysis period of 2022 to 2030.
What are the current trends and dynamics in the global electric vehicle charging infrastructure market?
Growing adoption of lightweight materials in automotive, increased strict guidelines for emission and fuel economy, and advent of new safety features and luxury components drives the growth of global electric vehicle charging infrastructure market.
Which charger type held the maximum share in 2021?
Based on charger type, fast charger segment is expected to hold the maximum share electric vehicle charging infrastructure market.


