Methanol Market Size - Global Industry, Share, Analysis, Trends and Forecast 2023 - 2032
Published :
Report ID:
Pages :
Format :
Methanol Market Size - Global Industry, Share, Analysis, Trends and Forecast 2023 - 2032
Report Coverage
- Industry Dynamics
- Market Size and Forecast Data
- Segment Analysis
- Competitive Landscape
- Regional Analysis with a Niche Focus on Country-Level Data
- High Level Analysis - Porter's, PESTEL, Value Chain, etc.
- Company Profiles of Key Players
- Option to Customize the Report As Per Your Specific Need
Request Sample Report
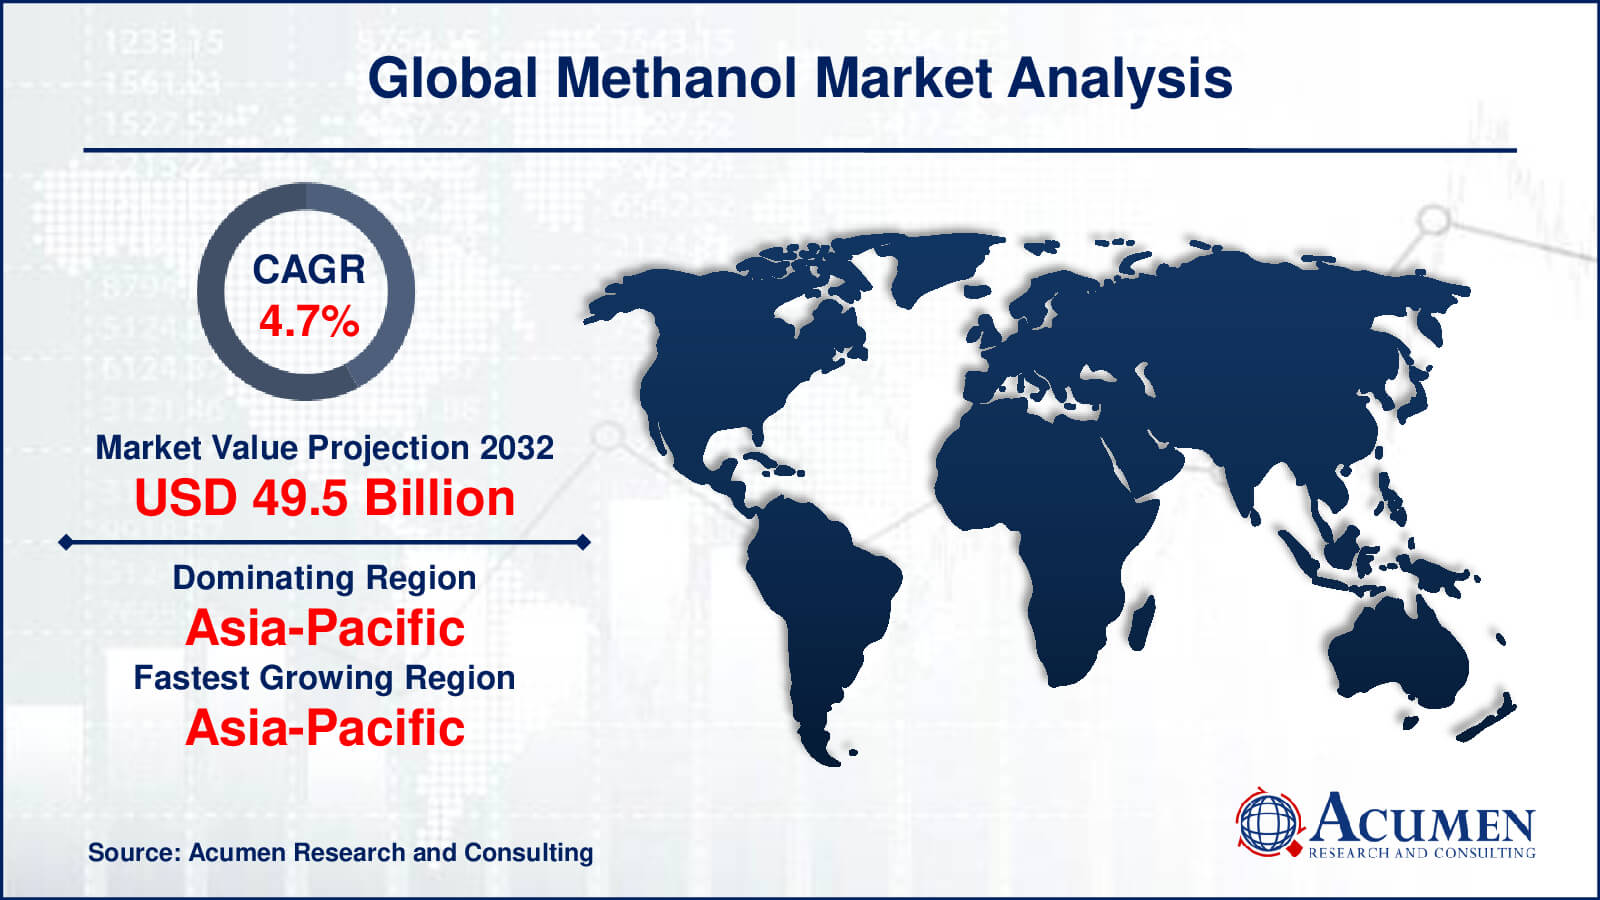
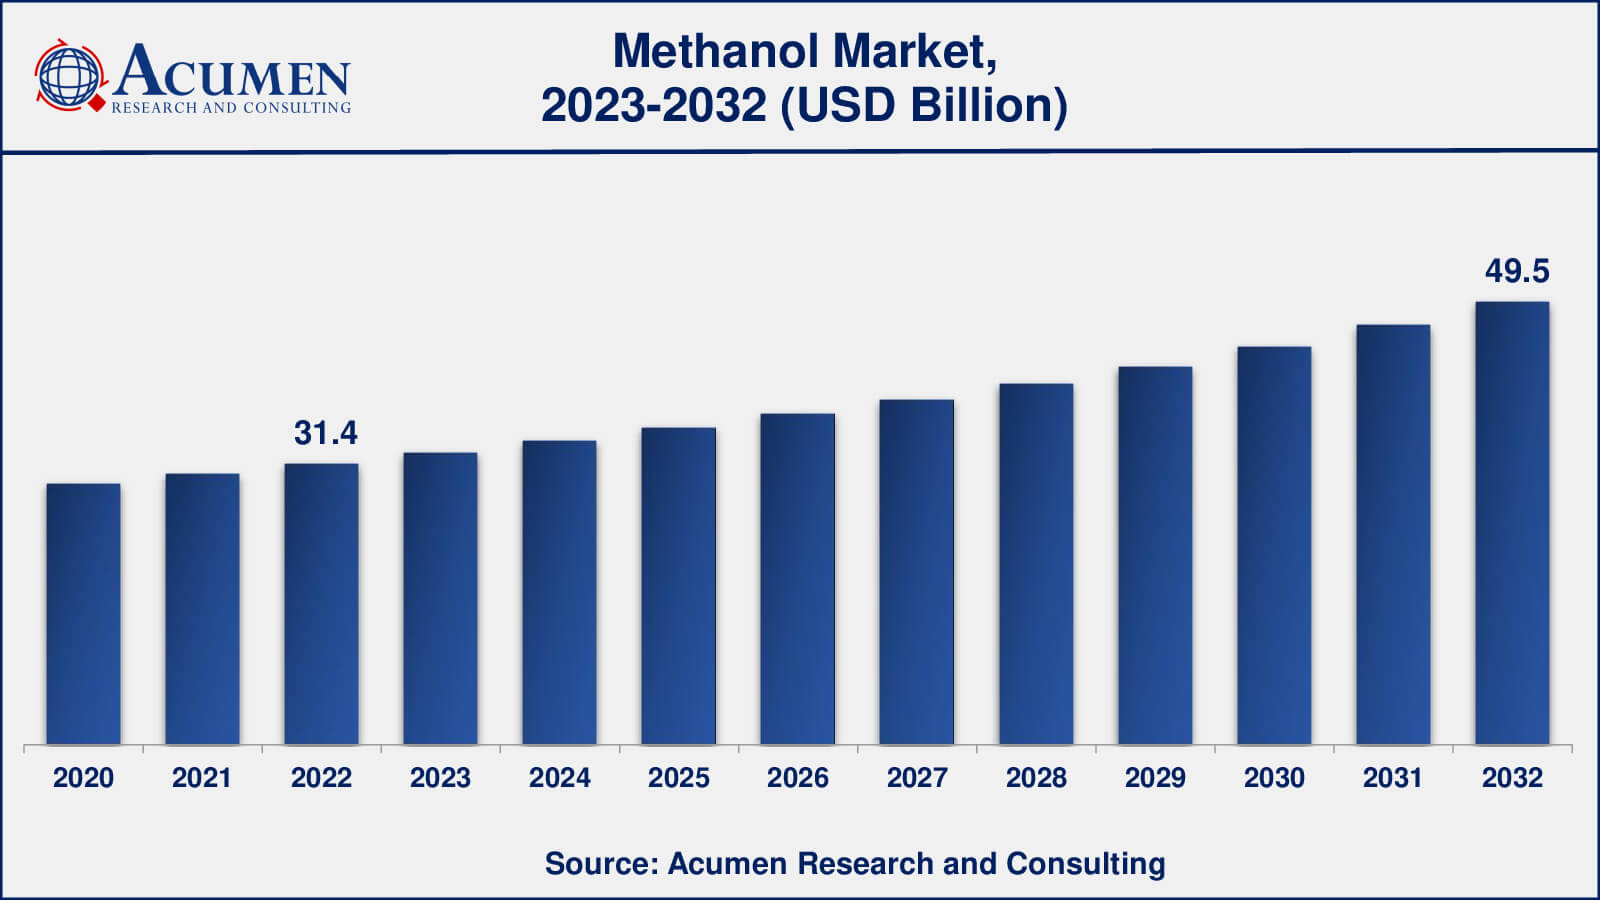
The Global Methanol Market Size accounted for USD 31.4 Billion in 2022 and is estimated to achieve a market size of USD 49.5 Billion by 2032 growing at a CAGR of 4.7% from 2023 to 2032.
Methanol Market Highlights
- Global methanol market revenue is poised to garner USD 49.5 billion by 2032 with a CAGR of 4.7% from 2023 to 2032
- Asia-Pacific methanol market value occupied around USD 19.4 billion in 2022
- Asia-Pacific methanol market growth will record a CAGR of more than 5% from 2023 to 2032
- Among feedstock, the natural gas sub-segment generated over US$ 15 billion revenue in 2022
- Based on end-user industry, the automotive sub-segment generated around 45% share in 2022
- Development of methanol from renewable sources is a popular methanol market trend that fuels the industry demand
Methanol (CH3OH), the simplest alcohol, is utilized in the production of numerous everyday items, including plastics, paints, automobile parts, and construction materials. Additionally, methanol serves as a renewable energy source capable of powering vehicles, buses, ships, fuel cells, boilers, and cook stoves. Methanol's utilization in various novel applications worldwide is on the rise in response to increasing energy demands. This versatile chemical finds its way into a wide range of everyday products, as well as automobile parts and the synthesis of other valuable compounds. Moreover, methanol plays a significant role in the production of biodiesel, a biodegradable and environmentally friendly fuel that generates fewer air pollutants compared to other fuel alternatives.
Global Methanol Market Dynamics
Market Drivers
- Rising demand from automobile and construction industries
- Increasing demand for petrochemicals in Asia-Pacific region
- Growing demand of clean-burning fuels
- Increasing utilization of methanol in the production of olefins using MTO
- Growing interest in methanol as a clean energy source
- Availability of various feedstocks (natural gas, biomass) ensures a stable supply
- Increasing production of methanol from renewable sources enhances sustainability
Market Restraints
- Rising use of fuel-grade ethanol and bio-ethanol
- Methanol's toxicity poses safety challenges in handling, transportation, and usage
- Fluctuations in feedstock costs impact methanol's price stability
- Adapting existing infrastructure for methanol distribution can be costly
Market Opportunities
- Increasing use of methanol as a fuel in marine and railways
- Expansion of production capabilities and inclination towards low-emission fuels
- Methanol's potential as a hydrogen carrier creates new opportunities
- Methanol can utilize captured carbon dioxide, aiding emission reduction
Methanol Market Report Coverage
| Market | Methanol Market |
| Methanol Market Size 2022 | USD 31.4 Billion |
| Methanol Market Forecast 2032 | USD 49.5 Billion |
| Methanol Market CAGR During 2023 - 2032 | 4.9% |
| Methanol Market Analysis Period | 2020 - 2032 |
| Methanol Market Base Year | 2022 |
| Methanol Market Forecast Data | 2023 - 2032 |
| Segments Covered | By Feedstock, By Derivative, By End-User Industry, And By Geography |
| Regional Scope | North America, Europe, Asia Pacific, Latin America, and Middle East & Africa |
| Key Companies Profiled | BASF, Qatar Fuel Additives Company Limited, Zagros Petrochemical Company, Mitsui & Co., Ltd, Petronas (Petroliam Nasional Berhad), Saudi Arabia Basic Industries Corporation (SABIC), Celanese Corporation, Methanex Corporation, Valero Marketing & Supply Company, Mitsubishi Gas Chemical Co., Inc. |
| Report Coverage |
Market Trends, Drivers, Restraints, Competitive Analysis, Player Profiling, Covid-19 Analysis, Regulation Analysis |
Methanol Market Insights
Renewable methanol fuel significantly reduces greenhouse gas emissions. Depending on the feedstock and conversion process, renewable methanol can lead to carbon emission reductions ranging from 65 to 95 percent compared to fossil fuels. This reduction is among the most substantial observed among fuels being researched as replacements for gasoline, diesel, coal, and methane. Moreover, pure methanol combustion produces no sulfur oxides (SOx), minimal nitrogen oxides (NOx), and no particulate matter emissions. As awareness of the threat posed by man-made climate change grows, government agencies, industries, and the scientific community are exploring alternative energy sources to drive economic activities. Methanol serves as a renewable fossil fuel in this context.
However, the use of fuel-grade ethanol poses a potential challenge to the methanol market. While ethanol offers advantages as a fuel, such as high octane numbers, low toxicity, and minimal contamination, its presence in petrol is usually limited to a maximum of 5.4%. Ethanol is commonly blended with fuel in many countries due to its higher density compared to methanol, making it an appealing alternative. The methanol market may face obstacles due to the rise in demand from the construction and automotive industries. Nonetheless, the consumption of methanol by various industries will drive market growth. Furthermore, the increasing use of methanol in fuel mix applications is expected to contribute to market growth throughout the forecast period.
Methanol Market Segmentation
The worldwide market for methanol is split based on feedstock, derivative, end-user industry, and geography.
Methanol Feedstocks
- Natural Gas
- Coal
- Others
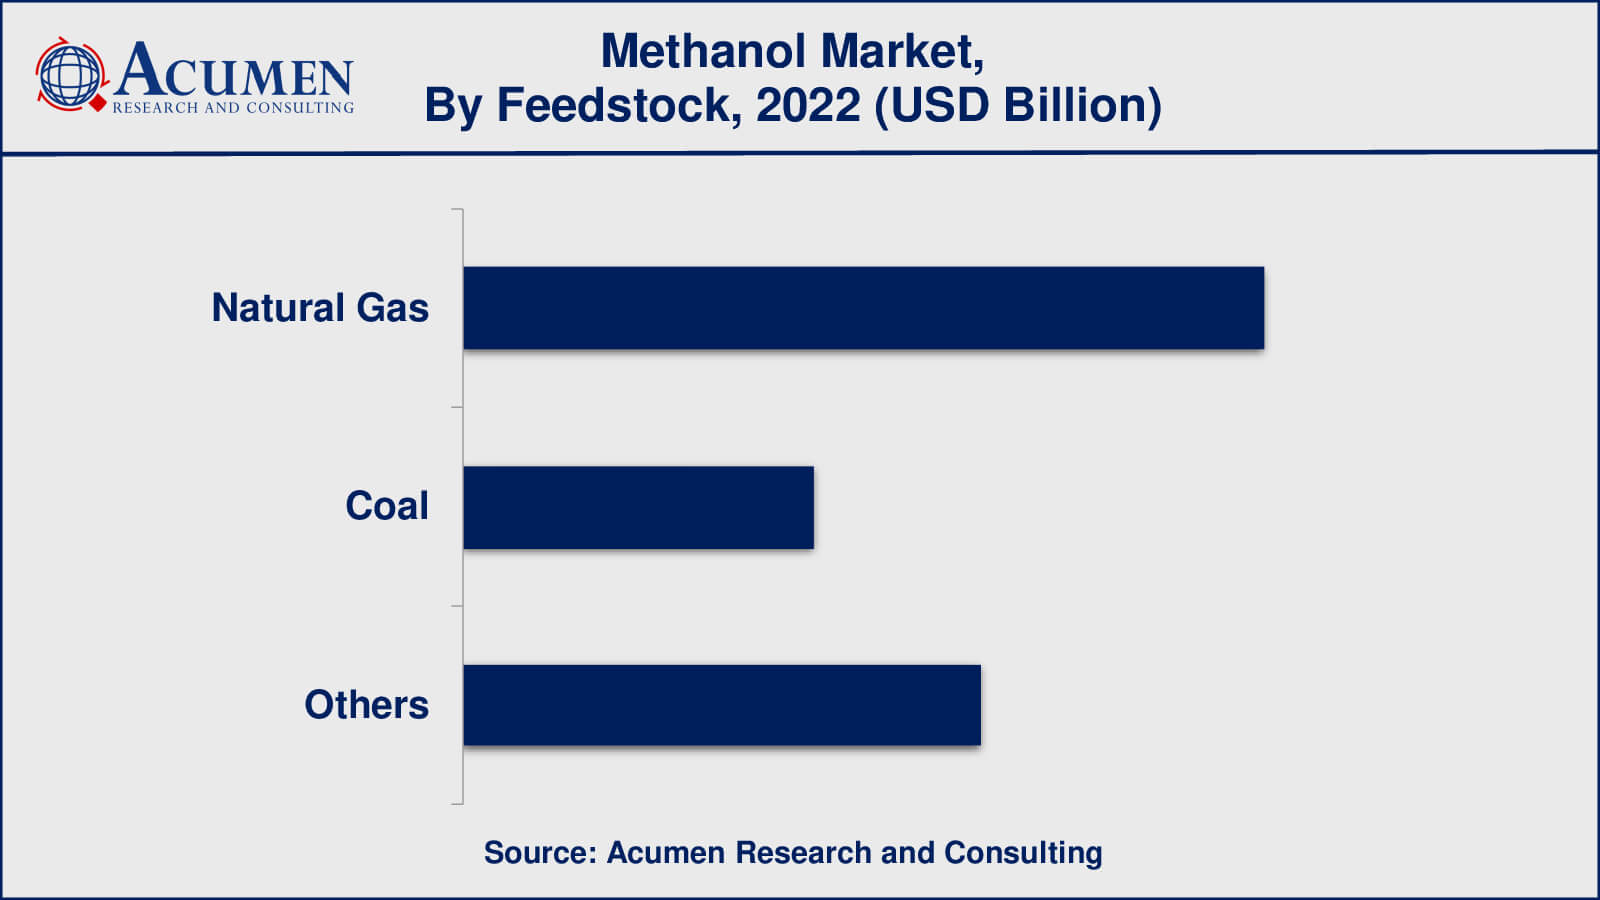
According to the methanol market, the feedstock segment is categorized into natural gas, coal, and others. As per our methanol industry analysis, the natural gas segment held the largest market share in 2022. Natural gas stands as the most prevalent feedstock for methanol production, owing to its abundant resources, relatively low price levels with moderate volatility, and minimal impurity content. The production of methanol through a single-step process involving the partial oxidation of methane represents a promising new catalytic approach, opening up novel avenues for the utilization of natural gas.
Methanol Derivatives
- Formaldehyde
- MTO/MTP
- Gasoline
- MTBE
- MMA
- Dimethyl Terephthalate (DMT)
- Acetic Acid
- Dimethyl Ether (DME)
- Methylamines
- Others
Based on derivatives, the formaldehyde segment dominated the market in 2022. Methanol serves as a vital component in the production of formaldehyde, a colorless, flammable, and odorous gas. Formaldehyde synthesis occurs through the catalytic oxidation and dehydrogenation of methanol, utilizing either silver or a metal oxide catalyst. Given its wide array of applications, formaldehyde is employed in nearly 50,000 product manufacturing facilities in the United States alone. However, the entire methanol industry is experiencing growth driven by the rising demand for formaldehyde.
Methanol End-User Industries
- Construction
- Automotive
- Electronics
- Others
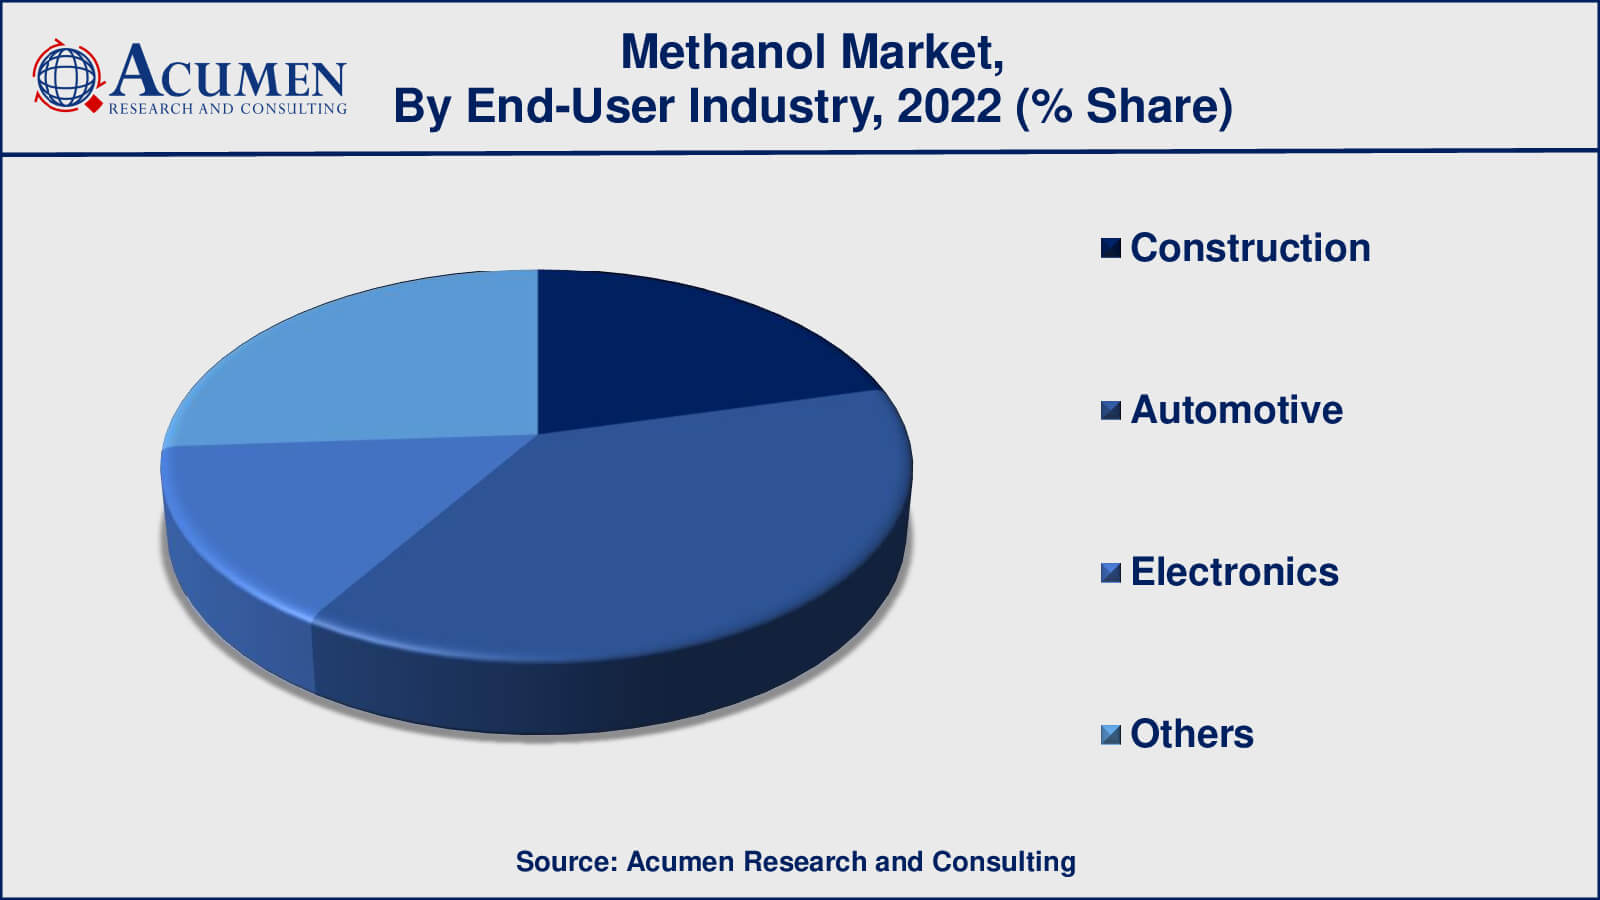
Based on the end-user industry segment, the automotive sector held the largest methanol market share in recent years. This substantial share is primarily attributed to the increasing adoption of methanol as a fuel to mitigate emissions. Furthermore, the construction segment is poised to exhibit significant growth during the forecast period. Methanol finds extensive use in the building and construction industry, particularly in the manufacturing of engineered wood products. As a result, the growth of commercial and residential construction activities, along with improving standards of living, contributes to the expansion of the global methanol market. Additionally, methanol, being a versatile chemical, is utilized in the production of adhesives, paint, and plywood, all essential components in the construction sector.
Methanol Market Regional Outlook
North America
- U.S.
- Canada
Europe
- U.K.
- Germany
- France
- Spain
- Rest of Europe
Asia-Pacific
- India
- Japan
- China
- Australia
- South Korea
- Rest of Asia-Pacific
Latin America
- Brazil
- Mexico
- Rest of Latin America
The Middle East & Africa
- South Africa
- GCC Countries
- Rest of the Middle East & Africa (ME&A)
Methanol Market Regional Analysis
The Asia-Pacific region dominated the methanol market in 2022, with countries such as China and India leading in methanol consumption and applications. In 2017, Carbon Recycling International collaborated with Geely Holdings and Zixin Industrial Co. to promote and develop renewable methanol production facilities in China. Additionally, India ranks as the world's third-largest emitter of energy-related carbon dioxide. As part of efforts to reduce carbon dioxide emissions, India has established a Methanol Production capacity of 2 million tons per year. According to the NITI Aayog plan, India aims to produce 20 million tons of methanol in the near future using resources like Indian High Ash coal, Stranded gas, and Biomass.
The methanol market in North America is impacted by factors such as industrial expansion, environmental laws, and the need for alternative fuels. Methanol is a significant consumer in the United States and Canada, owing to its uses in the chemical, automotive, and construction industries. Furthermore, sustainable energy legislation, environmental concerns, and advances in chemical production all have an impact on Europe's methanol industry. Germany and the United Kingdom are major participants in methanol production and consumption.
Methanol Market Players
Some of the top methanol companies offered in our report includes BASF, Qatar Fuel Additives Company Limited, Zagros Petrochemical Company, Mitsui & Co., Ltd, Petronas (Petroliam Nasional Berhad), Saudi Arabia Basic Industries Corporation (SABIC), Celanese Corporation, Methanex Corporation, Valero Marketing & Supply Company, Mitsubishi Gas Chemical Co., Inc.
Frequently Asked Questions
What was the market size of the global methanol in 2022?
The market size of methanol was USD 31.4 billion in 2022.
What is the CAGR of the global methanol market from 2023 to 2032?
The CAGR of methanol is 4.7% during the analysis period of 2023 to 2032.
Which are the key players in the methanol market?
The key players operating in the global market are including BASF, Qatar Fuel Additives Company Limited, Zagros Petrochemical Company, Mitsui & Co., Ltd, Petronas (Petroliam Nasional Berhad), Saudi Arabia Basic Industries Corporation (SABIC), Celanese Corporation, Methanex Corporation, Valero Marketing & Supply Company, and Mitsubishi Gas Chemical Co., Inc.
Which region dominated the global methanol market share?
Asia-Pacific held the dominating position in methanol industry during the analysis period of 2023 to 2032.
Which region registered fastest CAGR from 2023 to 2032?
Asia-Pacific region exhibited fastest growing CAGR for market of methanol during the analysis period of 2023 to 2032.
What are the current trends and dynamics in the global methanol industry?
The current trends and dynamics in the methanol industry include rising demand from automobile and construction industries, increasing demand for petrochemicals in Asia-Pacific region, and growing demand of clean-burning fuels.
Which Feedstock held the maximum share in 2022?
The natural gas feedstock held the maximum share of the methanol industry.


