Magnetic Resonance Imaging (MRI) Systems Market Size - Global Industry, Share, Analysis, Trends and Forecast 2024 - 2032
Published :
Report ID:
Pages :
Format :
Magnetic Resonance Imaging (MRI) Systems Market Size - Global Industry, Share, Analysis, Trends and Forecast 2024 - 2032
Report Coverage
- Industry Dynamics
- Market Size and Forecast Data
- Segment Analysis
- Competitive Landscape
- Regional Analysis with a Niche Focus on Country-Level Data
- High Level Analysis - Porter's, PESTEL, Value Chain, etc.
- Company Profiles of Key Players
- Option to Customize the Report As Per Your Specific Need
Request Sample Report
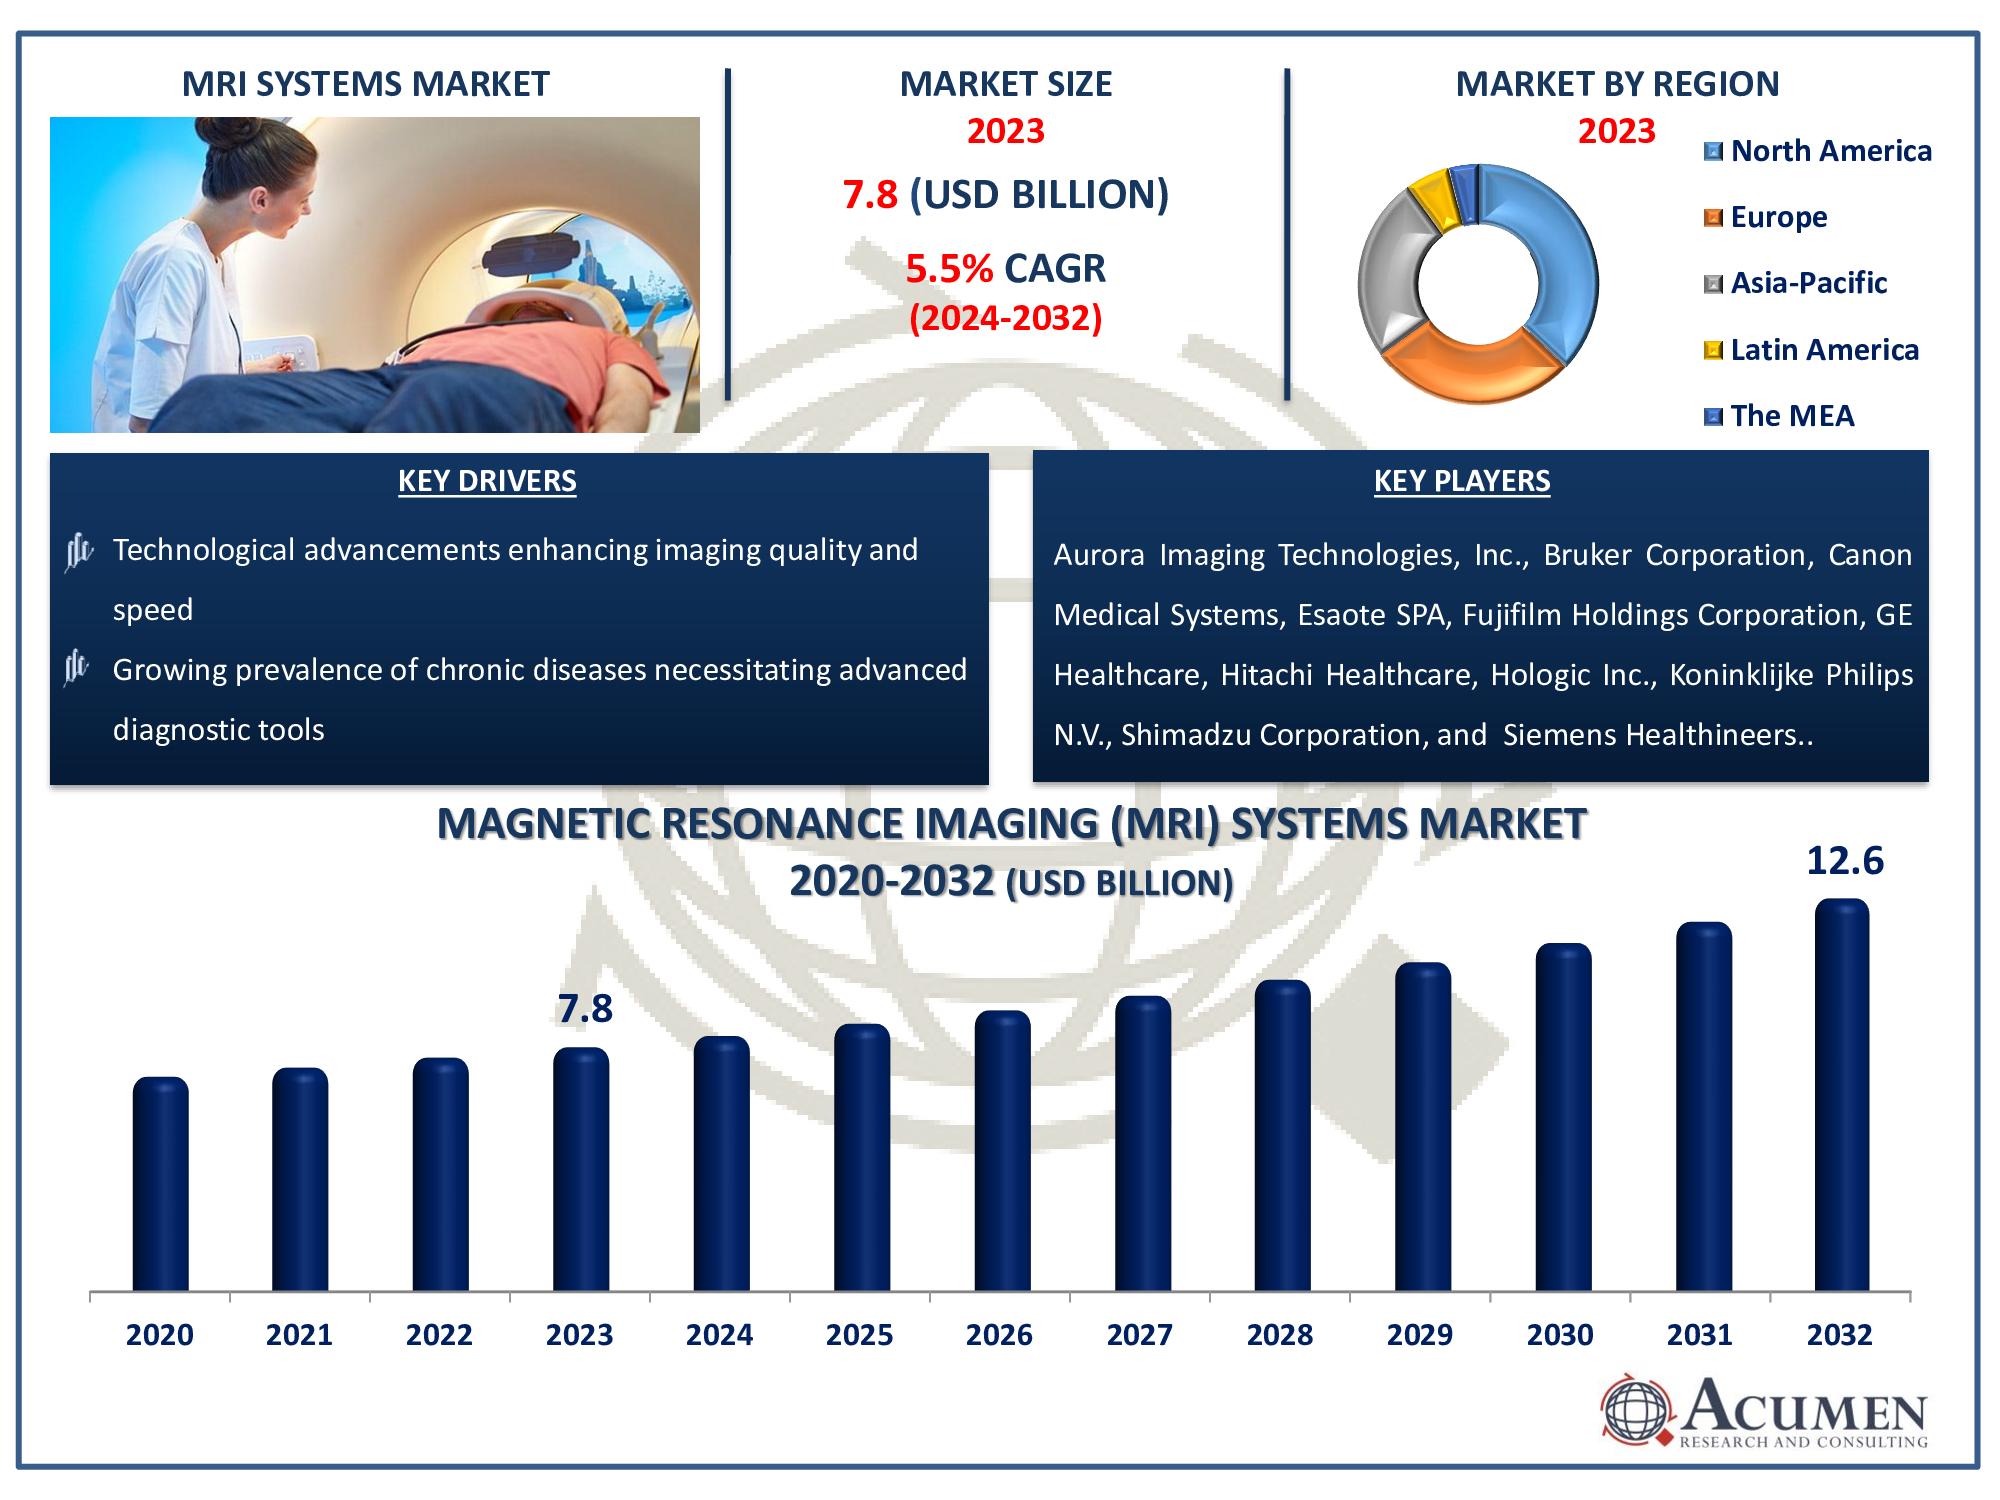
The Global Magnetic Resonance Imaging (MRI) Systems Market Size accounted for USD 7.8 Billion in 2023 and is estimated to achieve market size of USD 12.6 Billion by 2032 growing at a CAGR of 5.5% from 2024 to 2032.
Magnetic Resonance Imaging (MRI) Systems Market Highlights
- Global MRI systems market revenue is poised to garner USD 12.6 billion by 2032 with a CAGR of 5.5% from 2024 to 2032
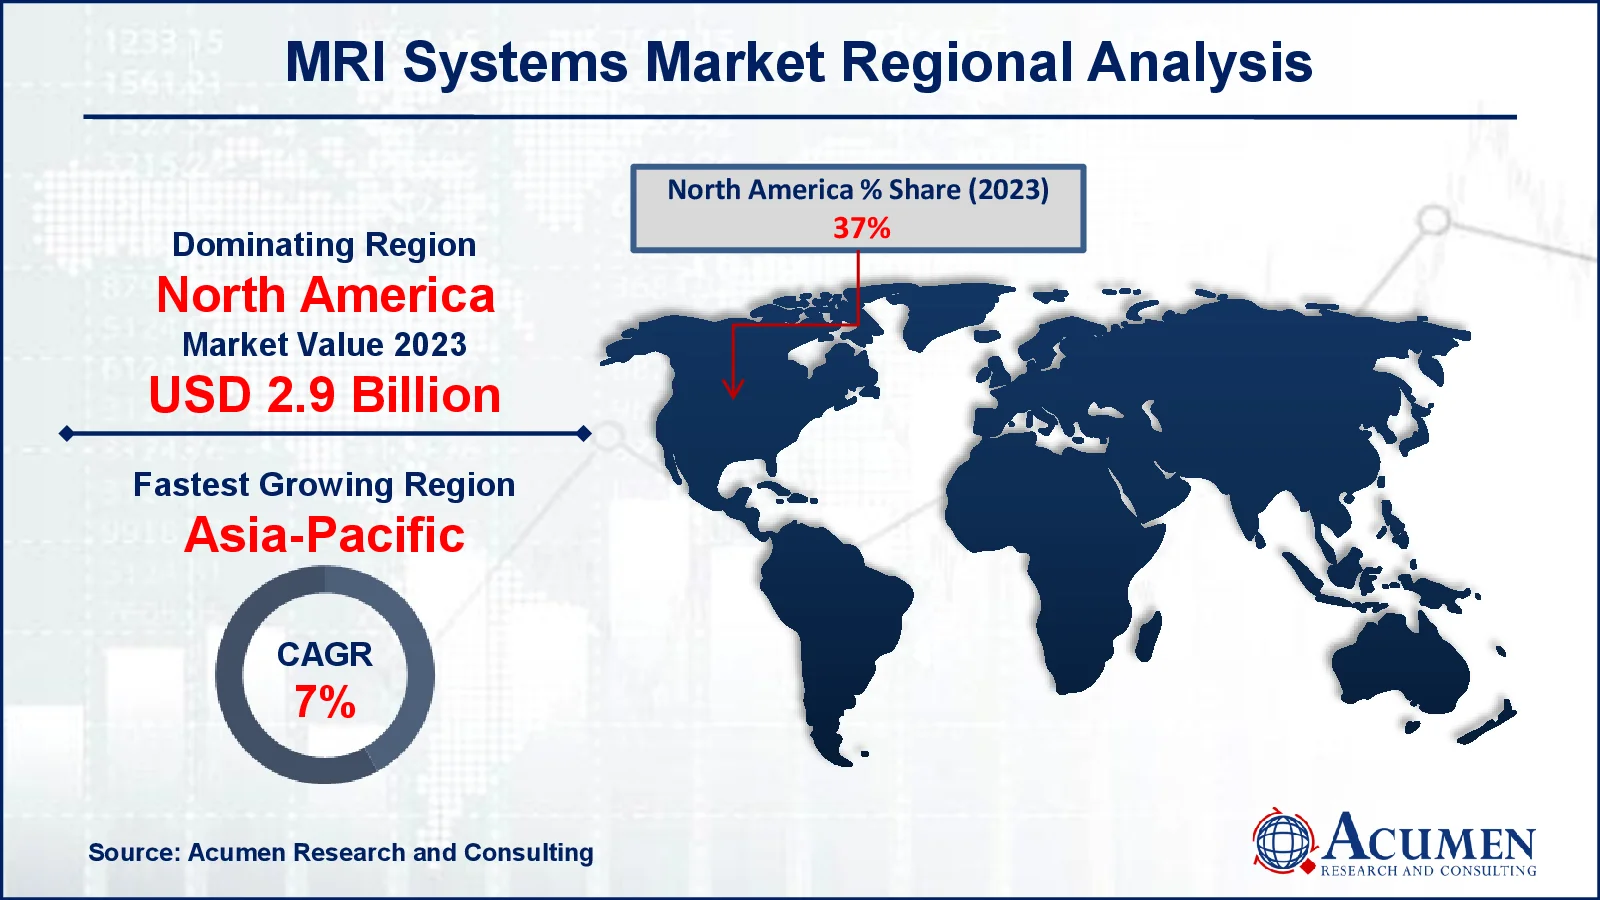
- North America magnetic resonance imaging (MRI) systems market value occupied around USD 2.9 billion in 2023
- Asia-Pacific magnetic resonance imaging systems market growth will record a CAGR of more than 7% from 2024 to 2032
- Among architecture, the closed MRI sub-segment generated over US$ 4.7 billion revenue in 2023
- Based on field strength, the mid field strength sub-segment generated around 45% share in 2023
- Collaborations and strategic partnerships for research and development, driving innovation in MRI technology is a popular market trend that fuels the industry demand

Magnetic resonance imaging (MRI) systems are advanced medical devices that use a powerful magnetic field, radio waves, and computer technology to create detailed images of the body's internal structures. Unlike X-rays or CT scans, MRI generates images without ionizing radiation, ensuring non-invasive and safe diagnostic capabilities. These systems function by aligning hydrogen atoms within bodily tissues using a strong magnetic field. Radio waves then manipulate the alignment of these atoms, and upon returning to their original state, they emit signals detected by the MRI scanner. A computer processes these signals to create highly detailed cross-sectional images of organs, tissues, and bones. MRI is a non-invasive diagnostic method that offers comprehensive three-dimensional views of organs and joints without surgical intervention. It effectively detects cardiovascular issues and examines the spine, extremities, and various organs, providing valuable insights for medical diagnoses.
Global Magnetic Resonance Imaging (MRI) Systems market Dynamics
Market Drivers
- Technological advancements enhancing imaging quality and speed
- Growing prevalence of chronic diseases necessitating advanced diagnostic tools
- Rising demand for non-invasive diagnostic procedures
- Increasing healthcare expenditure and investments in medical infrastructure
Market Restraints
- High initial costs associated with MRI system installation and maintenance
- Limited availability of skilled professionals to operate MRI systems
- Regulatory hurdles and compliance standards affecting market entry
Market Opportunities
- Expanding applications in oncology, neurology, and musculoskeletal disorders
- Rising demand for portable and compact MRI systems for point-of-care diagnostics
- Emerging markets and untapped regions offering growth opportunities
Magnetic Resonance Imaging (MRI) Systems market Report Coverage
|
Market |
Magnetic Resonance Imaging (MRI) Systems Market |
|
Magnetic Resonance Imaging (MRI) Systems market Size 2023 |
USD 7.8 Billion |
|
Magnetic Resonance Imaging (MRI) Systems market Forecast 2032 |
USD 12.6 Billion |
|
Magnetic Resonance Imaging (MRI) Systems Market CAGR During 2024 - 2032 |
5.5% |
|
Magnetic Resonance Imaging (MRI) Systems Market Analysis Period |
2020 - 2032 |
|
Magnetic Resonance Imaging (MRI) Systems Market Base Year |
2023 |
|
Magnetic Resonance Imaging (MRI) Systems Market Forecast Data |
2024 - 2032 |
|
Segments Covered |
By Architecture, By Field Strength, By Application, By End-User, and By Geography |
|
Regional Scope |
North America, Europe, Asia Pacific, Latin America, and Middle East & Africa |
|
Key Companies Profiled Aviation |
Aurora Imaging Technologies, Inc., Bruker Corporation, Canon Medical Systems, Esaote SPA, Fujifilm Holdings Corporation, GE Healthcare, Hitachi Healthcare, Hologic Inc., Koninklijke Philips N.V., Shimadzu Corporation, and Siemens Healthineers. |
|
Report Coverage |
Market Trends, Drivers, Restraints, Competitive Analysis, Player Profiling, Covid-19 Analysis, Regulation Analysis |
Magnetic Resonance Imaging (MRI) Systems Market Insights
Advancements in technology, such as the inclusion of PET or CT scans, offer imaging options aimed at reducing exposure to harmful radiation. This has resulted in an increased utilization of MRI in developing countries, alongside the availability of expanded universal health coverage in both developed and developing nations. These factors collectively contribute to the growth of the global magnetic resonance imaging (MRI) market. Major players like GE, Siemens, or Philips are dedicated to enhancing technology and global distribution networks, supporting the burgeoning number of public and private diagnostic centers worldwide.
Nevertheless, due to their cost-effectiveness and widespread availability, the utilization of refurbished MRI equipment is highly preferred in developing markets. Notably, significant technological advancements characterize the current market landscape. Beyond the conventional 1.5T-3T range, the upper limit of magnetic field strength in MRI has surged to an impressive 7T. This technological leap has broadened the application profile of MRI devices and is projected to continue expanding in the magnetic resonance imaging (MRI) systems industry forecast period.
Anticipated growth in the adoption of MRI systems within hospitals, clinics, and diagnostic centers, capturing the highest market share, presents an attractive investment prospect. The market is bifurcated into open MRIs and closed MRIs based on architecture. In recent years, there has been widespread adoption of MRI systems. Looking ahead, advancements such as application reduction, enhanced image quality, and cost-effective scans are expected to drive substantial growth. Notably, despite these advancements, the market size currently remains relatively small.
Magnetic Resonance Imaging (MRI) Systems market Segmentation
The worldwide magnetic resonance imaging market is split based on architecture, field strength, application, end-user, and geography.
Magnetic Resonance Imaging (MRI) Systems Market By Architectures
- Closed MRI
- Open MRI
According to magnetic resonance imaging (MRI) systems industry analysis, closed MRI architecture has emerged as the dominating segment in the market in recent years. This design, distinguished by its enclosed tunnel-like structure, provides superior image quality due to a stronger magnetic field, which reduces interference from outside causes. Its appeal arises from its ability to produce exact and clear images, which are critical for proper diagnosis, particularly in complex cases. The versatility of the closed MRI to accommodate different body forms while preserving exceptional image quality has boosted its popularity, making it the favoured choice in many healthcare settings across the world.
Magnetic Resonance Imaging (MRI) Systems Market By Field Strengths
- Low Field Strength
- Mid Field Strength
- High Field Strength
Mid field strength has recently emerged as the prominent sector in the magnetic resonance imaging (MRI) systems market. This category often includes MRI equipment with field strengths ranging from low to high. The picture resolution and cost-effectiveness of mid field strength MRI scanners are balanced. They provide better imaging quality than low-field devices while being less expensive than high-field choices. This balance appeals to a wide range of healthcare facilities wanting greater imaging capabilities without the higher expenditures associated with high-field systems, fueling the market's rising adoption and prominence of mid field strength MRI scanners.
Magnetic Resonance Imaging (MRI) Systems Market By Applications
- Obstructive Sleep Apnea (OSA)
- Brain and neurological
- Spine and musculoskeletal
- Vascular
- Abdominal
- Cardiac
- Breast
- Other
In terms of magnetic resonance imaging (MRI) systems market analysis, the brain and neurological category has emerged as the key driver. This dominance is related to the essential role MRI plays in identifying neurological illnesses such as brain tumours, strokes, and degenerative diseases. The technology's capacity to give exact, comprehensive images of brain structures and disorders, assisting in accurate diagnoses and treatment planning, has propelled it to popularity. With an increased emphasis on neurological research and rising prevalence of brain-related ailments worldwide, demand for MRI systems specialised to brain and neurological imaging continues to rise, cementing its position as the market's leading category.
Magnetic Resonance Imaging (MRI) Systems Market By End-Users
- Hospitals
- Clinics
- Others
The hospitals segment, representing a substantial portion of the market, has witnessed considerable growth. Patients with chronic illnesses and injuries frequently seek admission to hospitals, thereby escalating the demand for technologically advanced MRI systems to ensure accurate diagnoses. Moreover, this growth is expected to fuel the expansion of multispecialty clinics in developing countries, focusing on diagnostic imaging expertise. For instance, Apollo Hospital in Delhi has installed the Open Standard MRI Scanner G (Gravity) Scan, showcasing cutting-edge technology for musculoskeletal applications.
Throughout the magnetic resonance imaging (MRI) systems market forecast period, other segments encompassing imaging centers, radiology laboratories, and research facilities are anticipated to experience significant growth. The widespread adoption of MRI scanners within these healthcare settings will contribute to substantial segmental expansion, enabling precise and targeted diagnoses.
Magnetic Resonance Imaging (MRI) Systems market Regional Outlook
North America
- U.S.
- Canada
Europe
- U.K.
- Germany
- France
- Spain
- Rest of Europe
Asia-Pacific
- India
- Japan
- China
- Australia
- South Korea
- Rest of Asia-Pacific
Latin America
- Brazil
- Mexico
- Rest of LATAM
The Middle East & Africa
- South Africa
- GCC Countries
- Rest of the Middle East & Africa (ME&A)
Magnetic Resonance Imaging (MRI) Systems market Regional Analysis
Technological advancements have significantly expanded the clinical applications of MRI systems, contributing to North America's dominance in this market. Ongoing advancements, such as additional features for early detection of molecular or cellular changes in diseases like Alzheimer's, are anticipated in future technological developments. For instance, the US-based Fonar Corporation has pioneered a new Radio Frequency and Scanning Protocol, enabling x-ray imaging of patients' spines without the associated diagnostic image risks.

In Latin America, the market for magnetic resonance imaging systems has seen substantial growth. The region, estimated to have a significant market value, has been driven by an aging population and an increase in chronic diseases, particularly in countries like Brazil and Mexico. Organizations such as the Brazilian Alliance play a crucial role in ensuring access to advanced technology and improving public health in Brazil, thereby fostering regional market growth and MRI system adoption.
The Asia-Pacific magnetic resonance imaging systems market is poised for significant growth due to an aging population prone to chronic diseases. Government initiatives in emerging countries aim to reduce the costs associated with diagnosing chronic diseases, facilitating the increased adoption of MRI systems within the industry.
Magnetic Resonance Imaging (MRI) Systems Market Players
Some of the top magnetic resonance imaging (MRI) systems companies offered in our report include Aurora Imaging Technologies, Inc., Bruker Corporation, Canon Medical Systems, Esaote SPA, Fujifilm Holdings Corporation, GE Healthcare, Hitachi Healthcare, Hologic Inc., Koninklijke Philips N.V., Shimadzu Corporation, and Siemens Healthineers.


