Open MRI Systems Market Size - Global Industry, Share, Analysis, Trends and Forecast 2025 - 2033
Published :
Report ID:
Pages :
Format :
Open MRI Systems Market Size - Global Industry, Share, Analysis, Trends and Forecast 2025 - 2033
Report Coverage
- Industry Dynamics
- Market Size and Forecast Data
- Segment Analysis
- Competitive Landscape
- Regional Analysis with a Niche Focus on Country-Level Data
- High Level Analysis - Porter's, PESTEL, Value Chain, etc.
- Company Profiles of Key Players
- Option to Customize the Report As Per Your Specific Need
Request Sample Report
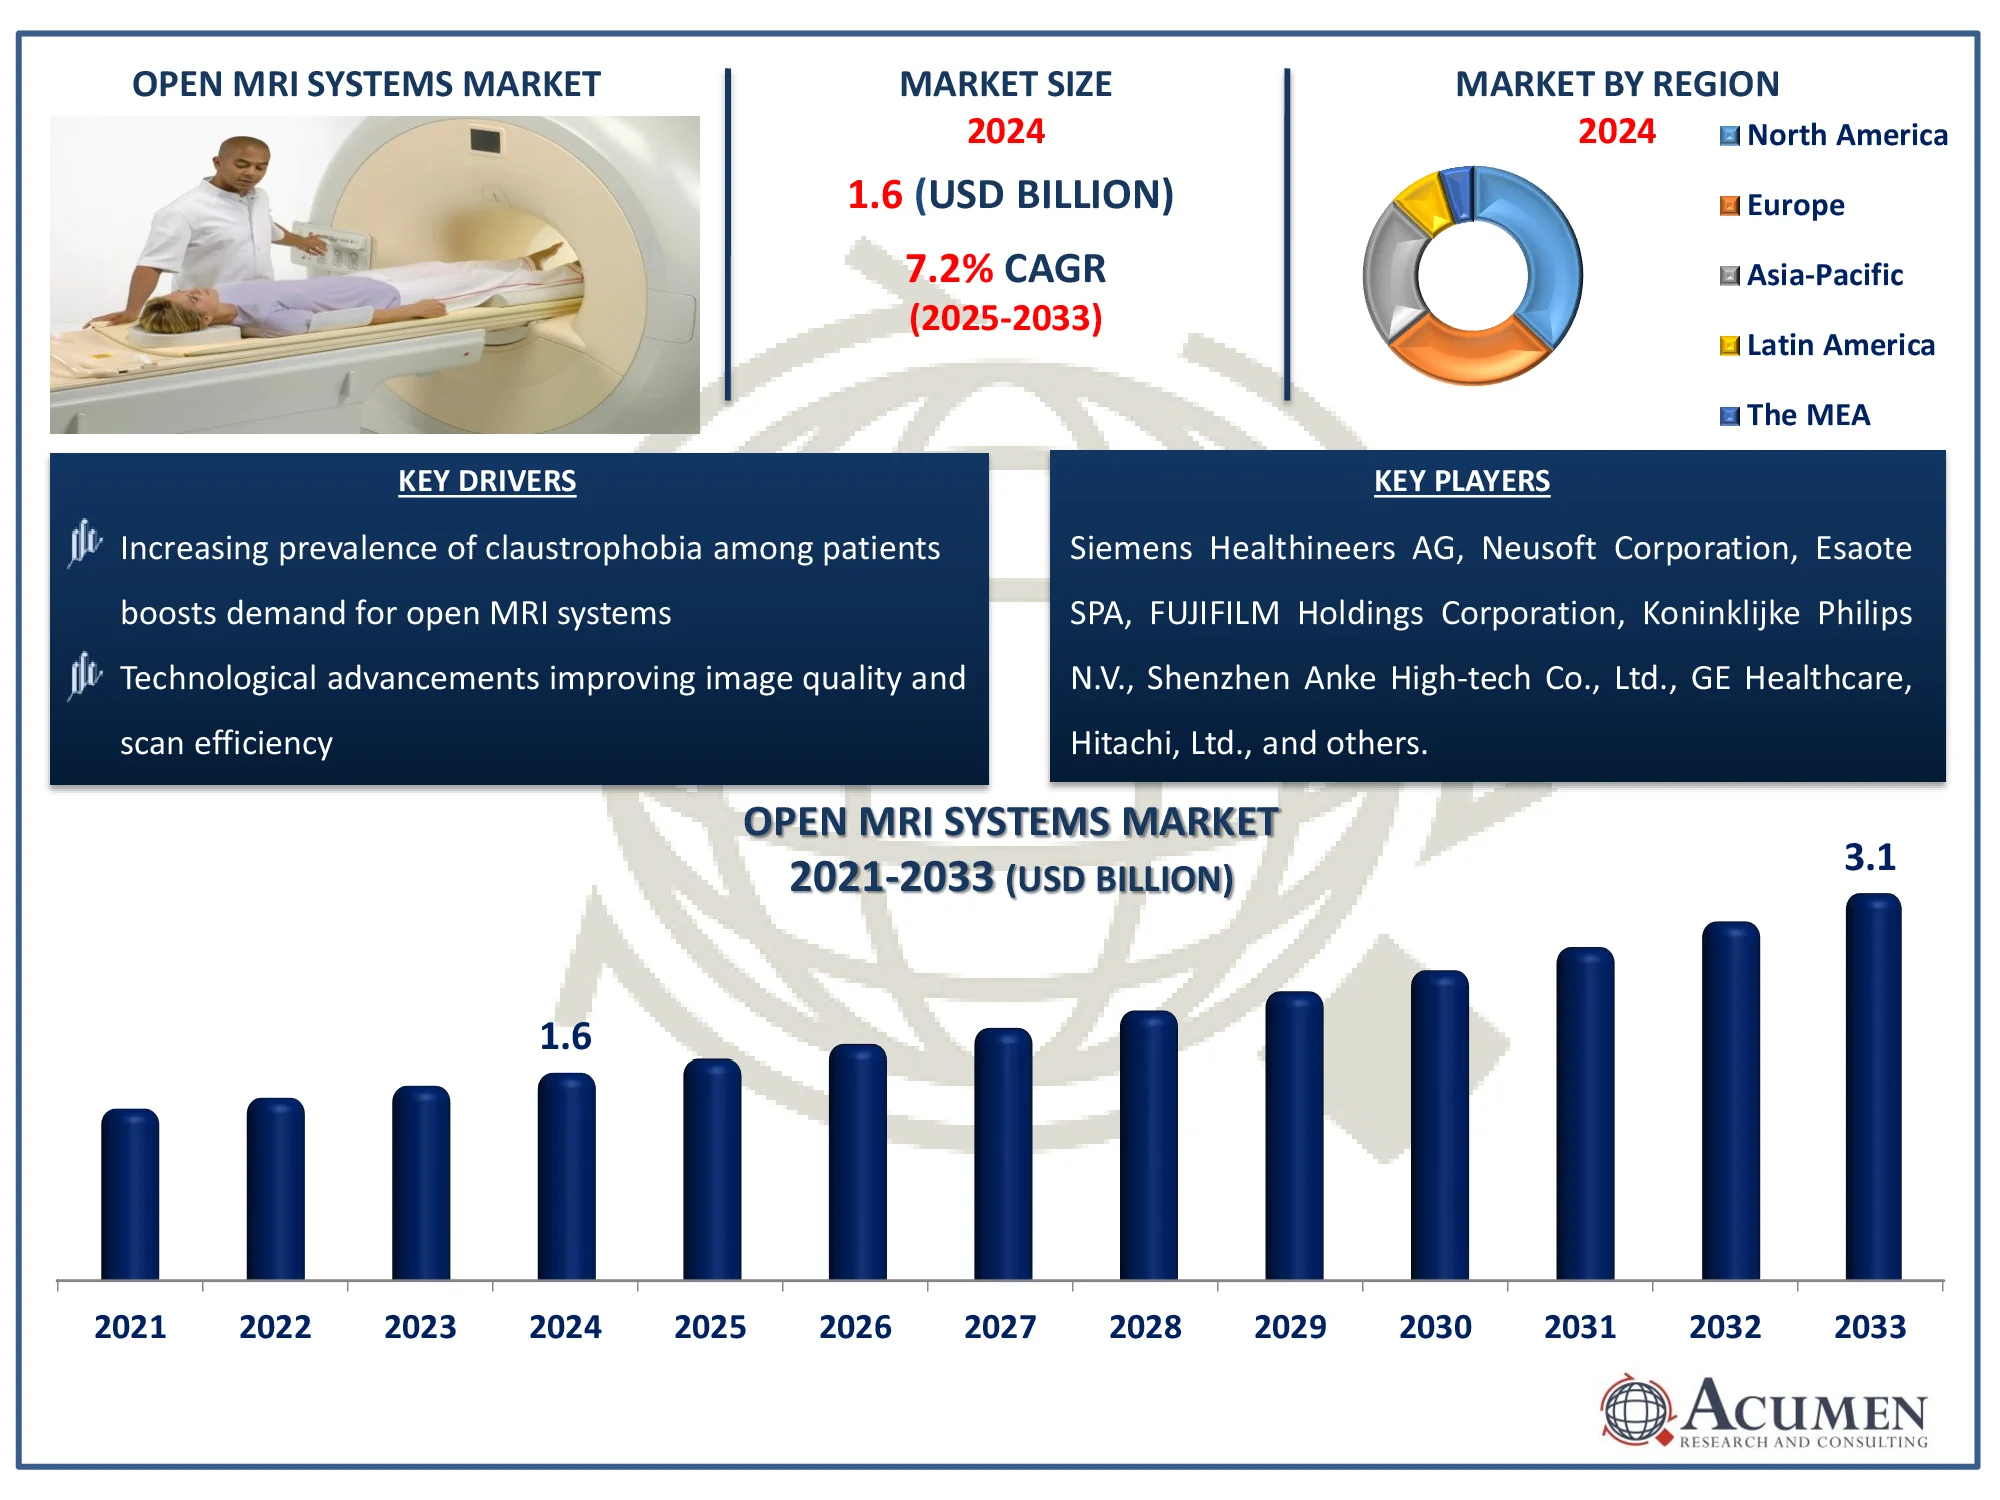
The Global Open MRI Systems Market Size accounted for USD 1.6 Billion in 2024 and is estimated to achieve a market size of USD 3.1 Billion by 2033 growing at a CAGR of 7.2% from 2025 to 2033.
Open MRI Systems Market Highlights
- The global open MRI systems market is projected to reach USD 3.1 billion by 2033, growing at a CAGR of 7.2% from 2025 to 2033
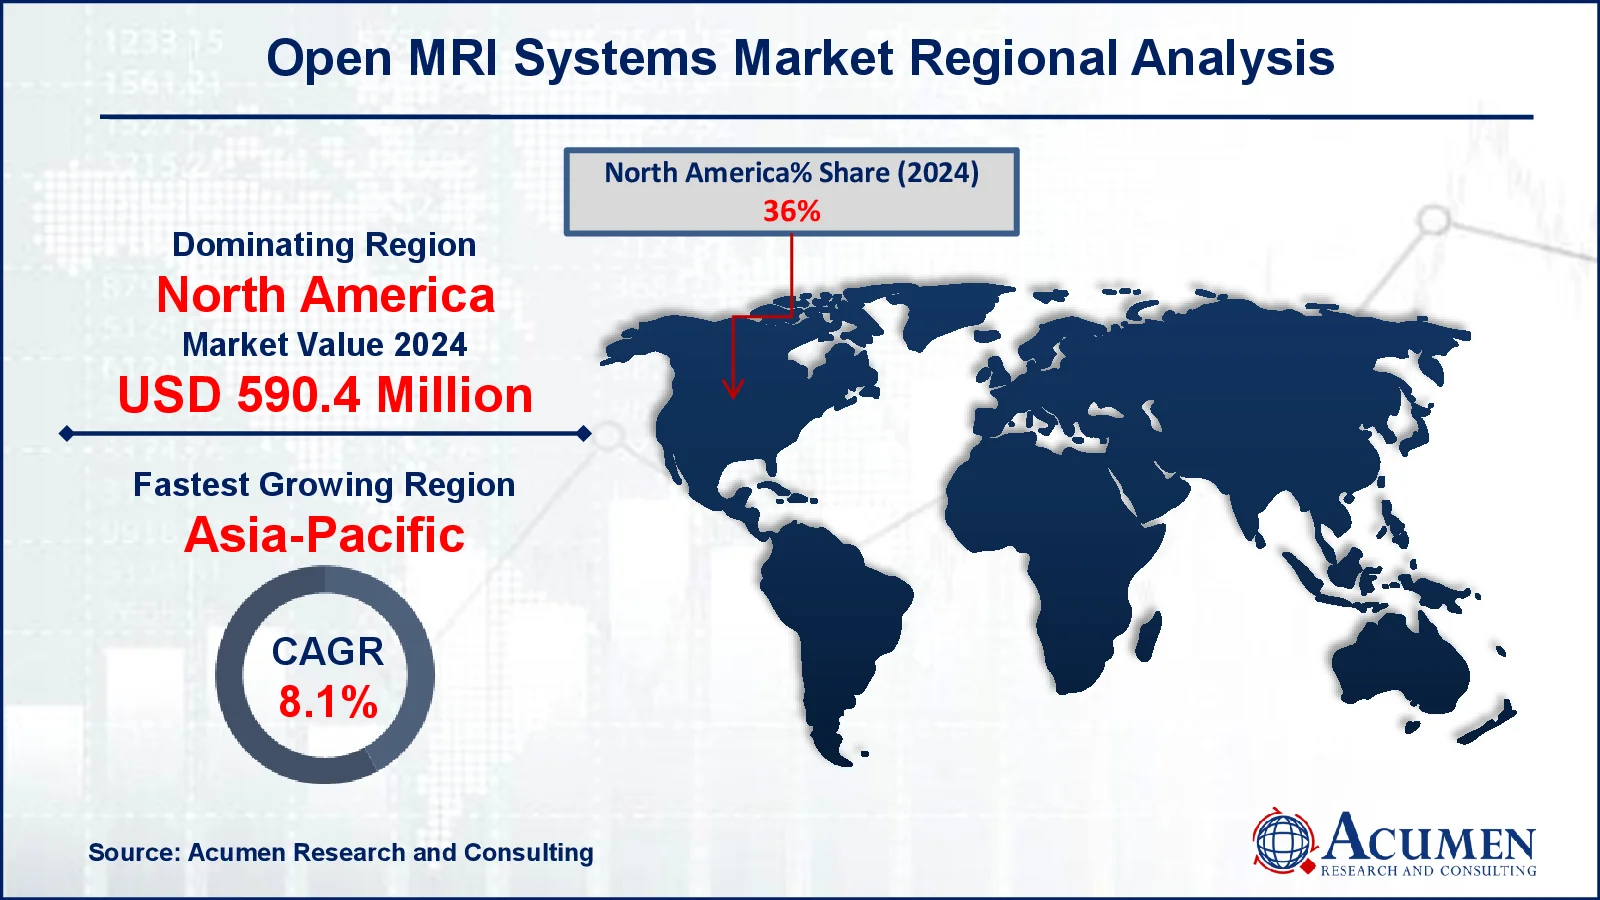
- In 2024, the North America open MRI systems market was valued at approximately USD 590.4 million
- According to the American Brain Foundation, Alzheimer’s and Parkinson’s disease collectively affect nearly 8 million people in the U.S., with cases expected to double by 2050
- The Asia-Pacific open MRI systems market is anticipated to grow at a CAGR of over 8.1% from 2025 to 2033
- The medium field strength sub-segment accounted for 46% of the market share in 2024
- Brain-related applications represented 20% of the market share in 2024
- Hospitals, as end-users, held a 38% market share in the open MRI systems market
- Advancements are leading to more compact and mobile open MRI machines, increasing accessibility and point-of-care applications is a popular market trend that fuels the industry demand

Magnetic resonance imaging (MRI) devices use a medical imaging technique called radiofrequency pulses to create detailed images of the body's physiological processes. An open MRI system, which has an open construction on three sides, improves patient comfort by offering a well-lit and less constrained imaging experience. Its innovative design allows for speedier, more comfortable inspections. Unlike closed MRI systems, open MRI machines have magnets at the top and bottom, which reduces the danger of claustrophobia and panic attacks while accommodating patients of all body types.
They have various benefits, including quieter operation, child-friendly features, technician flexibility, enhanced accessibility, and updated technology, fewer side effects, lower imaging artifacts, and cost savings. Open MRI systems come in low, medium, and high field strengths and their applications include brain, spine, abdomen, breast, and cardiac imaging, among others.
Global Open MRI Systems Market Dynamics
Market Drivers
- Increasing prevalence of claustrophobia among patients boosts demand for open MRI systems
- Technological advancements improving image quality and scan efficiency
- Growing adoption in pediatric and geriatric populations due to enhanced patient comfort
Market Restraints
- Higher cost compared to traditional closed MRI systems
- Lower magnetic field strength may result in reduced image resolution
- Limited availability of open MRI machines in smaller healthcare facilities
Market Opportunities
- Rising demand in emerging markets with expanding healthcare infrastructure
- Integration of AI and machine learning to enhance image processing
- Development of portable and lightweight open MRI systems for point-of-care applications
Open MRI Systems Market Report Coverage
|
Market |
Open MRI Systems Market |
|
Open MRI Systems Market Size 2024 |
USD 1.6 Billion |
|
Open MRI Systems Market Forecast 2033 |
USD 3.1 Billion |
|
Open MRI Systems Market CAGR During 2025 - 2033 |
7.2% |
|
Open MRI Systems Market Analysis Period |
2021 - 2033 |
|
Open MRI Systems Market Base Year |
2024 |
|
Open MRI Systems Market Forecast Data |
2025 - 2033 |
|
Segments Covered |
By Field Strength, By Application, By End-User, and By Geography |
|
Regional Scope |
North America, Europe, Asia Pacific, Latin America, and Middle East & Africa |
|
Key Companies Profiled Aviation |
Siemens Healthineers AG, Neusoft Corporation, Esaote SPA, FUJIFILM Holdings Corporation, Koninklijke Philips N.V., Shenzhen Anke High-tech Co., Ltd., GE Healthcare, Hitachi, Ltd., Alltech Medical Systems, and Canon Medical Systems Corporation. |
|
Report Coverage |
Market Trends, Drivers, Restraints, Competitive Analysis, Player Profiling, Covid-19 Analysis, Regulation Analysis |
Open MRI Systems Market Insights
The increasing number of MRI operations and the global incidence of chronic disorders are important factors driving open magnetic resonance imaging (MRI) systems market expansion. According to the American College of Cardiology, one out of every two patients with CIEDs (Cardiac Implantable Electronic Device) required an MRI after implantation. According to the 2024 SCMR expert consensus, CIED patients are divided into three risk groups for MRI-related complications: MRI-conditional CIED systems, non-MRI-conditional systems without abandoned, fractured, or epicardial leads (including MRI-conditional devices with non-MRI-conditional components), and patients with any CIED with abandoned, fractured intracardiac, or epicardial leads. The increasing demand for MRI scans in high-risk CIED patients is driving demand for safer imaging solutions, with open MRI systems emerging as a favored choice due to their reduced magnetic fields and improved patient comfort, fueling open system MRI market growth.
The increasing prevalence of malignancies and neurological illnesses like Alzheimer's and Parkinson's disease is driving up demand for open MRI systems. According to Memorial Sloan Kettering Cancer Center, more men and women in their prime years are being diagnosed with dangerous malignancies such as colorectal, breast, prostate, uterine, gastric, and pancreatic. Forecasts anticipate a 30% global increase in cancer cases among this age group between 2019 and 2030, raising the demand for MRI scans for early diagnosis and surveillance, therefore accelerating open system MRI market growth.
Furthermore, the increased emphasis on early detection to enable timely treatment and better patient outcomes is driving market growth. The introduction of new MRI products by key industry players, particularly in emerging and unexplored areas, is driving open system MRI market expansion.
However, the expensive cost of open MRI equipment remains a substantial barrier to widespread implementation. Furthermore, frequent product recalls constitute additional barrier to market growth. Nonetheless, ongoing R&D activities by key industry participants are projected to fuel demand and innovation in the future years.
 Open MRI Systems Market Segmentation
The worldwide market for open MRI systems is split based on treatment, application, end-user, and geography.
Open MRI Systems Market By Field Strength
- Low
- Medium
- High
According to open MRI systems industry analysis, medium field strength segment leads market, accounting for 46% of the total in 2024. This is owing to its excellent mix of image quality, scan speed, and cost-effectiveness, which makes it a popular choice for diagnostic imaging. Furthermore, advances in imaging technology have improved the performance of medium field MRI, broadening its applicability in a variety of medical specialties.
Low-field open MRI systems growing rapildy in 2024. This segment holds the significant share due to its numerous advantages, including an open design, lower initial investment and operational costs, reduced fringe fields, minimized MR artifacts, and lower energy deposition in tissues.
Open MRI Systems Market By Application
- Brain
- Spine
- Abdominal
- Breast
- Cardiac
- Others
According to open MRI systems industry analysis, by application, the brain segment dominated the market in 2024, accounting for the largest share. The rising prevalence of neurological illnesses, fueled by lifestyle changes and growing environmental health concerns, is a major reason driving its expansion. According to the World Health Organization (WHO), neurological diseases affect more than one in every three individuals, making them the largest cause of illness and disability around the world. Additionally, the growing geriatric population contributes to the segment's growth.
Open MRI Systems Market By End-user
- Hospital
- Imaging Centers
- Ambulatory Surgical Centers
- Others
According to open MRI systems market forecast, hospitals dominate as the leading end-user because of their large patient population and extensive diagnostic capabilities. Their well-established infrastructure enables the integration of open MRI technology, which caters to a wide range of medical demands, including neurology, orthopedics, and cardiology. The growing emphasis on early and accurate diagnosis, combined with the increasing prevalence of chronic diseases, is driving hospital adoption of open MRI systems. Furthermore, hospitals benefit from government financing and large-scale expenditures, which allow them to purchase and maintain high-end imaging equipment.
Open MRI Systems Market Regional Outlook
North America
- U.S.
- Canada
Europe
- U.K.
- Germany
- France
- Spain
- Rest of Europe
Asia-Pacific
- India
- Japan
- China
- Australia
- South Korea
- Rest of Asia-Pacific
Latin America
- Brazil
- Mexico
- Rest of LATAM
The Middle East & Africa
- South Africa
- GCC Countries
- Rest of the Middle East & Africa (ME&A)
 Open MRI Systems Market Regional Analysis
In terms of regional segments, North America dominated the regional open MRI systems market in 2024, with the biggest share owing to its strong healthcare infrastructure and extensive access to cutting-edge medical technology. The presence of local industry players, such as American MRI Family (founded in 2007), has substantially aided market growth. Innovations such as the Open High-Field MRI, which provides a 270-degree unobstructed view for improved patient comfort, have accelerated expansion. Furthermore, in January 2023, Esaote North America, Inc. announced the Magnifico Vet Open MRI system, a customized imaging solution built for veterinary hospitals, broadening market opportunities. Increased investments by big corporations to strengthen their market position continue to boost regional growth.
On the other hand, the Asia-Pacific area is expected to develop the quickest throughout the forecast period, driven by rising disposable income, greater healthcare spending, and government efforts to upgrade medical facilities in emerging economies such as China and India. A significant milestone in this region was the May 2023 opening of Siemens Healthineers AG's MRI production facility in India, which is supported by a USD 15.5 million investment plan that extends until 2025. This strategic investment will improve MRI availability and usage across the Asian region, increasing market growth.
Open MRI Systems Market Players
Some of the top open MRI systems companies offered in our report include Siemens Healthineers AG, Neusoft Corporation, Esaote SPA, FUJIFILM Holdings Corporation, Koninklijke Philips N.V., Shenzhen Anke High-tech Co., Ltd., GE Healthcare, Hitachi, Ltd., Alltech Medical Systems, and Canon Medical Systems Corporation.
Frequently Asked Questions
What was the market size of the global Open MRI Systems in 2024?
The market size of open MRI Systems was USD 1.6 Billion in 2024.
What is the CAGR of the global Open MRI Systems market from 2025 to 2033?
The CAGR of open MRI systems is 7.2% during the analysis period of 2025 to 2033.
Which are the key players in the Open MRI Systems market?
The key players operating in the global market are including Siemens Healthineers AG, Neusoft Corporation, Esaote SPA, FUJIFILM Holdings Corporation, Koninklijke Philips N.V., Shenzhen Anke High-tech Co., Ltd., GE Healthcare, Hitachi, Ltd., Alltech Medical Systems, and Canon Medical Systems Corporation.
Which region dominated the global Open MRI Systems market share?
North America held the dominating position in open MRI systems industry during the analysis period of 2025 to 2033.
Which region registered fastest CAGR from 2025 to 2033?
Asia-Pacific region exhibited fastest growing CAGR for market of open MRI systems during the analysis period of 2025 to 2033.
What are the current trends and dynamics in the global Open MRI Systems industry?
The current trends and dynamics in the open MRI systems industry include increasing prevalence of claustrophobia among patients boosts demand for open MRI systems, technological advancements improving image quality and scan efficiency, and growing adoption in pediatric and geriatric populations due to enhanced patient comfort.
Which field strength held the maximum share in 2024?
The medium field strength held the maximum share of the open MRI systems industry.


