Lignans Market
Published :
Report ID:
Pages :
Format :
Lignans Market
Report Coverage
- Industry Dynamics
- Market Size and Forecast Data
- Segment Analysis
- Competitive Landscape
- Regional Analysis with a Niche Focus on Country-Level Data
- High Level Analysis - Porter's, PESTEL, Value Chain, etc.
- Company Profiles of Key Players
- Option to Customize the Report As Per Your Specific Need
Request Sample Report
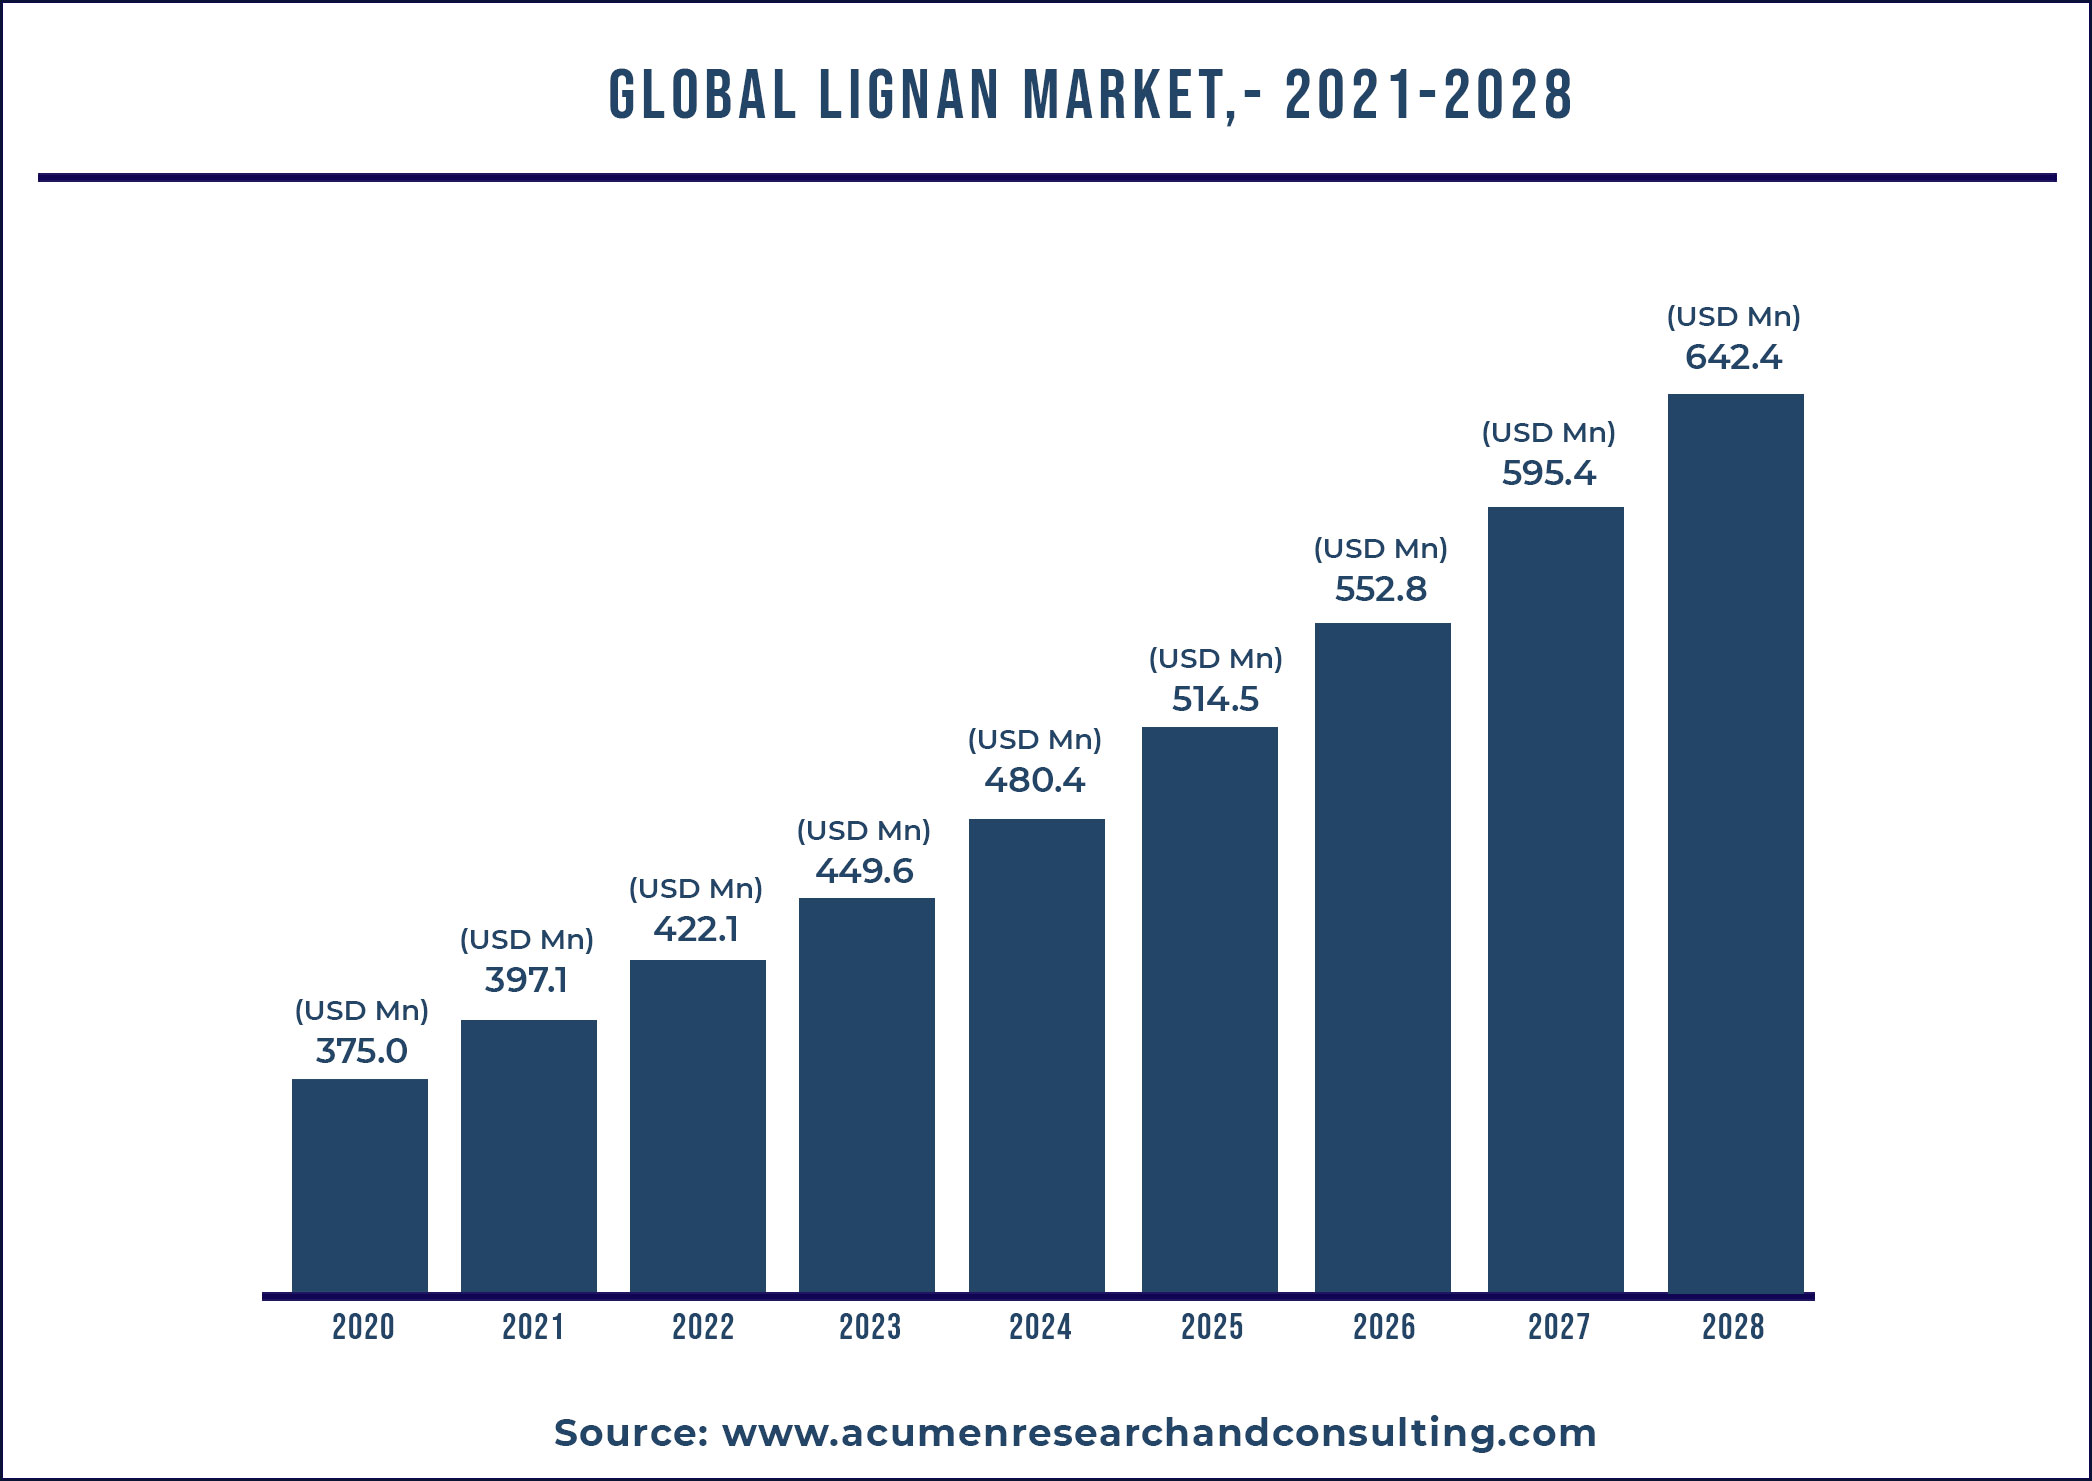
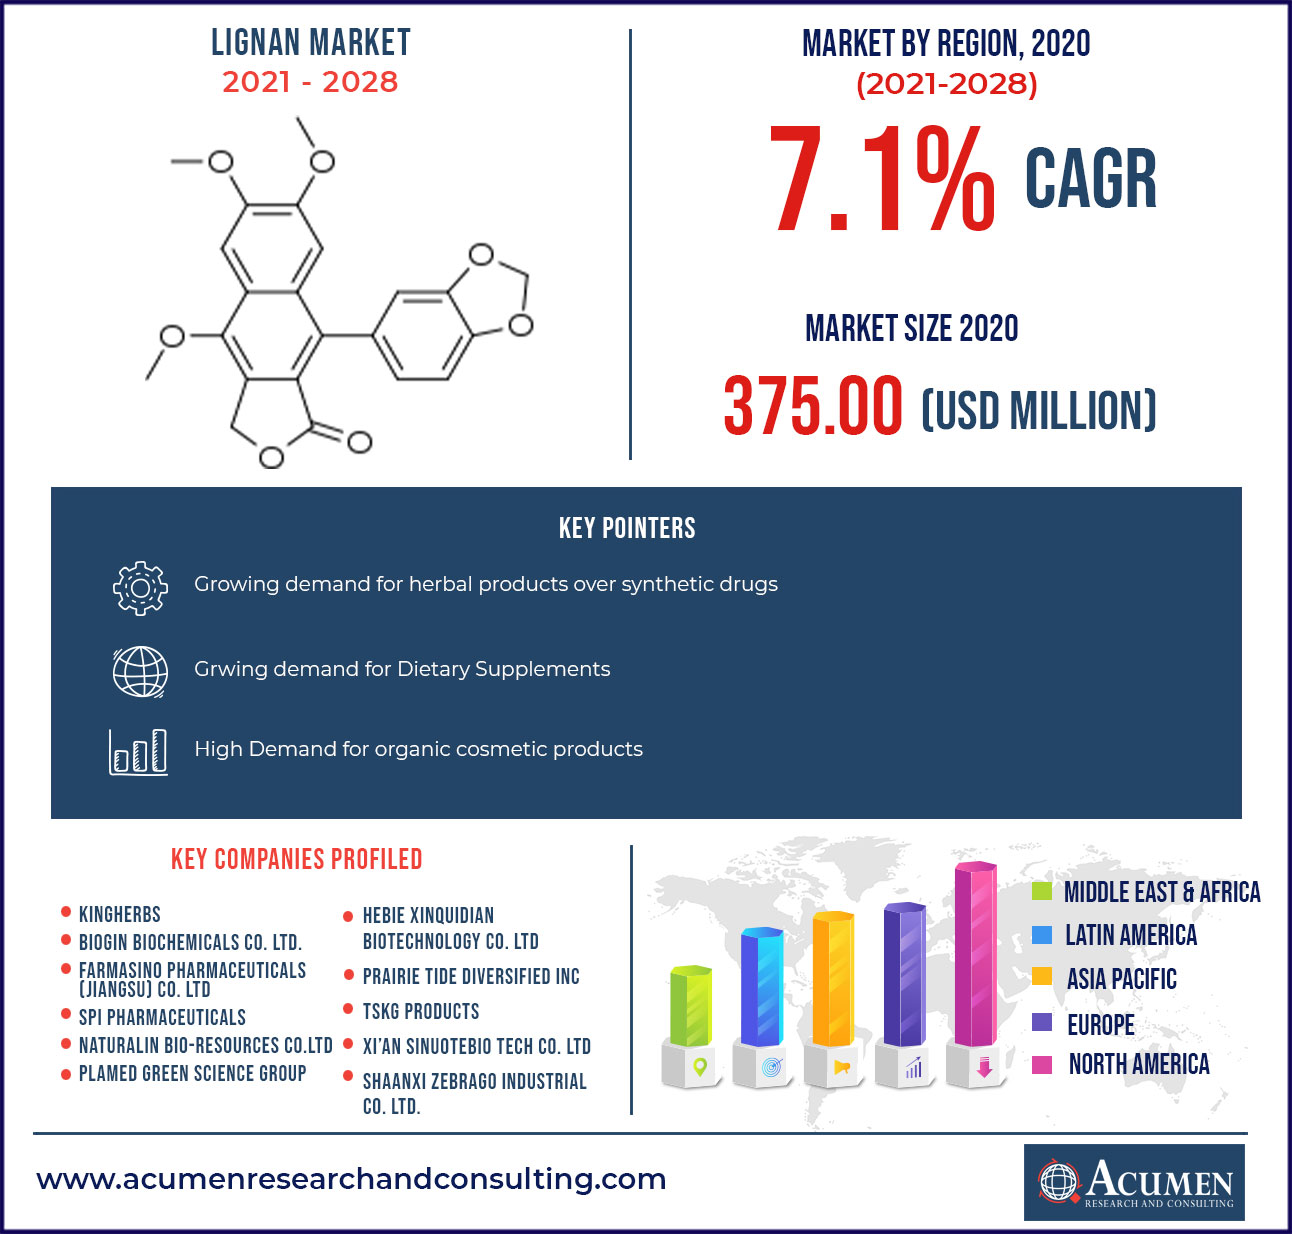
The global lignans market size was valued at USD 375.0 million in 2020 and is expected to grow at a compound annual growth rate (CAGR) of 7.1% from 2021 to 2028.
Growing demand for herbal products over synthetic drugs and the growing trend in food and beverage industry are driving the market growth.
Lignans are a group of secondary metabolites found naturally in plants products such as cereals, vegetables, cereals and other fiber rich foods. Lignans are said to be effective in cancer and diabetic patients due to its defense against pathogenic fungi and bacteria, thereby eliminating the risk of secondary infections in these patients. Lignans also help in boosting the immune systems of an individual as it is beneficial for human gut. Growing awareness regarding healthy and organic food products for improved health outcomes and increased products of lignin rich products are driving the market for lignans.

Market Dynamics
Non-alcoholic beverages, such as tea, coffee, etc. contain the highest content of lignan. The concentration of lignan varies by the type of tea and coffee such as tea contains ranging from 0.0392-0.0771mg/100g and coffee contains ranging from 0.0187-0.0313mg/100g. While alcoholic beverages such as red wine contains of 0.080ul/100ml lignan on average; white wine contains 0.022ul/100ml.
It is also observed that the lignan also has the anti-oxidant ability for the prevention of various disorders, including cardiovascular disease and cancer. Traditionally lignans have showed health benefit such as lowered heart diseases, menopausal symptoms, osteoporosis and breast cancer.
There are some other rich sources of the lignan which are flaxseed and sesame seeds which can be utilized commercially for the fortification of food products and in the pharmaceutical industry. Soy seed, rapeseed, pumpkin seed, sunflower seed, wheat, oats, rye, barley, legumes, beans, berries, and vegetables are also other sources of lignan.
The rapid increase in use of lignan in cosmetics, pharmaceuticals, animal feed industry, and food and also increase in nutraceutical and functional foods are the factors which are going to drive the market.
Report coverage
| Market | Lignan Market |
| Analysis Period | 2017 - 2028 |
| Base Year | 2020 |
| Forecast Data | 2021 - 2028 |
| Segments Covered | By Source, By Application, And By Geography |
| Regional Scope | North America, Europe, Asia Pacific, Latin America, and Middle East & Africa |
| Key Companies Profiled |
Biogin Biochemicals Co. Ltd., FarmaSino Pharmaceuticals (Jiangsu) Co. Ltd., Kingherbs, SPI Pharma, Naturalin Bio-resources co.ltd., Plamed Green Science Group, Hebie Xinquidian Biotechnology co. ltd., Prairie Tide Diversified Inc., TSKG Products, LLC, Xi’an Sinuotebio Tech Co. Ltd., Shaanxi Zebrago Industrial Co. Ltd. |
| Report Coverage |
Market Trends, Drivers, Restraints, Competitive Analysis, Player Profiling, Regulation Analysis |
| Customization Scope |
10 hrs of free customization and expert consultation |
Food and Beverages held the largest share by application
Consumption of lignan varies geographically due to some dietary methods of different regions. For instance, the traditional Mediterranean diet is pre-dominantly plant based diet with high intake of unprocessed cereals, legumes, vegetables, nuts, fruits. Indian diet contains various types of categories of food products including fish, grapes, chocolates, oil, tea, coffee, biscuits and bread. Due to high lignan content, the Indian mulberry has been extensively traditionally utilized in the treatment of cancer, diabetes, high blood pressure, diarrhea, headache, inflammation, etc. The typical content of Indian diet is sesame, both sesame seeds and oil is rich in lignan.
Due to dietary habits of the population which have traditionally influenced diets and the traditional methods to cure diseases by natural process is increasing along with demand for rich contents of natural ingredients is also growing. The rising occurrence of chronic and lifestyle related diseases, in confluence the considerable shift towards herbal drugs, represent one of the key factor boosting the global lignans market growth.
Cereals and Grains lead the Sources segment
The cereals and grains segments dominated the market by sources accounting for US$ 168 Mn in 2020. Common sources of lignans from cereals and grain include corns, oats, barley and rye. These sources have anti-inflammatory and antioxidant properties which make them beneficial for human consumption. Growing application of natural sources in cosmetics is also driving the demand for cereals and grains as natural source of lignans

Competitive Landscape
Some of the key players offered in the report include Biogin Biochemicals Co. Ltd., FarmaSino Pharmaceuticals (Jiangsu) Co. Ltd., Kingherbs, SPI Pharma, Naturalin Bio-resources co.ltd., Plamed Green Science Group, Hebie Xinquidian Biotechnology co. ltd., Prairie Tide Diversified Inc., TSKG Products, LLC, Xi’an Sinuotebio Tech Co. Ltd., Shaanxi Zebrago Industrial Co. Ltd.
Market Segmentation
Market By Source
- Oilseed
- Cereals and Grains
- Plant Resins
- Others
Market By Application
- Food and Beverages
- Functional food
- Functional beverages
- Dietary Supplements
- Others
- Cosmetics & Toiletries
- Hair care
- Skincare
- Toiletries
- Others
- Pharmaceuticals
- Animal Nutrition
Market By Geography
North America
- U.S.
- Canada
Europe
- U.K.
- Germany
- France
- Spain
- Rest of Europe
Latin America
- Brazil
- Mexico
- Rest of Latin America
Asia-Pacific
- China
- Japan
- India
- Australia
- South Korea
- Rest of Asia-Pacific
Middle East & Africa
- GCC
- South Africa
- Rest of Middle East & Africa
Frequently Asked Questions
How much was the estimated value of the global lignan market in 2020?
The estimated value of global Lignan market in 2020 accounted to be US$ 375.0 mn.
What will be the projected CAGR for global lignan market during forecast period of 2021 to 2028?
The projected CAGR of Lignan market during the analysis period of 2021 to 2028 is 7.1%
Which are the prominent competitors operating in the market?
The prominent players of the global Lignan market market involve Biogin Biochemicals Co. Ltd., FarmaSino Pharmaceuticals (Jiangsu) Co. Ltd., Kingherbs, SPI Pharma, Naturalin Bio-resources co.ltd., Plamed Green Science Group, Hebie Xinquidian Biotechnology co. ltd., Prairie Tide Diversified Inc., TSKG Products LLC, Xi�an Sinuotebio Tech Co. Ltd., Shaanxi Zebrago Industrial Co. Ltd. and others
Which region held the dominating position in the global lignan market?
North America held the dominating share for lignan market during the analysis period of 2021 to 2028
Which region exhibited the fastest growing CAGR for the forecast period of 2021 to 2028?
Asia pacific region exhibited fastest growing CAGR for lignan market during the analysis period of 2021 to 2028
What are the current trends and dynamics in the global lignan market?
Growing demand for herbal products over synthetic drugs and the growing organic trend in food and beverage industry drive the market growth.
By Source, which sub-segment held the maximum share?
Based on Source, Cereals and Grains segment held the maximum share for lignan market in 2020


