Introduction
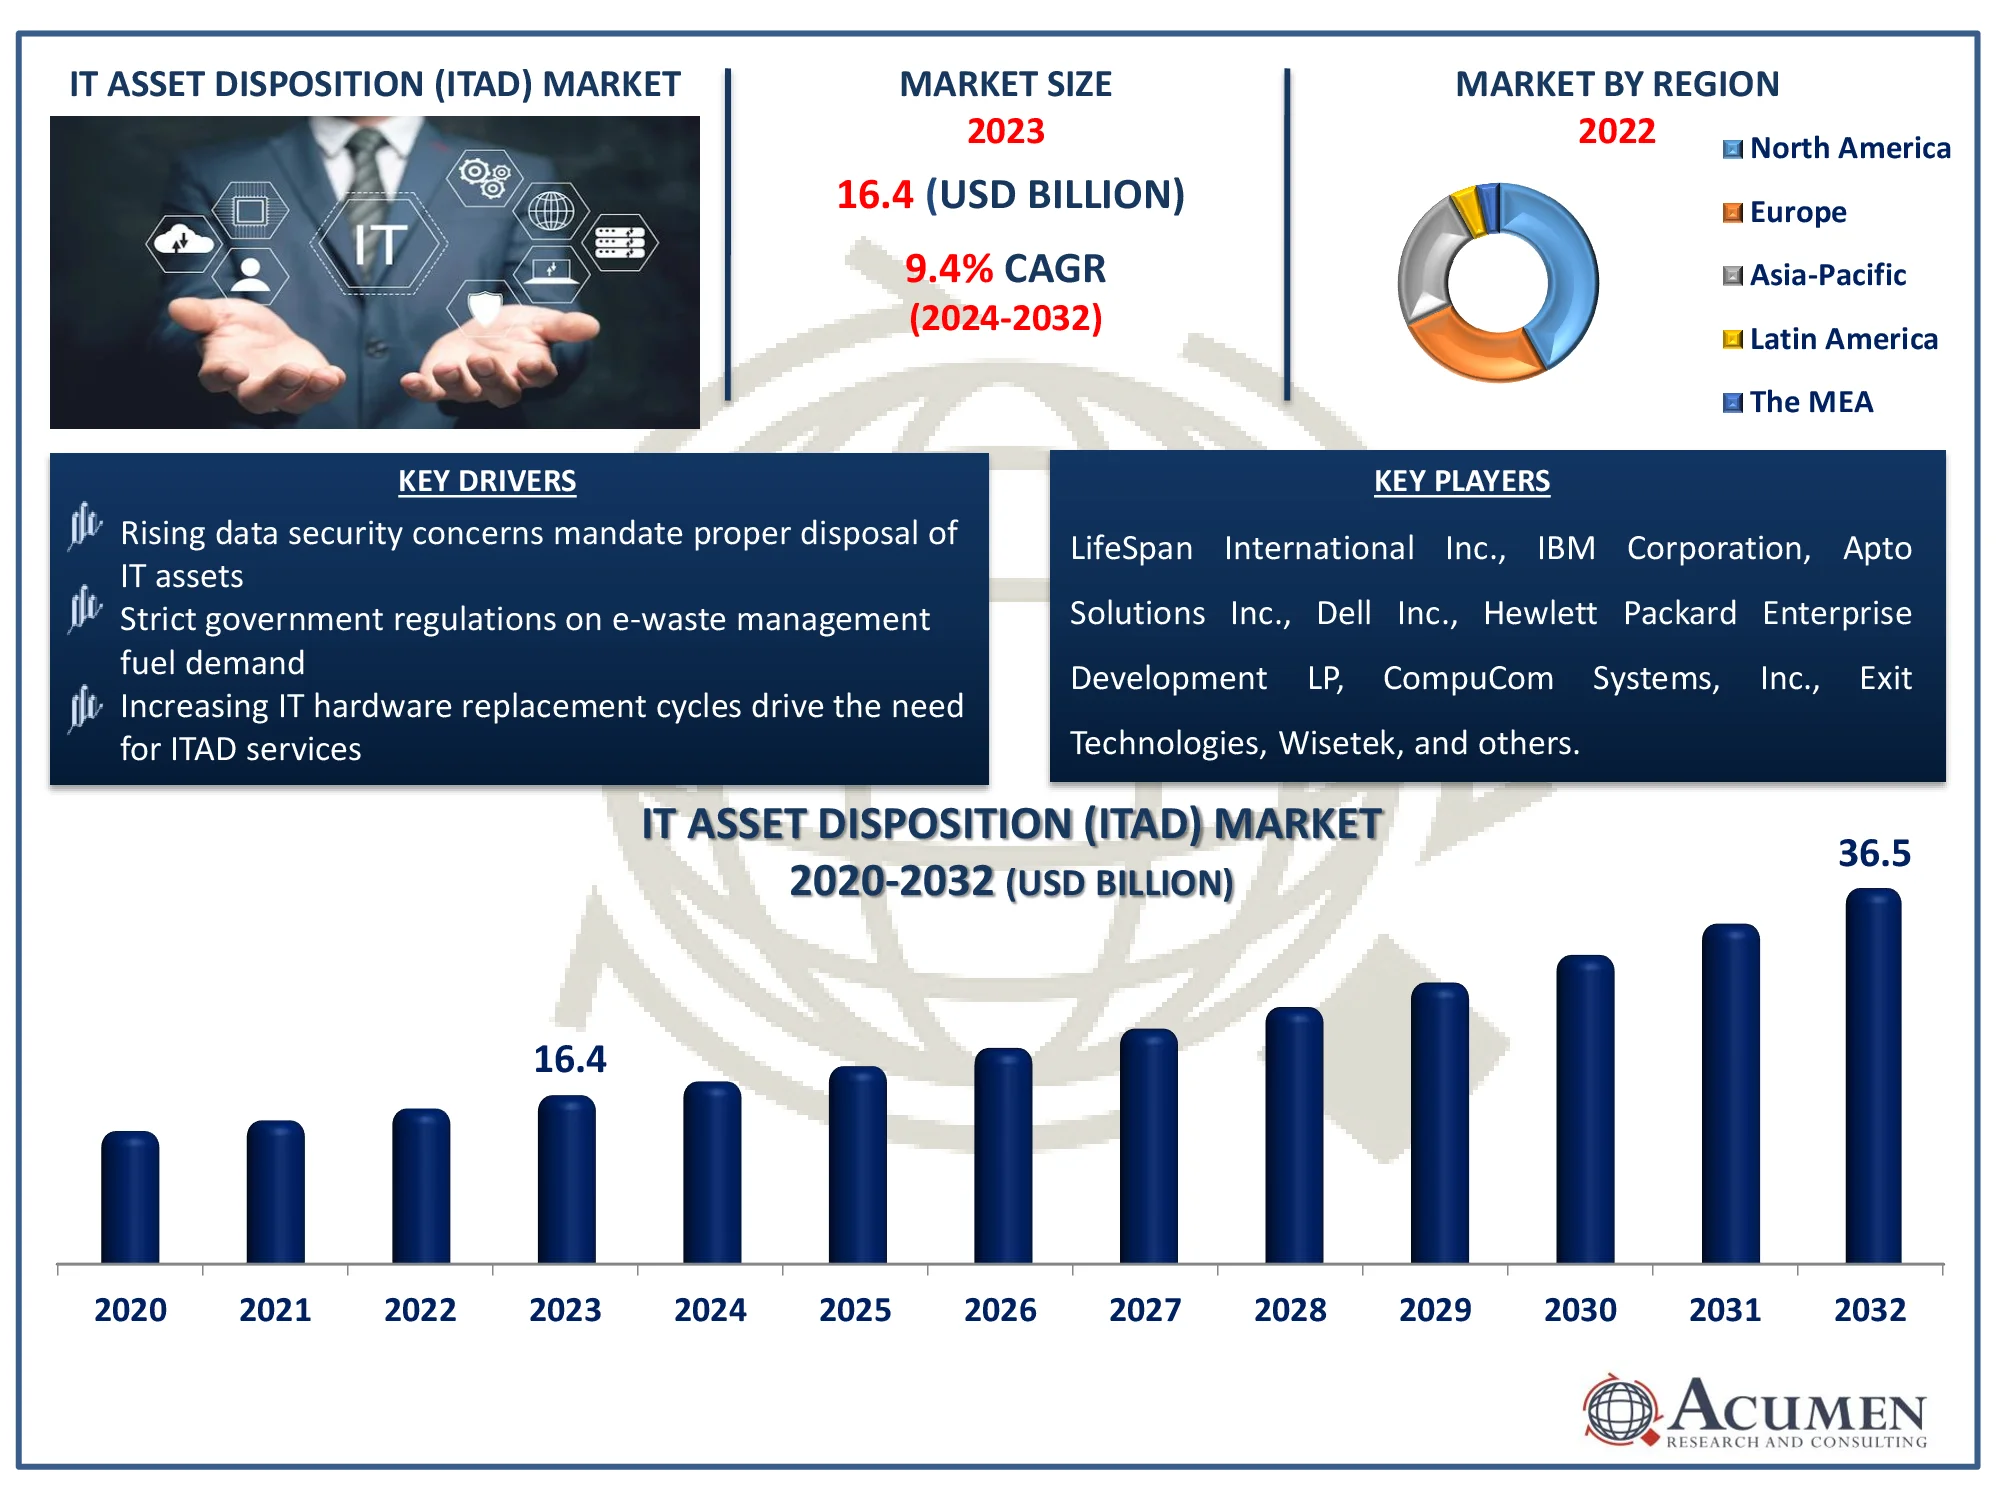
The global IT asset disposition (ITAD) Market is projected worth US$ 22,150.4 million by 2026 and the market is projected to showcase 6.9% CAGR during the forecast period. The IT asset disposition (ITAD)market is driven by advancement in IT industry and rise in usage of electronic devices globally.
Market Dynamics
The main development of the IT asset disposition (ITAD) market includes the changing IT industries, rising usage of electronic devices such as laptops, tablets, and mobiles, and increasing small and medium enterprises are the major factors driving the demand for ITAD market.However, the high cost of investment and lack of awareness of the benefits associated with the IT asset disposable among users are the restraining factors that are hindering the growth of IT asset disposition (ITAD) market.
Market Insights
The IT industry has gone rapid advancement due to the introduction of various technologies such as cloud computing, cognitive computing, Big Data analytics and Internet of Things (IoT) that are helping to expand businesses globally.The growing usage of ICT devices combined with the declining life cycle of IT products is expected to generate the need for businesses to dispose of the electronic waste securely. Therefore, the significant increase in e-waste generation is disturbing the environment, and to minimize these side effects of electronic waste, there is an increase in demand for IT asset disposition (ITAD) across the globe.
Market Classification
The global IT asset disposition (ITAD) market is segmented into asset type, service, enterprise size, end-use industry, and region. On the basis of asset type, the global IT asset disposition (ITAD) market is segmented into hardware, computer/laptops, mobile devices, peripherals, storages, servers, and others. On the basis of service, the global IT asset disposition (ITAD) market is segmented into data sanitation/destruction, recycling, remarking, asset discovery, and reverse logistics. On the basis of enterprise size, the global IT asset disposition (ITAD) market is segmented into small enterprises, medium enterprises, and large enterprises. On the basis of end-use industry, the global IT asset disposition (ITAD) market is segmented into BFSI, government & public, IT & Telecom, aerospace & defense, healthcare, energy & utilities, media and entertainment, data centers, and others. On the basis of the region, the global IT asset disposition (ITAD) market is segmented into North America, Latin America, Europe, Asia Pacific, and Middle East & Africa.
Based on the end-use industry, the global IT asset disposition (ITAD) market can majorly be segmented into eightsub-segments, which are BFSI, government & public, IT & Telecom, aerospace & defense, healthcare, energy & utilities, media and entertainment, and data centers. The IT & Telecom sub-segment is projected to dominate the global IT asset disposition (ITAD) market as there is an increase in the number of companies that offer mobile devices to the employees for in-house communication which can be one of the driving forces that can boost the IT asset disposition (ITAD) market significantly.
Regional Insights
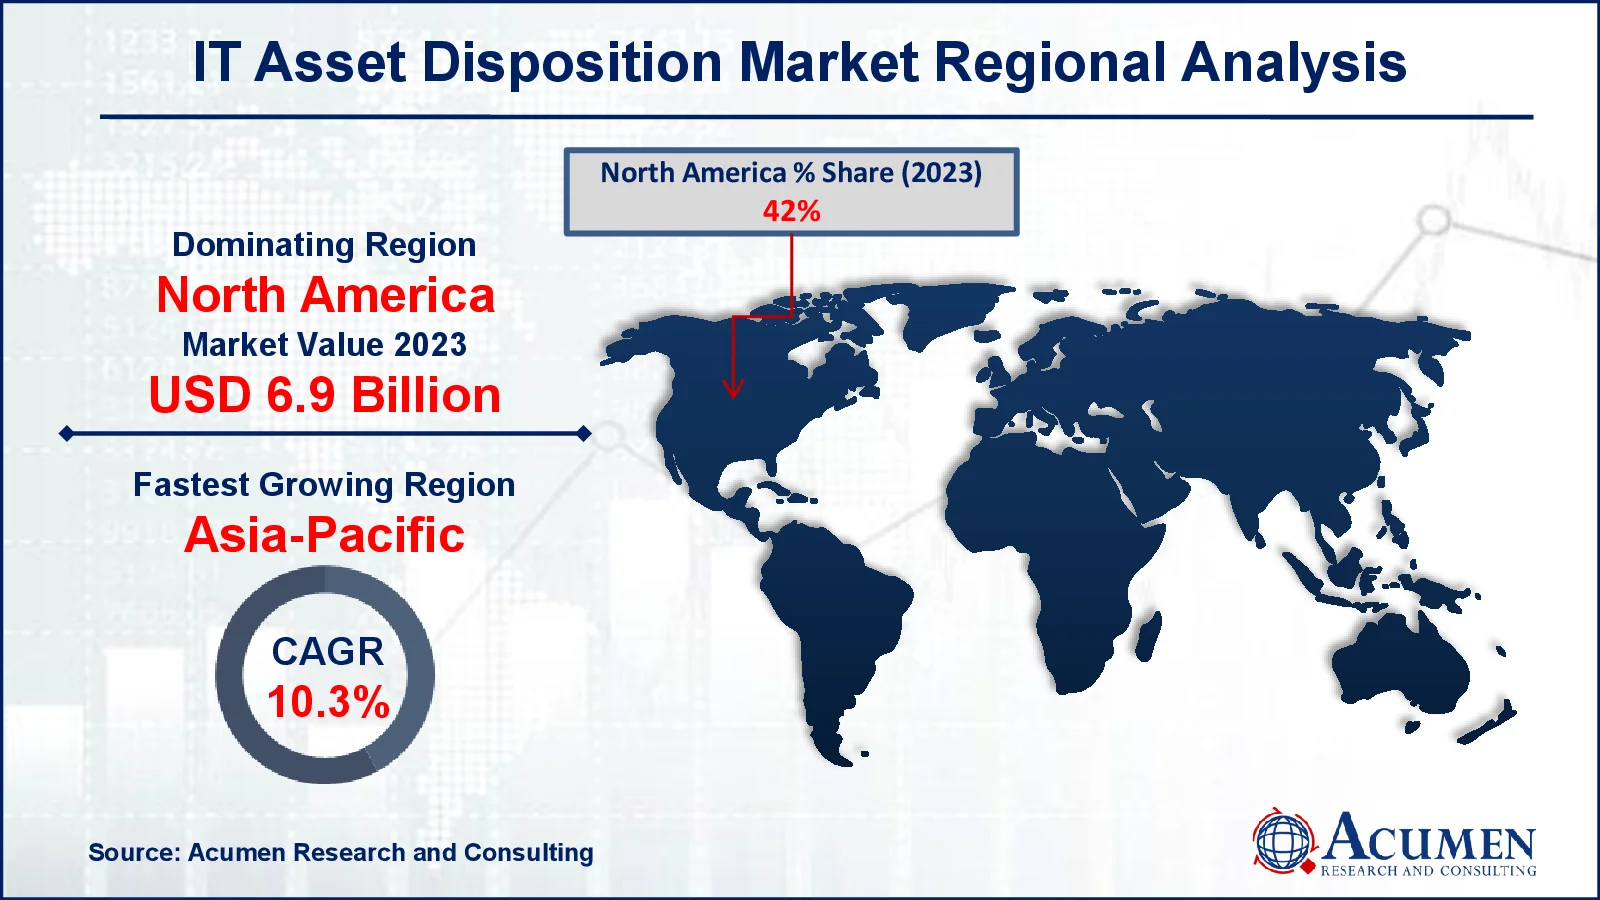
The North America region is expected to hold a major share of the global IT asset disposition (ITAD) market followed by Europe and Asia Pacific region. The dominance of North America is owing to the substantial growth in the IT industry; and also the region is predicted to remain as the leading market for IT asset disposition (ITAD) in the coming years. Another reason is the presence of strict government regulations that is promising organizations to adopt the solutions for the safe disposal of IT assets. The Asia Pacific region is estimated to grow at a significant CAGR during the forecast period.
Market Participants
Some of the major players associated with the IT asset disposition (ITAD) market are Apto Solutions, Dell, Inc., Exit Technologies, GreenTekReman Pvt. Ltd, ICEX Ltd, Iron Mountain, Inc., LifeSpan International, Inc., MultiTek, LLC., TBS Industries, The Centrics Group, Arrow Electronics, EOL IT Services, Wisetek, Gigacycle, HP Ltd., Ingram Micro, Inc. (Formerly CloudBlue), ITRenew, Inc., Maxicom Network, Inc., Sims Recycling Solutions, Inc., and TES-AMM Pte Ltd. (Formerly Dataserv Group), etc.
Key manufacturers in the global IT asset disposition (ITAD) market are focused on investing heavily in research and development activities in order to offer innovative IT asset disposition (ITAD) solution for safe disposal of electronic waste.Moreover, the key players in the global IT asset disposition (ITAD) market are concentrating mainly on the continuous innovation, merger, and acquisition and developing strategic partnerships with other established players in order to expand their business geographically as well as to gain maximum market share.
Market Segmentation
Market By Asset Type
- Hardware
- Computer/Laptops
- Mobile Devices
- Peripherals
- Storages
- Servers
- Others
Market By Service
- Data Sanitation / Destruction
- Recycling
- Remarking
- Asset Discovery
- Reverse Logistics
Market By Enterprise Size
- Small Enterprises
- Medium Enterprises
- Large Enterprises
Market By End-use Industry
- BFSI
- Government & Public
- IT & Telecom
- Aerospace & Defense
- Healthcare
- Energy & Utilities
- Media and Entertainment
- Data Centers
- Others
Market By Geography
- North America
- Europe
- UK
- Germany
- France
- Rest of Europe
- Asia-Pacific
- China
- Japan
- India
- Australia
- Rest of Asia-Pacific
- Latin America
- Brazil
- Chile
- Rest of Latin America
- Middle East and Africa (MEA)
- South Africa
- Saudi Arabia
- Rest of MEA
CHAPTER 1. INDUSTRY OVERVIEW
1.1. Definition and Scope
1.1.1. Definition of IT Asset Disposition (ITAD)
1.1.2. Market Segmentation
1.1.3. List of Abbreviations
1.2. Summary
1.2.1. Market Snapshot
1.2.2. IT Asset Disposition (ITAD) Market By Asset Type
1.2.2.1. Global IT Asset Disposition (ITAD) Market Revenue and Growth Rate Comparison By Asset Type (2015-2026)
1.2.2.2. Global IT Asset Disposition (ITAD) Market Revenue Share By Asset Type in 2017
1.2.2.3. Hardware
1.2.2.4. Computer/Laptops
1.2.2.5. Mobile Devices
1.2.2.6. Peripherals
1.2.2.7. Storages
1.2.2.8. Servers
1.2.2.9. Others
1.2.3. IT Asset Disposition (ITAD) Market By Service
1.2.3.1. Global IT Asset Disposition (ITAD) Market Revenue and Growth Rate Comparison By Service (2015-2026)
1.2.3.2. Global IT Asset Disposition (ITAD) Market Revenue Share By Service in 2017
1.2.3.3. Data Sanitation / Destruction
1.2.3.4. Recycling
1.2.3.5. Remarking
1.2.3.6. Asset Discovery
1.2.3.7. Reverse Logistics
1.2.3.8. Others
1.2.4. IT Asset Disposition (ITAD) Market By Enterprise Size
1.2.4.1. Global IT Asset Disposition (ITAD) Market Revenue and Growth Rate Comparison By Enterprise Size (2015-2026)
1.2.4.2. Global IT Asset Disposition (ITAD) Market Revenue Share By Enterprise Size in 2017
1.2.4.3. Small Enterprises
1.2.4.4. Medium Enterprises
1.2.4.5. Large Enterprises
1.2.4.6. Others
1.2.5. IT Asset Disposition (ITAD) Market By End-use Industry
1.2.5.1. Global IT Asset Disposition (ITAD) Market Revenue and Growth Rate Comparison By End-use Industry (2015-2026)
1.2.5.2. Global IT Asset Disposition (ITAD) Market Revenue Share By End-use Industry in 2017
1.2.5.3. BFSI
1.2.5.4. Government & Public
1.2.5.5. IT & Telecom
1.2.5.6. Aerospace & Defense
1.2.5.7. Healthcare
1.2.5.8. Energy & Utilities
1.2.5.9. Media and Entertainment
1.2.5.10. Data Centers
1.2.5.11. Others
1.2.6. IT Asset Disposition (ITAD) Market by Geography
1.2.6.1. Global IT Asset Disposition (ITAD) Market Revenue and Growth Rate Comparison by Geography (2015-2026)
1.2.6.2. North America IT Asset Disposition (ITAD) Market Revenue and Growth Rate (2015-2026)
1.2.6.3. Europe IT Asset Disposition (ITAD) Market Revenue and Growth Rate (2015-2026)
1.2.6.4. Asia-Pacific IT Asset Disposition (ITAD) Market Revenue and Growth Rate (2015-2026)
1.2.6.5. Latin America IT Asset Disposition (ITAD) Market Revenue and Growth Rate (2015-2026)
1.2.6.6. Middle East and Africa (MEA) IT Asset Disposition (ITAD) Market Revenue and Growth Rate (2015-2026)
CHAPTER 2. MARKET DYNAMICS AND COMPETITION ANALYSIS
2.1. Market Drivers
2.2. Restraints and Challenges
2.3. Growth Opportunities
2.4. Porter’s Five Forces Analysis
2.4.1. Bargaining Power of Suppliers
2.4.2. Bargaining Power of Buyers
2.4.3. Threat of Substitute
2.4.4. Threat of New Entrants
2.4.5. Degree of Competition
2.5. Value Chain Analysis
2.6. Cost Structure Analysis
2.6.1. Raw Material and Suppliers
2.6.2. Manufacturing Process Analysis
2.7. Regulatory Compliance
2.8. Competitive Landscape, 2017
2.8.1. Player Positioning Analysis
2.8.2. Key Strategies Adopted By Leading Players
CHAPTER 3. MANUFACTURING PLANTS ANALYSIS
3.1. Capacity and Commercial Production Date of Global IT Asset Disposition (ITAD) Major Manufacturers in 2017
3.2. Manufacturing Plants Distribution of Global IT Asset Disposition (ITAD) Major Manufacturers in 2017
3.3. R&D Status and Technology Source of Global IT Asset Disposition (ITAD) Major Manufacturers in 2017
3.4. Raw Materials Sources Analysis of Global IT Asset Disposition (ITAD) Major Manufacturers in 2017
CHAPTER 4. IT Asset Disposition (ITAD) Market By Asset Type
4.1. Global IT Asset Disposition (ITAD) Revenue By Asset Type
4.2. Hardware
4.2.1. Market Revenue and Growth Rate, 2015 - 2026 ($Million)
4.2.2. Market Revenue and Forecast, By Region, 2015 - 2026 ($Million)
4.3. Computer/Laptops
4.3.1. Market Revenue and Growth Rate, 2015 - 2026 ($Million)
4.3.2. Market Revenue and Forecast, By Region, 2015 - 2026 ($Million)
4.4. Mobile Devices
4.4.1. Market Revenue and Growth Rate, 2015 - 2026 ($Million)
4.4.2. Market Revenue and Forecast, By Region, 2015 - 2026 ($Million)
4.5. Peripherals
4.5.1. Market Revenue and Growth Rate, 2015 - 2026 ($Million)
4.5.2. Market Revenue and Forecast, By Region, 2015 - 2026 ($Million)
4.6. Storages
4.6.1. Market Revenue and Growth Rate, 2015 - 2026 ($Million)
4.6.2. Market Revenue and Forecast, By Region, 2015 - 2026 ($Million)
4.7. Servers
4.7.1. Market Revenue and Growth Rate, 2015 - 2026 ($Million)
4.7.2. Market Revenue and Forecast, By Region, 2015 - 2026 ($Million)
4.8. Others
4.8.1. Market Revenue and Growth Rate, 2015 - 2026 ($Million)
4.8.2. Market Revenue and Forecast, By Region, 2015 - 2026 ($Million)
CHAPTER 5. IT Asset Disposition (ITAD) Market By Service
5.1. Global IT Asset Disposition (ITAD) Revenue By Service
5.2. Data Sanitation / Destruction
5.2.1. Market Revenue and Growth Rate, 2015 - 2026 ($Million)
5.2.2. Market Revenue and Forecast, By Region, 2015 - 2026 ($Million)
5.3. Recycling
5.3.1. Market Revenue and Growth Rate, 2015 - 2026 ($Million)
5.3.2. Market Revenue and Forecast, By Region, 2015 - 2026 ($Million)
5.4. Remarking
5.4.1. Market Revenue and Growth Rate, 2015 - 2026 ($Million)
5.4.2. Market Revenue and Forecast, By Region, 2015 - 2026 ($Million)
5.5. Asset Discovery
5.5.1. Market Revenue and Growth Rate, 2015 - 2026 ($Million)
5.5.2. Market Revenue and Forecast, By Region, 2015 - 2026 ($Million)
5.6. Reverse Logistics
5.6.1. Market Revenue and Growth Rate, 2015 - 2026 ($Million)
5.6.2. Market Revenue and Forecast, By Region, 2015 - 2026 ($Million)
5.7. Others
5.7.1. Market Revenue and Growth Rate, 2015 - 2026 ($Million)
5.7.2. Market Revenue and Forecast, By Region, 2015 - 2026 ($Million)
CHAPTER 6. IT Asset Disposition (ITAD) Market By Enterprise Size
6.1. Global IT Asset Disposition (ITAD) Revenue By Enterprise Size
6.2. Small Enterprises
6.2.1. Market Revenue and Growth Rate, 2015 - 2026 ($Million)
6.2.2. Market Revenue and Forecast, By Region, 2015 - 2026 ($Million)
6.3. Medium Enterprises
6.3.1. Market Revenue and Growth Rate, 2015 - 2026 ($Million)
6.3.2. Market Revenue and Forecast, By Region, 2015 - 2026 ($Million)
6.4. Large Enterprises
6.4.1. Market Revenue and Growth Rate, 2015 - 2026 ($Million)
6.4.2. Market Revenue and Forecast, By Region, 2015 - 2026 ($Million)
6.5. Others
6.5.1. Market Revenue and Growth Rate, 2015 - 2026 ($Million)
6.5.2. Market Revenue and Forecast, By Region, 2015 - 2026 ($Million)
CHAPTER 7. IT Asset Disposition (ITAD) Market By End-use Industry
7.1. Global IT Asset Disposition (ITAD) Revenue By End-use Industry
7.2. BFSI
7.2.1. Market Revenue and Growth Rate, 2015 - 2026 ($Million)
7.2.2. Market Revenue and Forecast, By Region, 2015 - 2026 ($Million)
7.3. Government & Public
7.3.1. Market Revenue and Growth Rate, 2015 - 2026 ($Million)
7.3.2. Market Revenue and Forecast, By Region, 2015 - 2026 ($Million)
7.4. IT & Telecom
7.4.1. Market Revenue and Growth Rate, 2015 - 2026 ($Million)
7.4.2. Market Revenue and Forecast, By Region, 2015 - 2026 ($Million)
7.5. Aerospace & Defense
7.5.1. Market Revenue and Growth Rate, 2015 - 2026 ($Million)
7.5.2. Market Revenue and Forecast, By Region, 2015 - 2026 ($Million)
7.6. Healthcare
7.6.1. Market Revenue and Growth Rate, 2015 - 2026 ($Million)
7.6.2. Market Revenue and Forecast, By Region, 2015 - 2026 ($Million)
7.7. Energy & Utilities
7.7.1. Market Revenue and Growth Rate, 2015 - 2026 ($Million)
7.7.2. Market Revenue and Forecast, By Region, 2015 - 2026 ($Million)
7.8. Media and Entertainment
7.8.1. Market Revenue and Growth Rate, 2015 - 2026 ($Million)
7.8.2. Market Revenue and Forecast, By Region, 2015 - 2026 ($Million)
7.9. Data Centers
7.9.1. Market Revenue and Growth Rate, 2015 - 2026 ($Million)
7.9.2. Market Revenue and Forecast, By Region, 2015 - 2026 ($Million)
7.10. Others
7.10.1. Market Revenue and Growth Rate, 2015 - 2026 ($Million)
7.10.2. Market Revenue and Forecast, By Region, 2015 - 2026 ($Million)
CHAPTER 8. North America IT Asset Disposition (ITAD) Market By Country
8.1. North America IT Asset Disposition (ITAD) Market Revenue and Growth Rate, 2015 - 2026 ($Million)
8.2. North America IT Asset Disposition (ITAD) Market Revenue Share Comparison, 2015 & 2026 (%)
8.3. U.S.
8.3.1. U.S. IT Asset Disposition (ITAD) Market Revenue and Forecast By Asset Type, 2015 - 2026 ($Million)
8.3.2. Market Revenue and Forecast By Service, 2015 - 2026 ($Million)
8.4. Canada
8.4.1. Market Revenue and Forecast By Asset Type, 2015 - 2026 ($Million)
8.4.2. Market Revenue and Forecast By Service, 2015 - 2026 ($Million)
8.5. Mexico
8.5.1. Market Revenue and Forecast By Asset Type, 2015 - 2026 ($Million)
8.5.2. Market Revenue and Forecast By Service, 2015 - 2026 ($Million)
CHAPTER 9. Europe IT Asset Disposition (ITAD) Market By Country
9.1. Europe IT Asset Disposition (ITAD) Market Revenue and Growth Rate, 2015 - 2026 ($Million)
9.2. Europe IT Asset Disposition (ITAD) Market Revenue Share Comparison, 2015 & 2026 (%)
9.3. UK
9.3.1. Market Revenue and Forecast By Asset Type, 2015 - 2026 ($Million)
9.3.2. Market Revenue and Forecast By Service, 2015 - 2026 ($Million)
9.4. Germany
9.4.1. Market Revenue and Forecast By Asset Type, 2015 - 2026 ($Million)
9.4.2. Market Revenue and Forecast By Service, 2015 - 2026 ($Million)
9.5. France
9.5.1. Market Revenue and Forecast By Asset Type, 2015 - 2026 ($Million)
9.5.2. Market Revenue and Forecast By Service, 2015 - 2026 ($Million)
9.6. Spain
9.6.1. Market Revenue and Forecast By Asset Type, 2015 - 2026 ($Million)
9.6.2. Market Revenue and Forecast By Service, 2015 - 2026 ($Million)
9.7. Rest of Europe
9.7.1. Market Revenue and Forecast By Asset Type, 2015 - 2026 ($Million)
9.7.2. Market Revenue and Forecast By Service, 2015 - 2026 ($Million)
CHAPTER 10. Asia-Pacific IT Asset Disposition (ITAD) Market By Country
10.1. Asia-Pacific IT Asset Disposition (ITAD) Market Revenue and Growth Rate, 2015 - 2026 ($Million)
10.2. Asia-Pacific IT Asset Disposition (ITAD) Market Revenue Share Comparison, 2015 & 2026 (%)
10.3. China
10.3.1. Market Revenue and Forecast By Asset Type, 2015 - 2026 ($Million)
10.3.2. Market Revenue and Forecast By Service, 2015 - 2026 ($Million)
10.4. Japan
10.4.1. Market Revenue and Forecast By Asset Type, 2015 - 2026 ($Million)
10.4.2. Market Revenue and Forecast By Service, 2015 - 2026 ($Million)
10.5. India
10.5.1. Market Revenue and Forecast By Asset Type, 2015 - 2026 ($Million)
10.5.2. Market Revenue and Forecast By Service, 2015 - 2026 ($Million)
10.6. Australia
10.6.1. Market Revenue and Forecast By Asset Type, 2015 - 2026 ($Million)
10.6.2. Market Revenue and Forecast By Service, 2015 - 2026 ($Million)
10.7. South Korea
10.7.1. Market Revenue and Forecast By Asset Type, 2015 - 2026 ($Million)
10.7.2. Market Revenue and Forecast By Service, 2015 - 2026 ($Million)
10.8. Rest of Asia-Pacific
10.8.1. Market Revenue and Forecast By Asset Type, 2015 - 2026 ($Million)
10.8.2. Market Revenue and Forecast By Service, 2015 - 2026 ($Million)
CHAPTER 11. Latin America IT Asset Disposition (ITAD) Market By Country
11.1. Latin America IT Asset Disposition (ITAD) Market Revenue and Growth Rate, 2015 - 2026 ($Million)
11.2. Latin America IT Asset Disposition (ITAD) Market Revenue Share Comparison, 2015 & 2026 (%)
11.3. Brazil
11.3.1. Market Revenue and Forecast By Asset Type, 2015 - 2026 ($Million)
11.3.2. Market Revenue and Forecast By Service, 2015 - 2026 ($Million)
11.4. Argentina
11.4.1. Market Revenue and Forecast By Asset Type, 2015 - 2026 ($Million)
11.4.2. Market Revenue and Forecast By Service, 2015 - 2026 ($Million)
11.5. Rest of Latin America
11.5.1. Market Revenue and Forecast By Asset Type, 2015 - 2026 ($Million)
11.5.2. Market Revenue and Forecast By Service, 2015 - 2026 ($Million)
CHAPTER 12. Middle East IT Asset Disposition (ITAD) Market By Country
12.1. Middle East IT Asset Disposition (ITAD) Market Revenue and Growth Rate, 2015 - 2026 ($Million)
12.2. Middle East IT Asset Disposition (ITAD) Market Revenue Share Comparison, 2015 & 2026 (%)
12.3. Saudi Arabia
12.3.1. Market Revenue and Forecast By Asset Type, 2015 - 2026 ($Million)
12.3.2. Market Revenue and Forecast By Service, 2015 - 2026 ($Million)
12.4. UAE
12.4.1. Market Revenue and Forecast By Asset Type, 2015 - 2026 ($Million)
12.4.2. Market Revenue and Forecast By Service, 2015 - 2026 ($Million)
12.5. Rest of Middle East
12.5.1. Market Revenue and Forecast By Asset Type, 2015 - 2026 ($Million)
12.5.2. Market Revenue and Forecast By Service, 2015 - 2026 ($Million)
CHAPTER 13. Africa IT Asset Disposition (ITAD) Market By Country
13.1. Africa IT Asset Disposition (ITAD) Market Revenue and Growth Rate, 2015 - 2026 ($Million)
13.2. Africa IT Asset Disposition (ITAD) Market Revenue Share Comparison, 2015 & 2026 (%)
13.3. South Africa
13.3.1. Market Revenue and Forecast By Asset Type, 2015 - 2026 ($Million)
13.3.2. Market Revenue and Forecast By Service, 2015 - 2026 ($Million)
13.4. Egypt
13.4.1. Market Revenue and Forecast By Asset Type, 2015 - 2026 ($Million)
13.4.2. Market Revenue and Forecast By Service, 2015 - 2026 ($Million)
13.5. Rest of Africa
13.5.1. Market Revenue and Forecast By Asset Type, 2015 - 2026 ($Million)
13.5.2. Market Revenue and Forecast By Service, 2015 - 2026 ($Million)
CHAPTER 14. COMPANY PROFILE
14.1. Apto Solutions
14.1.1. Company Snapshot
14.1.2. Overview
14.1.3. Financial Overview
14.1.4. Product Portfolio
14.1.5. Key Developments
14.1.6. Strategies
14.2. Dell, Inc.
14.2.1. Company Snapshot
14.2.2. Overview
14.2.3. Financial Overview
14.2.4. Product Portfolio
14.2.5. Key Developments
14.2.6. Strategies
14.3. Exit Technologies
14.3.1. Company Snapshot
14.3.2. Overview
14.3.3. Financial Overview
14.3.4. Product Portfolio
14.3.5. Key Developments
14.3.6. Strategies
14.4. GreenTekReman Pvt. Ltd
14.4.1. Company Snapshot
14.4.2. Overview
14.4.3. Financial Overview
14.4.4. Product Portfolio
14.4.5. Key Developments
14.4.6. Strategies
14.5. ICEX Ltd
14.5.1. Company Snapshot
14.5.2. Overview
14.5.3. Financial Overview
14.5.4. Product Portfolio
14.5.5. Key Developments
14.5.6. Strategies
14.6. Iron Mountain, Inc.
14.6.1. Company Snapshot
14.6.2. Overview
14.6.3. Financial Overview
14.6.4. Product Portfolio
14.6.5. Key Developments
14.6.6. Strategies
14.7. LifeSpan International, Inc.
14.7.1. Company Snapshot
14.7.2. Overview
14.7.3. Financial Overview
14.7.4. Product Portfolio
14.7.5. Key Developments
14.7.6. Strategies
14.8. MultiTek, LLC.
14.8.1. Company Snapshot
14.8.2. Overview
14.8.3. Financial Overview
14.8.4. Product Portfolio
14.8.5. Key Developments
14.8.6. Strategies
14.9. TBS Industries
14.9.1. Company Snapshot
14.9.2. Overview
14.9.3. Financial Overview
14.9.4. Product Portfolio
14.9.5. Key Developments
14.9.6. Strategies
14.10. The Centrics Group
14.10.1. Company Snapshot
14.10.2. Overview
14.10.3. Financial Overview
14.10.4. Product Portfolio
14.10.5. Key Developments
14.10.6. Strategies
14.11. Arrow Electronics
14.11.1. Company Snapshot
14.11.2. Overview
14.11.3. Financial Overview
14.11.4. Product Portfolio
14.11.5. Key Developments
14.11.6. Strategies
14.12. EOL IT Services
14.12.1. Company Snapshot
14.12.2. Overview
14.12.3. Financial Overview
14.12.4. Product Portfolio
14.12.5. Key Developments
14.12.6. Strategies
14.13. Wisetek
14.13.1. Company Snapshot
14.13.2. Overview
14.13.3. Financial Overview
14.13.4. Product Portfolio
14.13.5. Key Developments
14.13.6. Strategies
14.14. Gigacycle
14.14.1. Company Snapshot
14.14.2. Overview
14.14.3. Financial Overview
14.14.4. Product Portfolio
14.14.5. Key Developments
14.14.6. Strategies
14.15. HP Ltd.
14.15.1. Company Snapshot
14.15.2. Overview
14.15.3. Financial Overview
14.15.4. Product Portfolio
14.15.5. Key Developments
14.15.6. Strategies
14.16. Ingram Micro, Inc.
14.16.1. Company Snapshot
14.16.2. Overview
14.16.3. Financial Overview
14.16.4. Product Portfolio
14.16.5. Key Developments
14.16.6. Strategies
14.17. ITRenew, Inc.
14.17.1. Company Snapshot
14.17.2. Overview
14.17.3. Financial Overview
14.17.4. Product Portfolio
14.17.5. Key Developments
14.17.6. Strategies
14.18. Maxicom Network, Inc.
14.18.1. Company Snapshot
14.18.2. Overview
14.18.3. Financial Overview
14.18.4. Product Portfolio
14.18.5. Key Developments
14.18.6. Strategies
14.19. Sims Recycling Solutions, Inc.
14.19.1. Company Snapshot
14.19.2. Overview
14.19.3. Financial Overview
14.19.4. Product Portfolio
14.19.5. Key Developments
14.19.6. Strategies
14.20. TES-AMM Pte Ltd.
14.20.1. Company Snapshot
14.20.2. Overview
14.20.3. Financial Overview
14.20.4. Product Portfolio
14.20.5. Key Developments
14.20.6. Strategies
14.21. Others
14.21.1. Company Snapshot
14.21.2. Overview
14.21.3. Financial Overview
14.21.4. Product Portfolio
14.21.5. Key Developments
14.21.6. Strategies
CHAPTER 15. RESEARCH APPROACH
15.1. Research Methodology
15.1.1. Initial Data Search
15.1.2. Secondary Research
15.1.3. Primary Research
15.2. Assumptions and Scope