Industrial Valves and Actuators Market Size - Global Industry, Share, Analysis, Trends and Forecast 2023 - 2032
Published :
Report ID:
Pages :
Format :
Industrial Valves and Actuators Market Size - Global Industry, Share, Analysis, Trends and Forecast 2023 - 2032
Report Coverage
- Industry Dynamics
- Market Size and Forecast Data
- Segment Analysis
- Competitive Landscape
- Regional Analysis with a Niche Focus on Country-Level Data
- High Level Analysis - Porter's, PESTEL, Value Chain, etc.
- Company Profiles of Key Players
- Option to Customize the Report As Per Your Specific Need
Request Sample Report
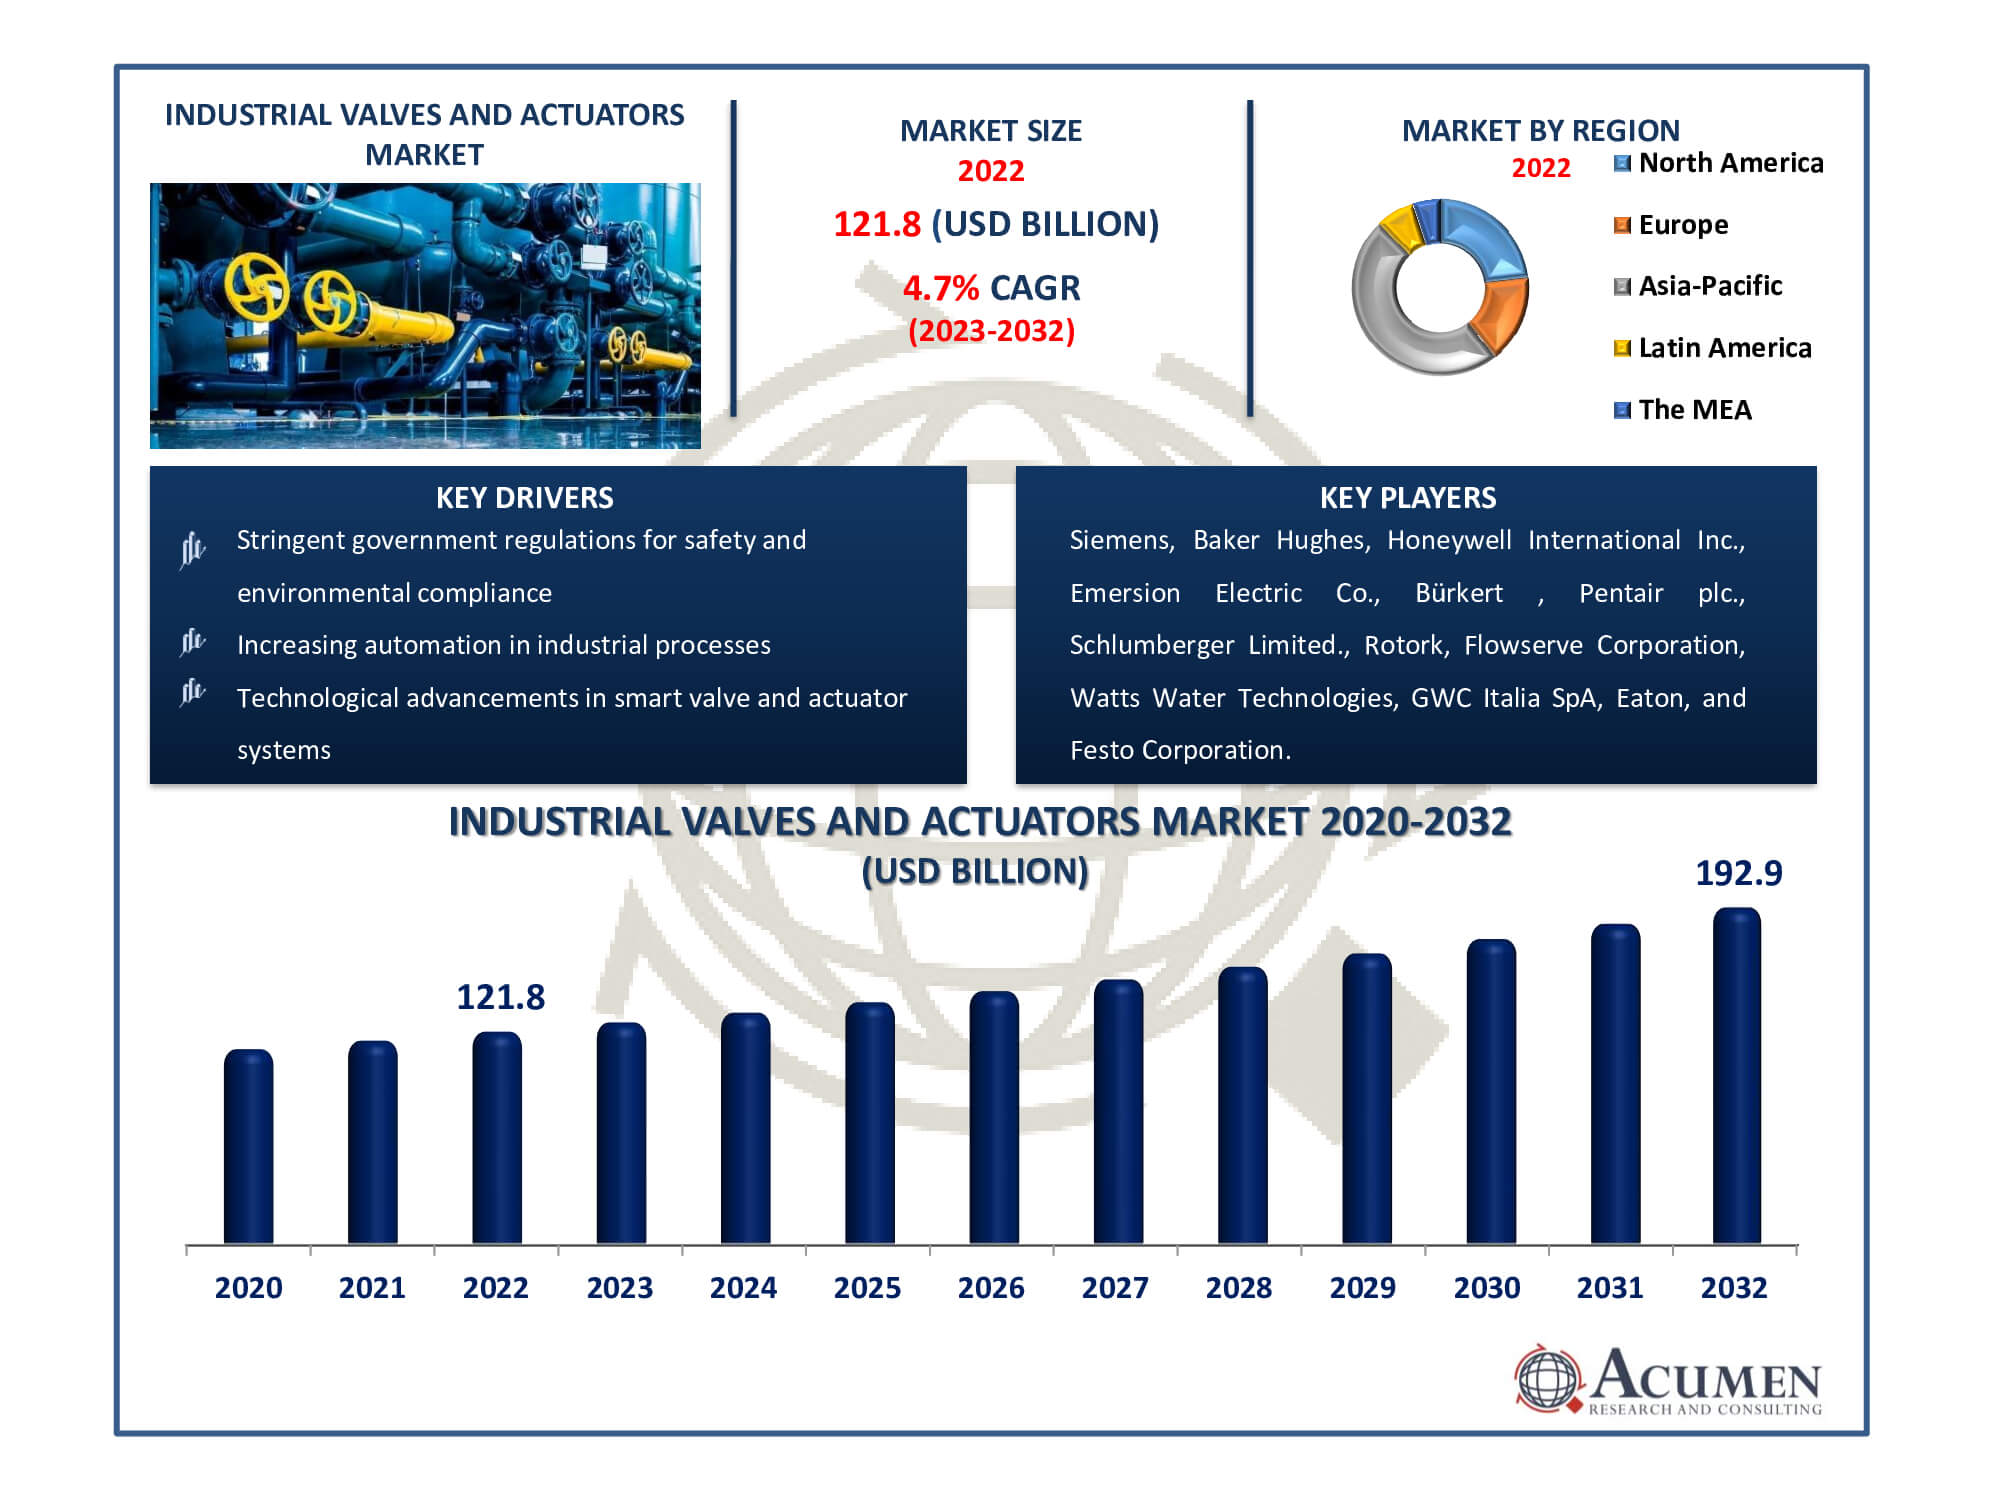
The Industrial Valves and Actuators Market Size accounted for USD 121.8 Billion in 2022 and is estimated to achieve a market size of USD 192.9 Billion by 2032 growing at a CAGR of 4.7% from 2023 to 2032.
Industrial Valves and Actuators Market Highlights
- Global industrial valves and actuators market revenue is poised to garner USD 192.9 billion by 2032 with a CAGR of 4.7% from 2023 to 2032
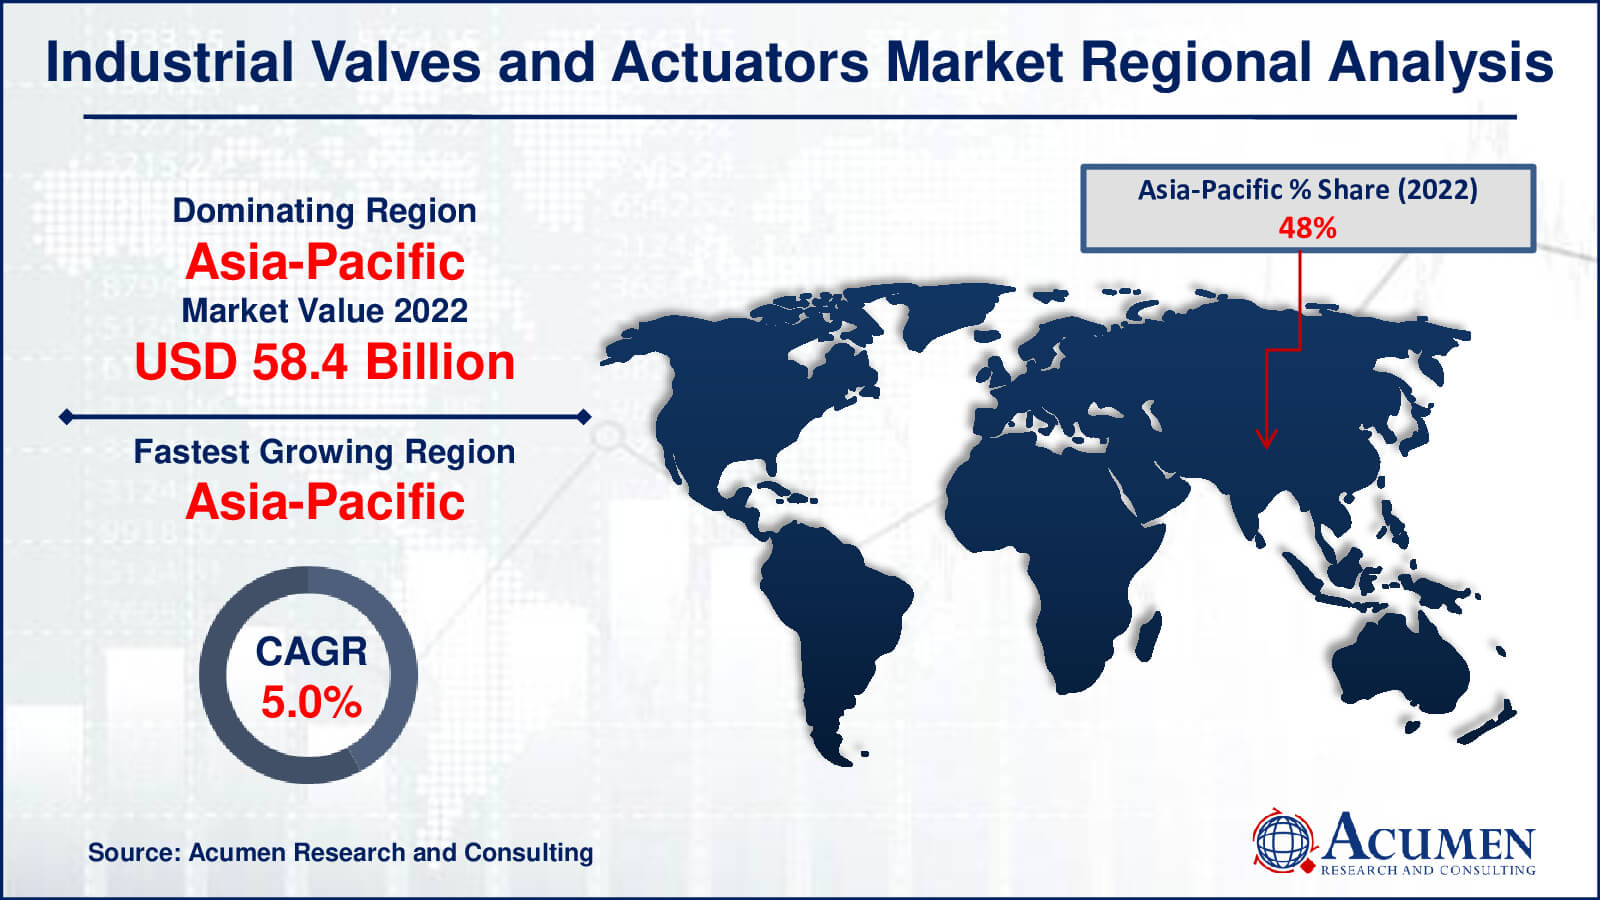
- Asia-Pacific industrial valves and actuators market value occupied around USD 58.4 billion in 2022
- Asia-Pacific industrial valves and actuators market growth will record a CAGR of more than 5% from 2023 to 2032
- Among product, the industrial valves sub-segment generated over US$ 67 billion revenue in 2022
- Based on end-user, the oil & gas sub-segment generated around 22% share in 2022
- Customization and integration services for complex industrial applications is an industrial valves and actuators market trend that fuels the industry demand

The industry sector that manufactures and sells devices used to regulate the flow of fluids or gases in various industrial processes is referred to as the industrial valves and actuators market. These valves and actuators are critical in manufacturing, energy production, and other industrial applications for regulating temperature and pressure. The global industrial valves and actuators market has experienced significant growth due to increasing demand in the manufacturing and industrial sector, advancements in technology driving the usage of smart valves and actuators, and strict government regulations. Consumer awareness and acceptance of industrial valves and actuators have been gaining traction because of the benefits they offer in temperature control and pressure management throughout downstream, upstream, and midstream activities. As a result, the increasing oil and gas exploration activities have heightened the demand for industrial valves and actuators.
Global Industrial Valves and Actuators Market Dynamics
Market Drivers
- Increasing automation in industrial processes
- Growing demand for energy and water resources
- Stringent government regulations for safety and environmental compliance
- Technological advancements in smart valve and actuator systems
Market Restraints
- High initial installation and maintenance costs
- Fluctuations in raw material prices
- Competition from alternative flow control solutions
Market Opportunities
- Expansion in emerging markets
- Rising adoption of IIoT (Industrial Internet of Things) technology
- Development of eco-friendly and energy-efficient valve solutions
Industrial Valves and Actuators Market Report Coverage
| Market | Industrial Valves and Actuators Market |
| Industrial Valves and Actuators Market Size 2022 | USD 121.8 Billion |
| Industrial Valves and Actuators Market Forecast 2032 | USD 192.9 Billion |
| Industrial Valves and Actuators Market CAGR During 2023 - 2032 | 4.7% |
| Industrial Valves and Actuators Market Analysis Period | 2020 - 2032 |
| Base Year |
2022 |
| Forecast Data | 2023 - 2032 |
| Segments Covered | By Product, By System, By End-Use, And By Geography |
| Regional Scope | North America, Europe, Asia Pacific, Latin America, and Middle East & Africa |
| Key Companies Profiled | Siemens, Baker Hughes, Honeywell International Inc., Emersion Electric Co., Bürkert, Pentair plc., Schlumberger Limited., Rotork, Flowserve Corporation, Watts Water Technologies, GWC Italia SpA, Eaton, Festo Corporation, Moog Inc., SMC Corporation, PARKER HANNIFIN CORP, Delta Pacific Supplies Inc, and PetrolValves |
| Report Coverage |
Market Trends, Drivers, Restraints, Competitive Analysis, Player Profiling, Covid-19 Analysis, Regulation Analysis |
Industrial Valves and Actuators Market Insights
The global industrial valves and actuators market is expected to experience significant growth due to the increasing oil and gas exploration activities. These activities present numerous growth opportunities for industrial valves and actuators, not only in offshore but also in onshore operations. The growing adoption of these technologies in onshore activities is attributed to their ability to withstand high-pressure and corrosive conditions in production platforms and refineries. The continuous rise in acceptance, adoption, and implementation of industrial valves and actuators is driven by the benefits they offer in controlling temperature and pressure throughout upstream, downstream, and midstream operations.
The increasing stress on global water consumption and the disposal of industrial wastewater into aquatic ecosystems has created a pressing need for water recovery solutions. To address these alarming issues, there is a growing demand for efficient water treatment equipment systems, creating opportunities for the water and wastewater industries. Furthermore, 3D printing, also known as additive manufacturing, has the potential to revolutionize the production of industrial valves and actuators. Various traditional designs and products, including servo valves, gate valves, and check valves, can now be developed using 3D printing technology. This technology is helping valve manufacturers shift their approach from 'Just-in-time (JIT) delivery' to 'JIT manufacturing.
Industrial Valves and Actuators Market Segmentation
The worldwide market for industrial valves and actuators is split based on product, system, end-use, and geography.
Industrial Valves and Actuators Products
- Industrial Valves
- Gate Valve
- Globe Valve
- Ball Valve
- Butterfly Valve
- Safety Valve
- Plug Valve
- Others
- Industrial Actuators
- Linear Actuators
- Rotary Actuators
The dominance of the industrial valves segment in the industrial valves and actuators market is reflected in market analysis. This is primarily due to the critical importance of industrial valves in managing the flow of liquids and gases in industries such as oil and gas, water treatment, and manufacturing. Industrial valves are in constant demand, both for process regulation and safety, making them a focal point of market analysis. While industrial actuators hold significance, valves enjoy a larger market share due to their pivotal role in controlling fluid flow across various industrial activities.
Industrial Valves and Actuators Systems
- Industrial Actuators
- Mechanical Actuators
- Electric Actuators
- Pneumatic Actuators
- Hydraulic Actuators
The pneumatic actuators sector not only dominates the current industrial actuators market but also shows promising potential in market analysis and market forecast. Pneumatic actuators are favored for their user-friendliness and cost-effectiveness, attributes likely to remain in high demand. With motion powered by compressed air, they offer reliability and straightforward maintenance, making them an attractive choice for a wide range of industrial operations, including manufacturing and automation. While other actuator types like electric and hydraulic have their merits, pneumatic actuators are expected to maintain their market leadership, as market analysis and forecasts predict continued reliance on these cost-effective and dependable solutions for industrial automation needs.
Industrial Valves and Actuators End-Uses
- Oil & Gas
- Chemical
- Energy & Power
- Water & Wastewater
- Pulp & Paper
- Food & Beverage
- Others (manufacturing, electronics, marine, and textiles)
The oil & gas segment not only stands as the largest in the current industrial valves and actuators market but also shows strong potential in market forecast. The prominence of these industries in the global economy is a key driver of their continued dominance. Valves and actuators are integral to ensuring the safe and efficient flow of resources in oil and gas operations, resulting in sustained high demand. While other sectors like energy, chemicals, and water and wastewater are significant, the sheer size and complexity of the oil and gas industry position it as a dominant force in the market, with favorable market forecast further supporting this outlook.
Industrial Valves and Actuators Market Regional Outlook
North America
- U.S.
- Canada
Europe
- U.K.
- Germany
- France
- Spain
- Rest of Europe
Asia-Pacific
- India
- Japan
- China
- Australia
- South Korea
- Rest of Asia-Pacific
Latin America
- Brazil
- Mexico
- Rest of Latin America
The Middle East & Africa
- South Africa
- GCC Countries
- Rest of the Middle East & Africa (ME&A)

Industrial Valves and Actuators Market Regional Analysis
Asia-Pacific has established itself as the dominant region in the industrial valves and actuators market as a result of a variety of factors. For starters, the region's extensive industrial infrastructure, particularly in China and India, has resulted in a significant demand for industrial valves and actuators in a variety of applications such as manufacturing, energy, and water management. Furthermore, the ongoing expansion of the Asia-Pacific oil and gas sector has increased the need for these components. Rapid urbanization and a growing population in the region have raised demand for water and wastewater management, propelling the market for industrial valves and actuators to new heights.
North America is the market's second-largest region, owing to its well-established industrial base and significant investments in infrastructure development. The oil and gas industry, in particular, has driven demand for industrial valves and actuators in the United States. Because of the region's emphasis on energy efficiency and ecological practices, sophisticated valve and actuator technologies have seen greater usage. North America's significant emphasis on innovation and technological advancement puts it as a market leader.
Moreover, Asia-Pacific is the fastest-growing region in the industrial valves and actuators market due to a range of factors. The region is seeing rapid economic expansion, which is spurring investment in a variety of industries. Furthermore, as people become more conscious of environmental issues and the need for more effective water and wastewater management systems, the demand for these products has increased. Asia-Pacific's manufacturing industry is quickly developing, necessitating advanced automation and control systems such as industrial valves and actuators. Furthermore, government measures supporting infrastructure development and smart cities are fuelling the region's adoption of these technologies.
Industrial Valves and Actuators Market Players
Some of the top industrial valves and actuators companies of offered in our report includes Siemens, Baker Hughes, Honeywell International Inc., Emersion Electric Co., Bürkert, Pentair plc., Schlumberger Limited., Rotork, Flowserve Corporation, Watts Water Technologies, GWC Italia SpA, Eaton, Festo Corporation, Moog Inc., SMC Corporation, PARKER HANNIFIN CORP, Delta Pacific Supplies Inc, and PetrolValves.
Frequently Asked Questions
How big was the industrial valves and actuators market?
The industrial valves and actuators market size was USD 121.8 billion in 2022.
hat is the CAGR of the global industrial valves and actuators market from 2023 to 2032?
The CAGR of industrial valves and actuators is 4.7% during the analysis period of 2023 to 2032.
Which are the key players in the industrial valves and actuators market?
The key players operating in the global market are including Siemens, Baker Hughes, Honeywell International Inc., Emersion Electric Co., B�rkert, Pentair plc., Schlumberger Limited., Rotork, Flowserve Corporation, Watts Water Technologies, GWC Italia SpA, Eaton, Festo Corporation, Moog Inc., SMC Corporation, PARKER HANNIFIN CORP, Delta Pacific Supplies Inc, and PetrolValves.
Which region dominated the global industrial valves and actuators market share?
Asia-Pacific held the dominating position in industrial valves and actuators industry during the analysis period of 2023 to 2032.
Which region registered fastest CAGR from 2023 to 2032?
Asia-Pacific region exhibited fastest growing CAGR for market of industrial valves and actuators during the analysis period of 2023 to 2032.
What are the current trends and dynamics in the global industrial valves and actuators industry?
The current trends and dynamics in the industrial valves and actuators industry include increasing automation in industrial processes, growing demand for energy and water resources, stringent government regulations for safety and environmental compliance, and technological advancements in smart valve and actuator systems.
Which product held the maximum share in 2022?
The industrial valves product held the maximum share of the industrial valves and actuators industry.


