Industrial Touch Screen Display Market | Acumen Research and Consulting
Industrial Touch Screen Display Market Size - Global Industry, Share, Analysis, Trends and Forecast 2024 - 2032
Published :
Report ID:
Pages :
Format :
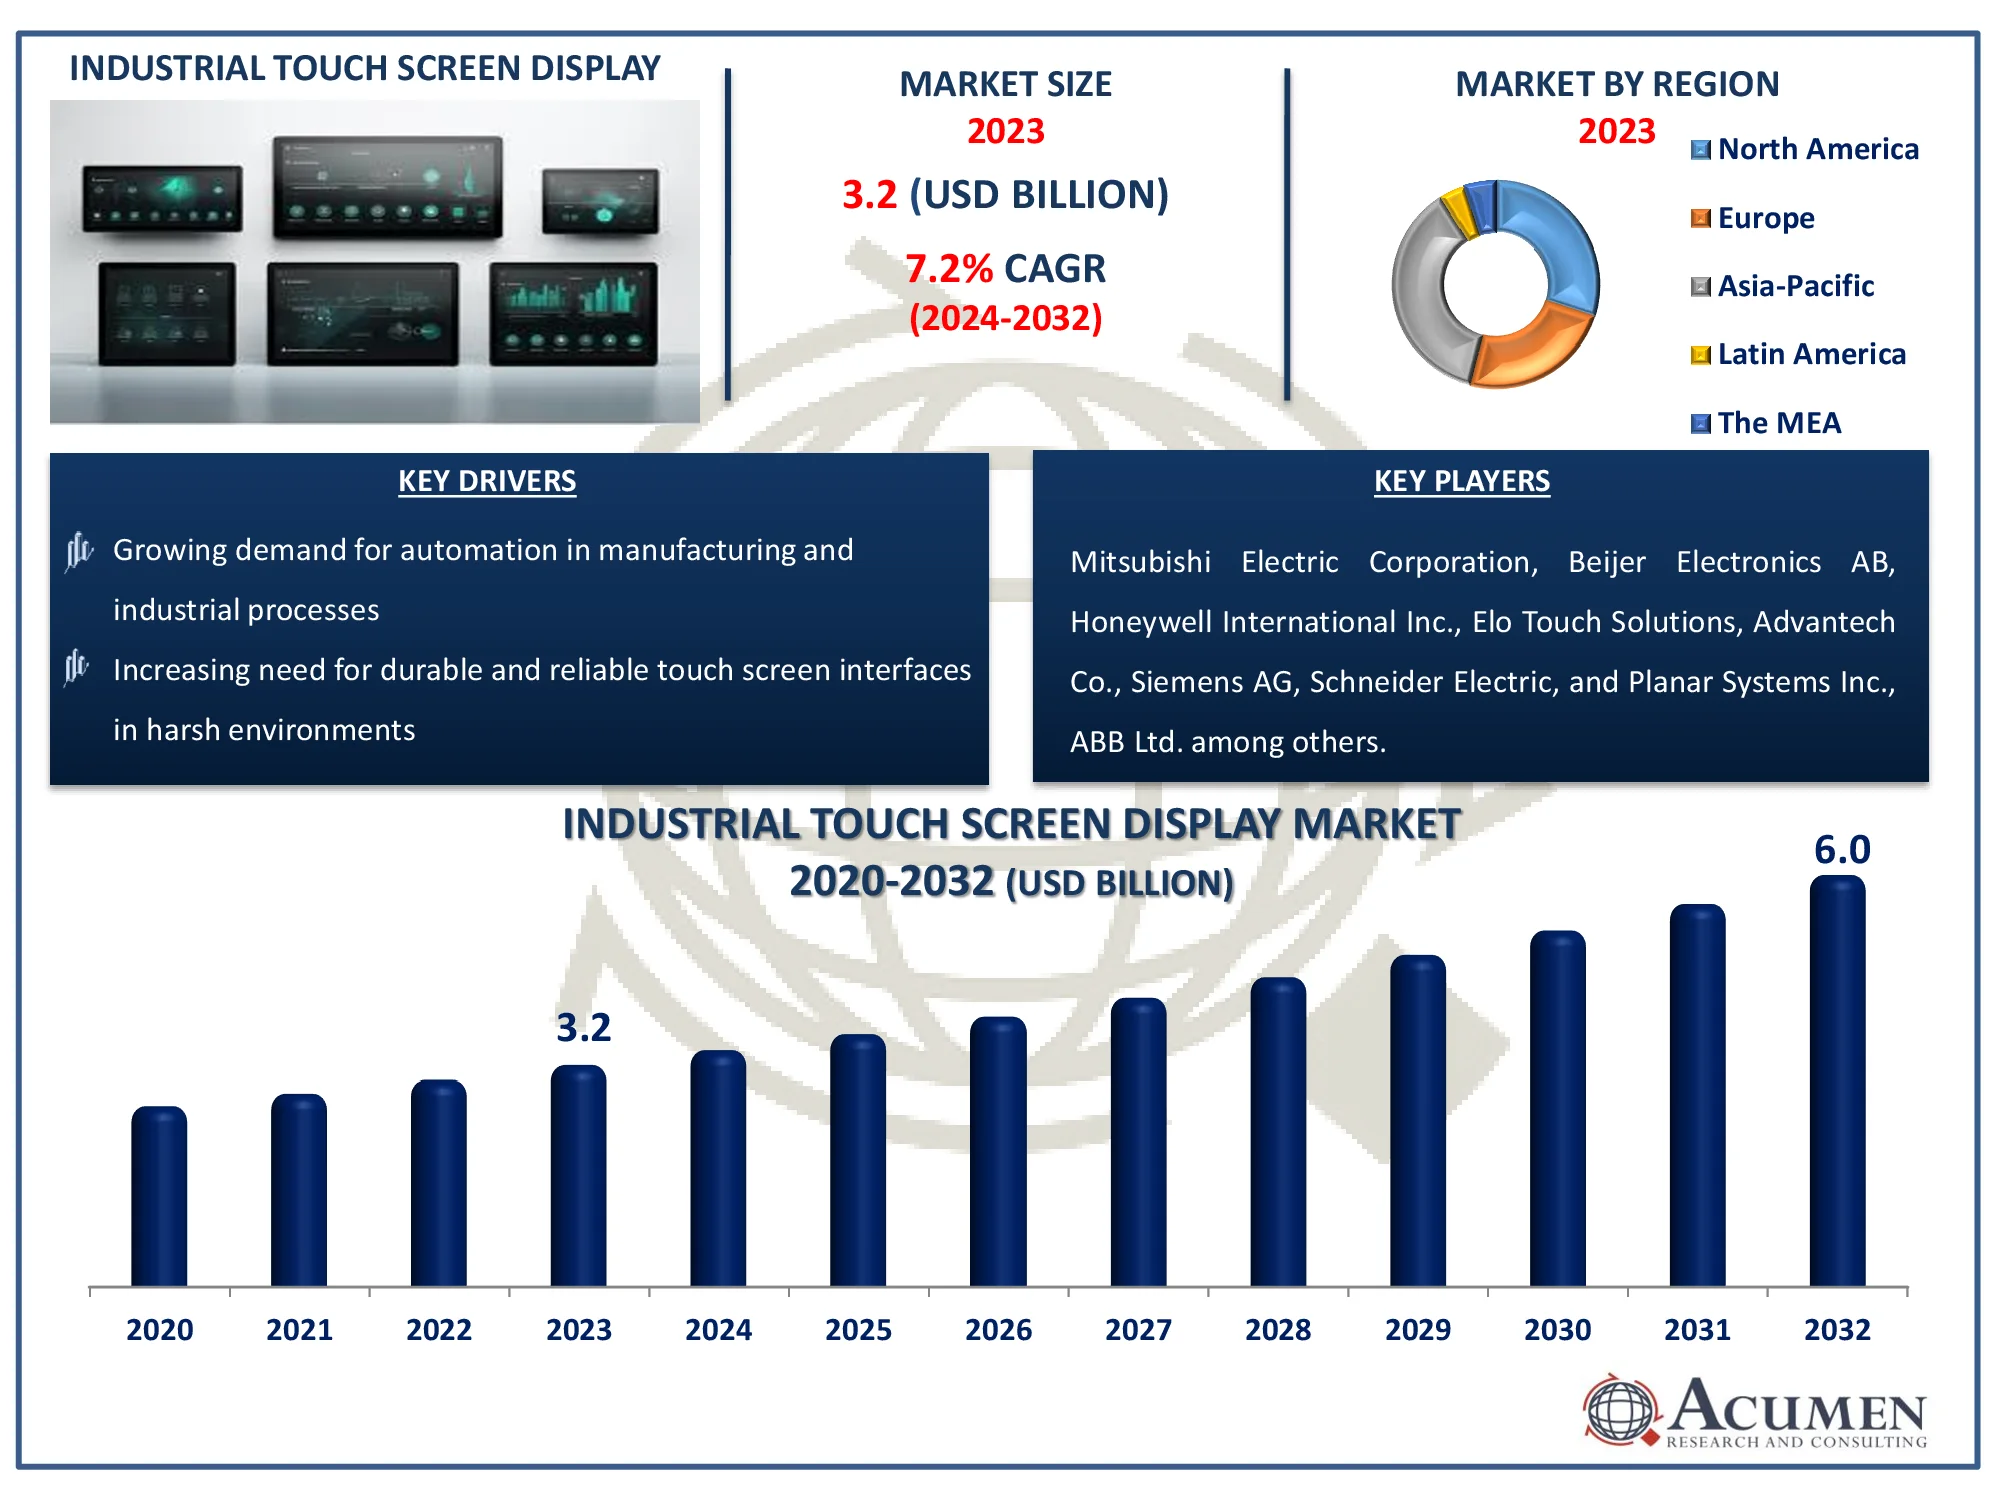
The Global Industrial Touch Screen Display Market Size accounted for USD 3.2 Billion in 2023 and is estimated to achieve a market size of USD 6.0 Billion by 2032 growing at a CAGR of 7.2% from 2024 to 2032.
Industrial Touch Screen Display Market Highlights
- Global industrial touch screen display market revenue is poised to garner USD 6.0 billion by 2032 with a CAGR of 7.2% from 2024 to 2032
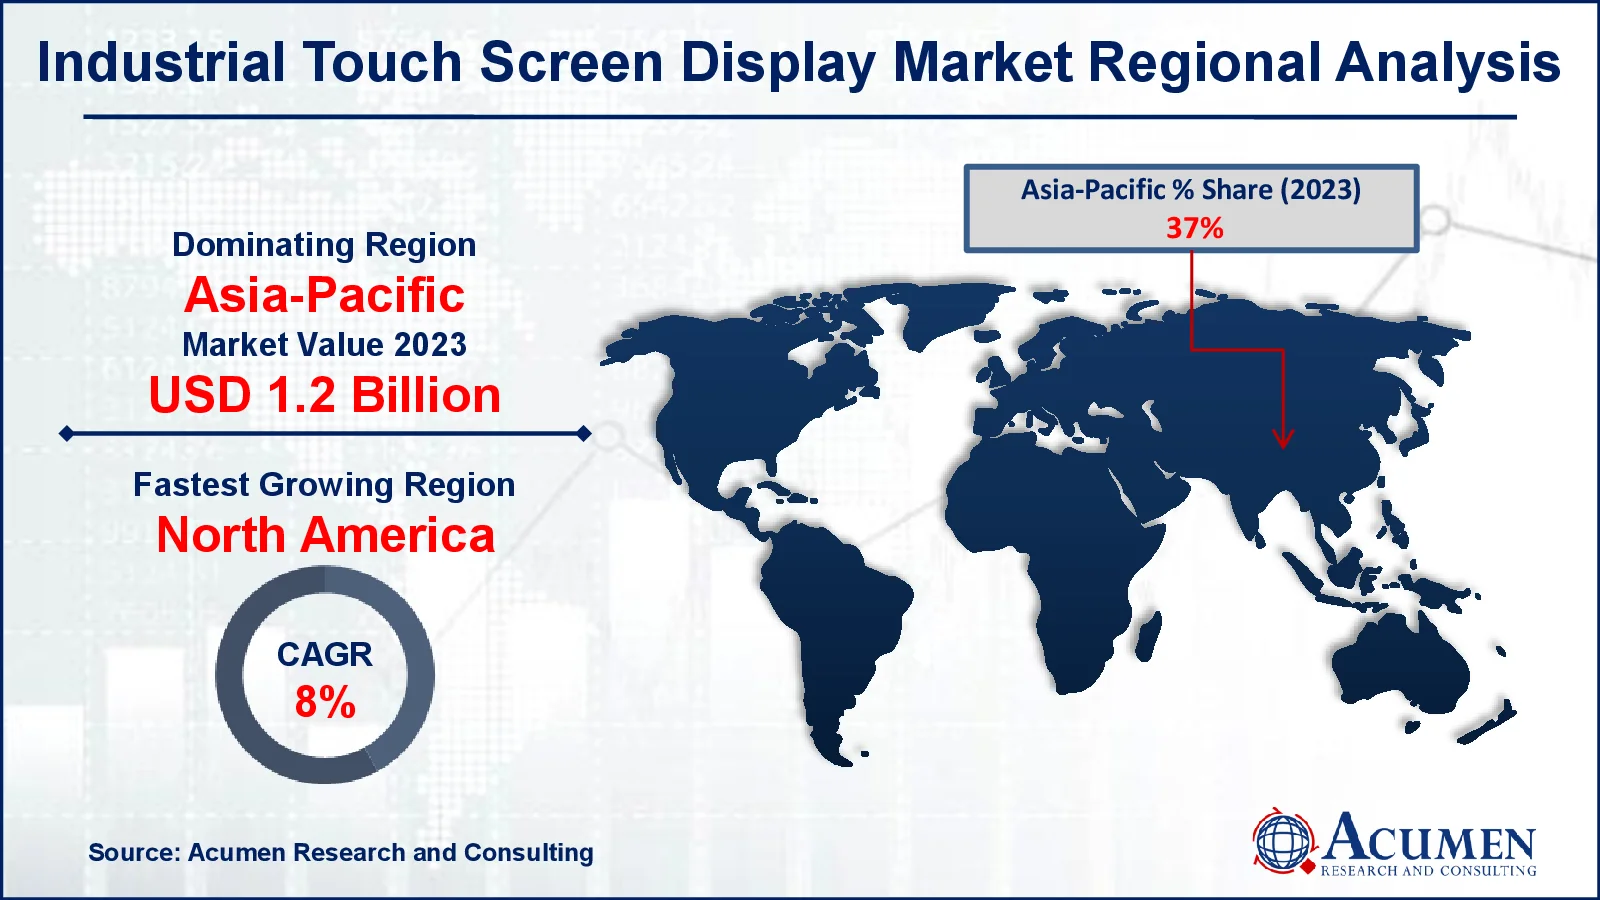
- Asia-Pacific industrial touch screen display market value occupied around USD 1.2 billion in 2023
- North America industrial touch screen display market growth will record a CAGR of more than 8% from 2024 to 2032
- Among type, the capacitive sub-segment generated notable revenue in 2023
- Based on end-use industry, the automotive sub-segment generated significant Industrial touch screen display market share in 2023
- Integration of touch screens with IoT devices for enhanced industrial applications is a popular industrial touch screen display market trend that fuels the industry demand

The touch screen display technology is mainly used for interfacing human computer to provide input and obtain output from the processing unit. The touch screen has a wide range of applications across the industrial sectors and even in daily use. Most preferably and profitable products where touch screen technology can be used are a smart phone, laptop, personal computer, and laptop. Furthermore, industrial applications frequently require rugged touch screens to develop communication and efficiency while withstanding vibrations, heavy use, and at extreme temperature.
Global Industrial Touch Screen Display Market Dynamics
Market Drivers
- Growing demand for automation in manufacturing and industrial processes
- Rising adoption of Industry 4.0 technologies
- Increasing need for durable and reliable touch screen interfaces in harsh environments
- Expansion of the automotive and electronics industries
Market Restraints
- High initial costs of advanced touch screen displays
- Technical challenges related to durability and longevity in extreme conditions
- Limited adoption in small and medium-sized enterprises (SMEs) due to budget constraints
Market Opportunities
- Advancements in touch screen technology, such as multi-touch and gesture recognition
- Expansion into emerging markets with rising industrialization
- Growing demand for touch screens in the electric vehicle (EV) sector
Industrial Touch Screen Display Market Report Coverage
| Market | Industrial Touch Screen Display Market |
| Industrial Touch Screen Display Market Size 2022 |
USD 3.2 Billion |
| Industrial Touch Screen Display Market Forecast 2032 | USD 6.0 Billion |
| Industrial Touch Screen Display Market CAGR During 2023 - 2032 | 7.2% |
| Industrial Touch Screen Display Market Analysis Period | 2020 - 2032 |
| Industrial Touch Screen Display Market Base Year |
2022 |
| Industrial Touch Screen Display Market Forecast Data | 2023 - 2032 |
| Segments Covered | By Type, By Component, By End-Use Industry, And By Geography |
| Regional Scope | North America, Europe, Asia Pacific, Latin America, and Middle East & Africa |
| Key Companies Profiled | Mitsubishi Electric Corporation, Beijer Electronics AB, Honeywell International Inc., Elo Touch Solutions, Advantech Co., Siemens AG, Schneider Electric, Planar Systems Inc., ABB Ltd, Rockwell Automation Inc., General Electric Company, and Weintek Labs. |
| Report Coverage |
Market Trends, Drivers, Restraints, Competitive Analysis, Player Profiling, Covid-19 Analysis, Regulation Analysis |
Industrial Touch Screen Display Market Insights
The industrial touch screen display market is expanding rapidly, thanks to a number of important drivers. Technological improvements have accelerated the transition from traditional resistive single-touch screens to sophisticated multi-touch displays, which provide greater responsiveness and user experience. Continuous improvement in touchscreen technology has improved the quality, durability, and functionality of these displays, making them more appealing to businesses.
High visual quality, ease of use, and low power consumption are among the major factors driving market growth. As disposable incomes increase, there is a greater need for high-quality screens that provide excellent visual experiences. The trend toward slimmer, more aesthetically beautiful models has also contributed to the growing popularity of industrial touch screen displays.
Furthermore, developments in the hardware industry, notably in the development of scratch-resistant screens, are driving growth in the market. These advancements ensure that touchscreens can resist tough industrial settings, hence increasing their longevity and reliability.
Manufacturers are increasingly including value-added features in their displays, such as increased durability, sensitivity, and energy economy. These advancements not only match the expanding demands of industries, but also create new uses for touchscreens in a variety of industries, including automotive, healthcare, and manufacturing. Furthermore, the incorporation of smart technologies, such as IoT compatibility and configurable interfaces, is increasing demand. The increased emphasis on automation, as well as the requirement for more intuitive human-machine interfaces, have made industrial touch screen displays important, establishing the market for future growth.
Industrial Touch Screen Display Market Segmentation
The worldwide market for industrial touch screen display is split based on type, component end-use industry, and geography.
Industrial Touch Screen Display Market By Type
- Resistive
- Capacitive
- Surface Acoustic Wave
- Infrared
Industrial touch screen displays have become an essential part of current manufacturing and automation systems. They provide a straightforward interface for managing machines, monitoring operations, and retrieving crucial data. The market for these displays is classified according to the technology utilized, which includes resistive, capacitive, surface acoustic wave (SAW), and infrared. The capacitive segment has emerged as the most prevalent technology due to its superior performance and versatility. Capacitive touch screens use an electrical field to detect the presence of a finger or other conductive object. When a user touches the screen, their finger interrupts the electrical field, allowing the gadget to properly locate the contact.
Industrial Touch Screen Display Market By Component
- Hardware
- Display
- Touch Sensor
- Controller
- Software
According to industrial touch screen display industry analysis, the hardware section of the market is predicted to grow significantly. This is due to the growing demand for strong, long-lasting touch screens in severe industrial situations. These displays are critical for applications that require high reliability, including as in the manufacturing, automotive, and aerospace industries. The hardware consists of touch sensors, display panels, controllers, and protective enclosures that are designed to withstand severe temperatures, dust, moisture, and vibrations. As companies progressively automate processes, the demand for dependable, responsive, and user-friendly interfaces has fueled improvements in touchscreen technology. As a result, hardware improvements are critical to addressing the severe demands of industrial applications.
Industrial Touch Screen Display Market By End-Use Industry
- Oil and Gas
- Chemical
- Food and Beverages
- Mining and Metal
- Automotive
As per the industrial touch screen display market forecast, the automotive industry is expected to dominate the industry throughout 2024 to 2032, indicating the sector's growing embrace of new technology. Touch screen displays are essential in current automotive manufacturing and operations, increasing efficiency and precision. These displays are used for a variety of purposes, including assembly line controls, diagnostics, vehicle monitoring systems, and human-machine interfaces (HMIs) within cars. Real-time data visualization, increased operational control, and enhanced user experiences are driving the demand for high-resolution, long-lasting touch panels. As the automobile sector embraces automation, electric vehicles (EVs), and smart technology, the need for sophisticated touch screen displays is likely to increase, consolidating this segment's market dominance.
Industrial Touch Screen Display Market Regional Outlook
North America
- U.S.
- Canada
Europe
- U.K.
- Germany
- France
- Spain
- Rest of Europe
Asia-Pacific
- India
- Japan
- China
- Australia
- South Korea
- Rest of Asia-Pacific
Latin America
- Brazil
- Mexico
- Rest of Latin America
The Middle East & Africa
- South Africa
- GCC Countries
- Rest of the Middle East & Africa (ME&A)

Industrial Touch Screen Display Market Regional Analysis
Asia-Pacific is predicted to experience the most major expansion in the industrial touch screen display market forecast period. Rapid industrialization, particularly in China, Japan, and South Korea, combined with the growing use of automation in manufacturing and production processes, fuels demand. Furthermore, the region's thriving electronics and automotive industries contribute to market growth.
North America is a fastest growing region in industrial touchscreen display market, driven by early adoption of sophisticated technologies and the presence of key players in industries such as automotive, aerospace, and manufacturing. The region's emphasis on automation and digitalization in industrial processes drives up demand for durable and high-performance touch screen displays.
Europe also plays an important role in the industry, notably in industries like automotive and aerospace, where precision and dependability are essential. Countries such as Germany, the United Kingdom, and France are leading the way in adopting these technologies, aided by robust manufacturing bases and a push toward Industry 4.0.
Industrial Touch Screen Display Market Players
Some of the top industrial touch screen display companies offered in our report includes Mitsubishi Electric Corporation, Beijer Electronics AB, Honeywell International Inc., Elo Touch Solutions, Advantech Co., Siemens AG, Schneider Electric, Planar Systems Inc., ABB Ltd, Rockwell Automation Inc., General Electric Company, and Weintek Labs.
Frequently Asked Questions
How big is the industrial touch screen display market?
The industrial touch screen display market size was valued at USD 3.2 billion in 2023.
What is the CAGR of the global industrial touch screen display market from 2024 to 2032?
The CAGR of industrial touch screen display is 7.2% during the analysis period of 2024 to 2032.
Which are the key players in the industrial touch screen display market?
The key players operating in the global market are including Mitsubishi Electric Corporation, Beijer Electronics AB, Honeywell International Inc., Elo Touch Solutions, Advantech Co., Siemens AG, Schneider Electric, Planar Systems Inc., ABB Ltd, Rockwell Automation Inc., General Electric Company, and Weintek Labs.
Which region dominated the global industrial touch screen display market share?
North America held the dominating position in industrial touch screen display industry during the analysis period of 2024 to 2032.
Which region registered fastest CAGR from 2024 to 2032?
Asia-Pacific region exhibited fastest growing CAGR for market of industrial touch screen display during the analysis period of 2024 to 2032.
What are the current trends and dynamics in the global industrial touch screen display industry?
The current trends and dynamics in the industrial touch screen display industry include growing demand for automation in manufacturing and industrial processes, rising adoption of industry 4.0 technologies, increasing need for durable and reliable touch screen interfaces in harsh environments, and expansion of the automotive and electronics industries.
Which component held the maximum share in 2023?
The hardware component held the maximum share of the industrial touch screen display industry.


