Hydropower Market Size - Global Industry, Share, Analysis, Trends and Forecast 2023 - 2032
Published :
Report ID:
Pages :
Format :
Hydropower Market Size - Global Industry, Share, Analysis, Trends and Forecast 2023 - 2032
Report Coverage
- Industry Dynamics
- Market Size and Forecast Data
- Segment Analysis
- Competitive Landscape
- Regional Analysis with a Niche Focus on Country-Level Data
- High Level Analysis - Porter's, PESTEL, Value Chain, etc.
- Company Profiles of Key Players
- Option to Customize the Report As Per Your Specific Need
Request Sample Report
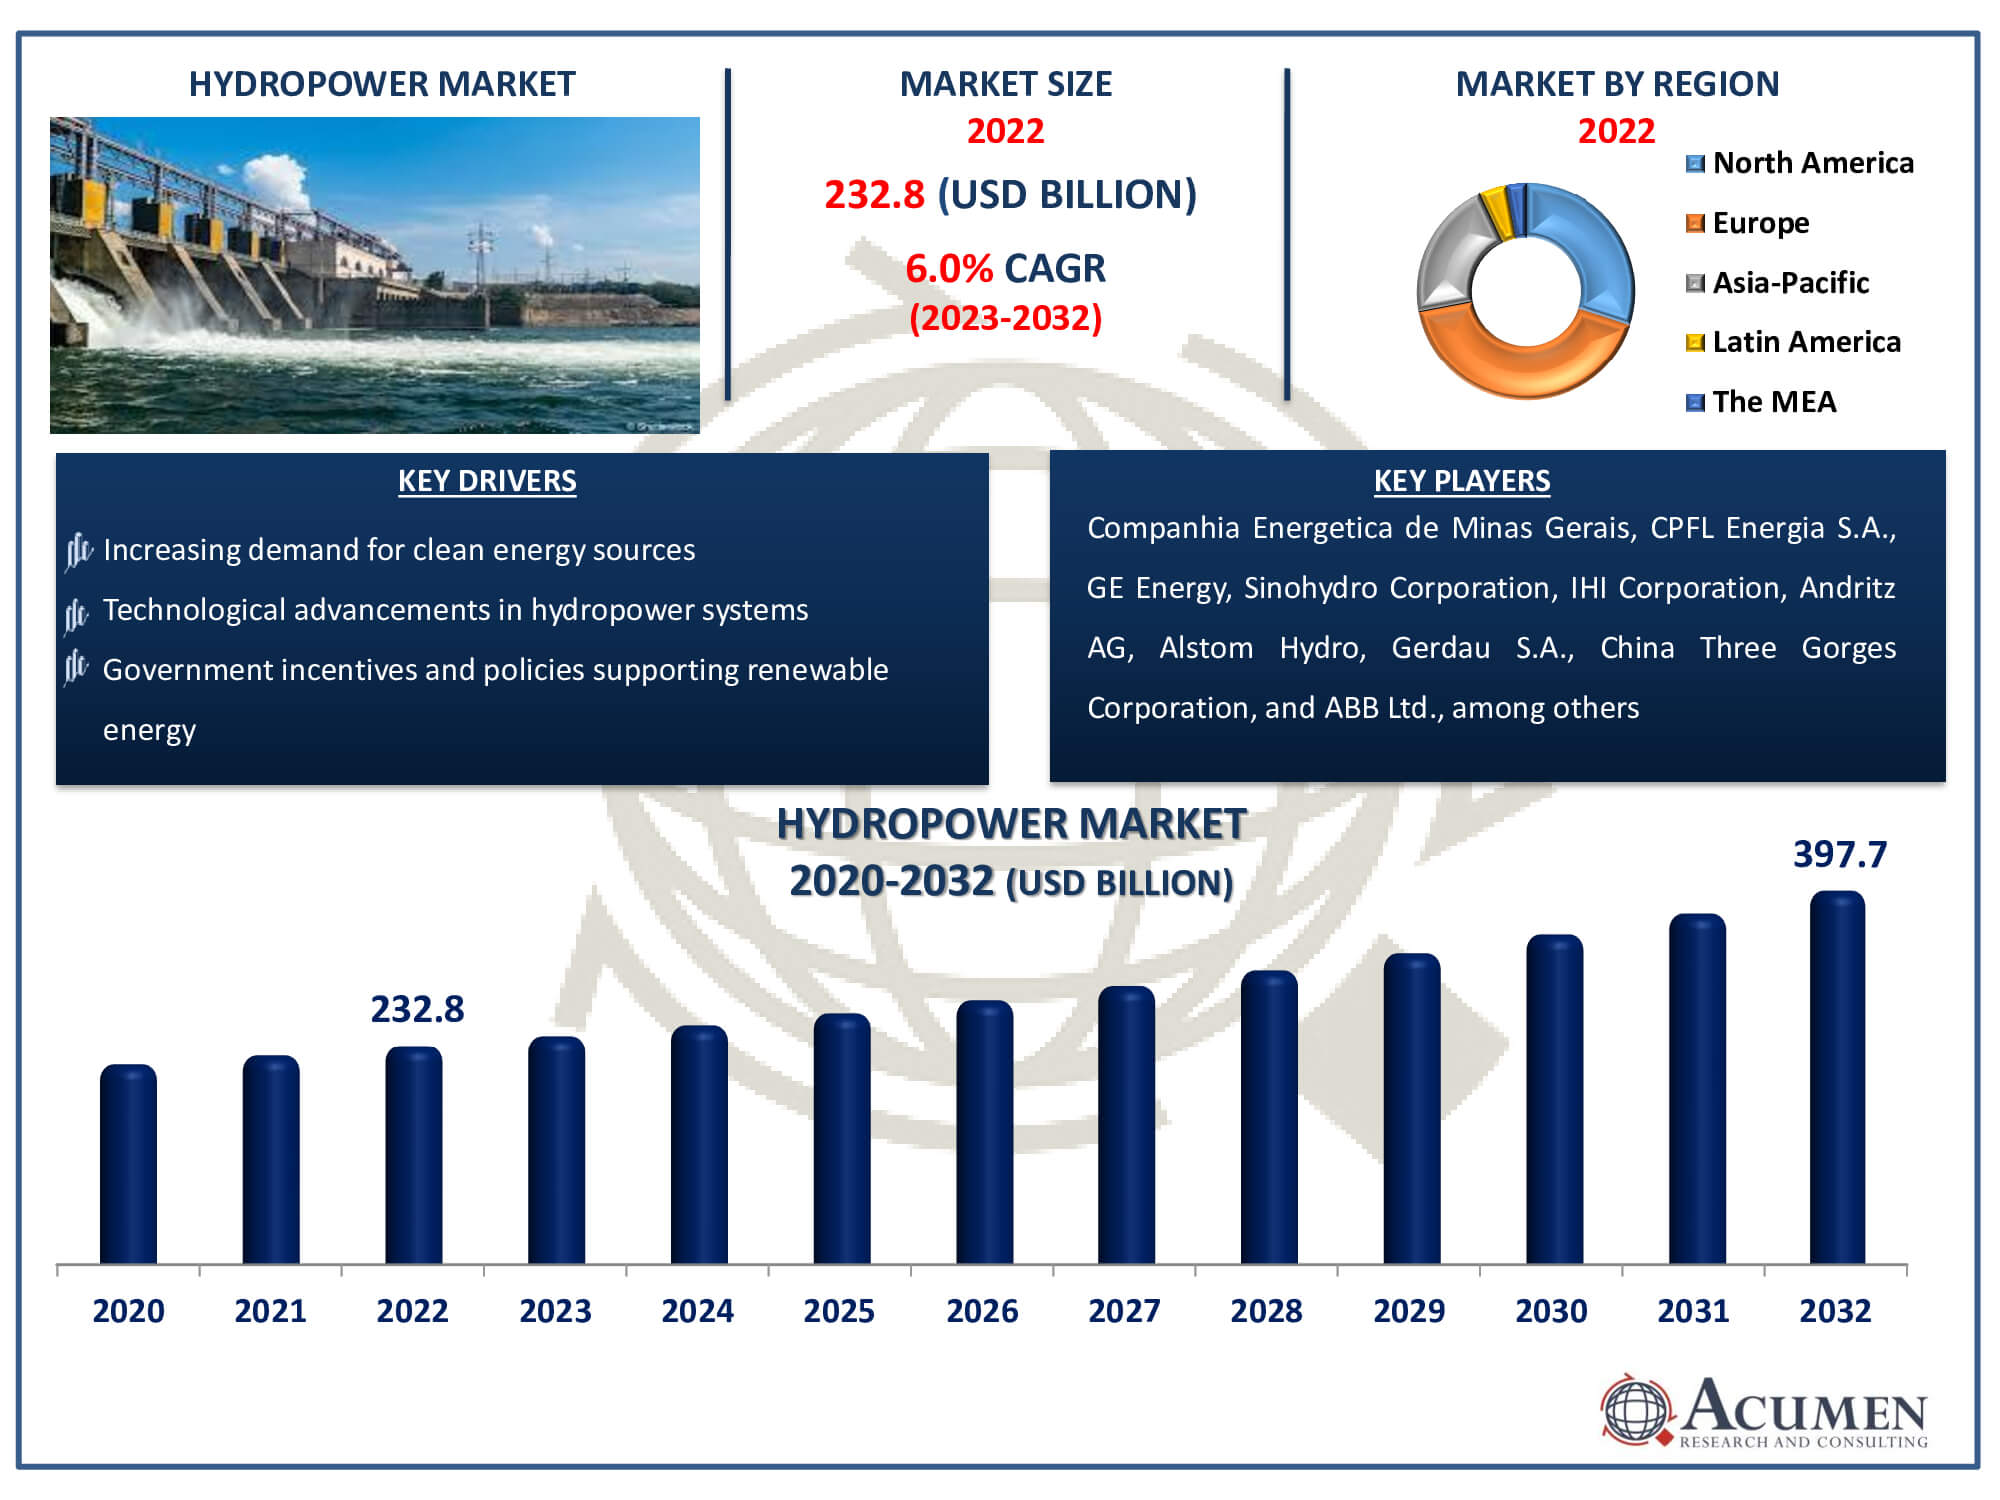
The Hydropower Market Size accounted for USD 232.8 Billion in 2022 and is estimated to achieve a market size of USD 397.7 Billion by 2032 growing at a CAGR of 5.6% from 2023 to 2032.
Hydropower Market Highlights
- Global hydropower market revenue is poised to garner USD 397.7 billion by 2032 with a CAGR of 5.6% from 2023 to 2032
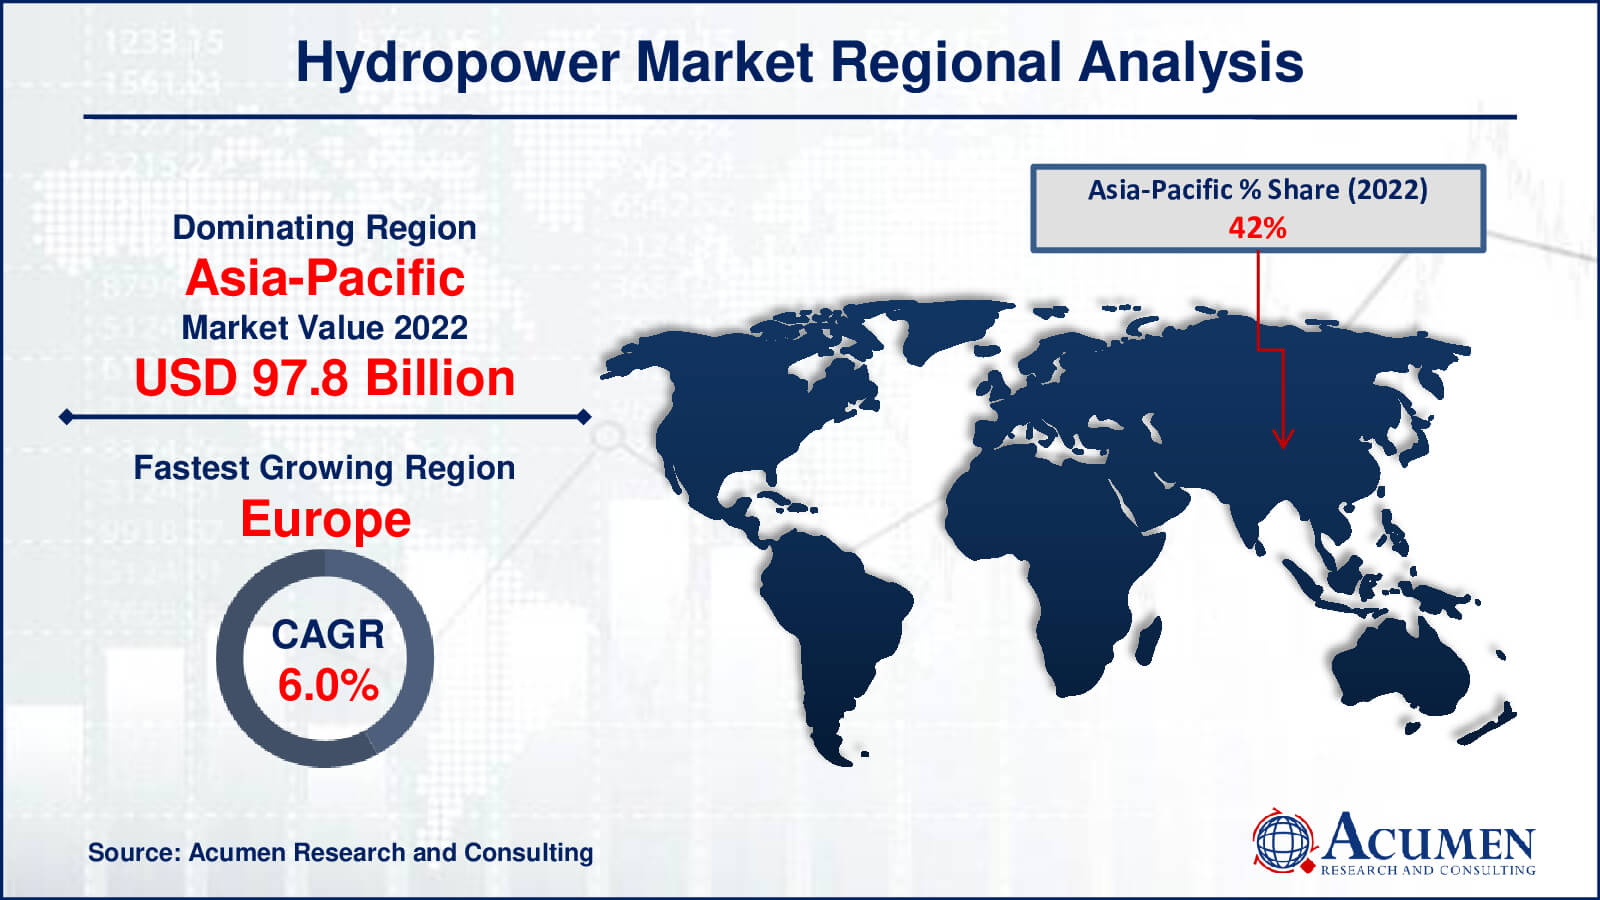
- Asia-Pacific hydropower market value occupied around USD 97.8 billion in 2022
- Europe hydropower market growth will record a CAGR of more than 6% from 2023 to 2032
- Among size, the large hydropower sub-segment generated more that USD 139.7 billion revenue in 2022
- Based on component, the civil construction sub-segment generated around 30% share in 2022
- Innovation in dam and turbine designs to enhance efficiency and minimize environmental impact is a popular hydropower market trend that fuels the industry demand

The main renewable energy source, hydropower, provides more than 80% of the world's renewable energy supply and roughly 16% of global energy production. Over 25 countries in the globe currently get 90% of their electricity from hydropower, with Norway leading the way at 99.3%. In addition, twelve nations get 100% of their energy from hydropower. Hydroelectricity is a major source of electricity in over 150 countries worldwide, and it is the primary source in 65 of those countries. Among the major producers of hydropower are China, the United States, and Canada.
Global Hydropower Market Dynamics
Market Drivers
- Increasing demand for clean energy sources
- Technological advancements in hydropower systems
- Growing awareness of environmental sustainability
- Government incentives and policies supporting renewable energy
Market Restraints
- High initial investment costs
- Environmental concerns and regulatory challenges
- Limited suitable locations for large-scale hydropower projects
Market Opportunities
- Expansion of small-scale and micro-hydropower projects
- Integration of hydropower with other renewable energy sources
- Emerging markets and untapped hydroelectric potential in developing regions
Hydropower Market Report Coverage
| Market | Hydropower Market |
| Hydropower Market Size 2022 | USD 232.8 Billion |
| Hydropower Market Forecast 2032 | USD 397.7 Billion |
| Hydropower Market CAGR During 2023 - 2032 | 5.6% |
| Hydropower Market Analysis Period | 2020 - 2032 |
| Hydropower Market Base Year |
2022 |
| Hydropower Market Forecast Data | 2023 - 2032 |
| Segments Covered | By Size, By Component, By End-User, And By Geography |
| Regional Scope | North America, Europe, Asia Pacific, Latin America, and Middle East & Africa |
| Key Companies Profiled | Companhia Energetica de Minas Gerais, CPFL Energia S.A., GE Energy, Sinohydro Corporation, IHI Corporation, Andritz AG, Alstom Hydro, Gerdau S.A., China Three Gorges Corporation, ABB Ltd., China Hydroelectric Corporation, The Tata Power Company, OJSC Bashkirenergo, EDP Energias do Brasil SA, and Ertan Hydropower Development Company, Ltd |
| Report Coverage |
Market Trends, Drivers, Restraints, Competitive Analysis, Player Profiling, Covid-19 Analysis, Regulation Analysis |
Hydropower Market Insights
Hydropower plants have experienced steady growth, largely driven by the demand for reliable, renewable, and accessible electricity, as countries seek alternatives to meet the carbon reduction goals outlined in the Paris Agreement. Electricity generation is widely recognized as a significant source of greenhouse gas emissions, particularly from traditional coal and petroleum-based power plants. However, electricity is an essential commodity necessary for modern life, with demand increasing alongside industrialization and urbanization. This reality has prompted governments worldwide to prioritize energy sources capable of generating renewable electricity, such as wind, solar, hydro, nuclear, geothermal, and others.
large hydropower installations accounted for over 50% of the total global hydropower capacity. The government of Uganda diligently monitors the development of identified hydropower sites in accordance with its hydropower master plan. Currently, two flagship schemes, Isimba (183.2 MW) and Karuma (600 MW), are operational in the country. Additionally, other major hydropower plants including Ayago (840 MW), Orianga (392 MW), Uhuru (350 MW), and Kiba (290 MW) are under construction. The overall market capacities in the region are expected to increase in the hydropower industry forecast period. The construction of the 1,800 MW Gran Eweng dam, the fourth largest hydropower plant in Africa, is underway and scheduled for completion by 2024. Another significant project in Africa is the Kpep (485 MW) and Makay (365 MW) projects. Cameroon anticipates expanding its hydropower capacity by approximately 3,000 MW through these initiatives.
Hydropower Market Segmentation
The worldwide market for hydropower is split based on size, component, end-user, and geography.
Hydropower Market by Sizes
- Large Hydropower
- Small Hydropower
- Micro Hydropower
Accordning to the hydropower industry analysis, based on their size, large, small, and micro hydropower segments make up the market. Large hydropower, defined as projects with a capacity more than 30 megawatts, controls the market because of its higher energy output and extensive infrastructure. Large hydropower projects are usually owned and run by utilities or major energy businesses, and they frequently need a substantial financial commitment. Because of the economies of scale that these projects enjoy, they can produce a sizable amount of electricity and make a major contribution to grid stability. Large hydropower projects also frequently have regulatory frameworks and government support in place, which further solidifies their market dominance. Because of this, the large hydropower segment dominates the hydropower market, which is not surprising given its crucial position in the world's energy output and renewable energy projects.
Hydropower Market by Components
- Civil Construction
- Electromechanical Equipment
- Electric
- Power Infrastructure
- Others
Owing to the significant infrastructure needed for hydropower projects, the civil construction sector commands the greatest proportion of the hydropower industry. The building of dams, reservoirs, tunnels, and other structures necessary for the diversion of water and the production of energy constitutes civil construction. Many times incorporating complicated terrain and environmental factors, these projects necessitate a high level of engineering knowledge and resources. Concrete pouring, site preparation, earthworks, and structural assembly are just a few of the many tasks that fall under the umbrella of the civil construction segment. Because these responsibilities are so large, a large amount of the project's total cost usually goes towards civil construction. Furthermore, the calibre and dependability of the civil infrastructure play a major role in the success of hydropower projects. Because of its vital role in enabling sustainable energy generation from hydropower sources, the civil construction segment emerges as the largest component in the hydropower industry.
Hydropower Market by End-Users
- Residential
- Commercial
- Industrial
The industrial sector usually holds the biggest proportion of the hydropower market because of its high electricity consumption for running operations and manufacturing processes. Because industries rely so largely on constant and dependable energy sources to maintain production activities, hydropower is a desirable alternative because of its generally stable output and renewable nature. Significant amounts of electricity are needed for industrial facilities including factories, refineries, and processing plants, and hydropower provides a stable source that can meet their high energy requirements. Furthermore, companies frequently possess the infrastructure and ability to directly incorporate hydropower into their operations, either through long-term power purchase agreements or on-site installations. Since industrial processes require efficient and sustainable energy solutions, the industrial segment ends up being the largest end-user in the hydropower market.
Hydropower Market Regional Outlook
North America
- U.S.
- Canada
Europe
- U.K.
- Germany
- France
- Spain
- Rest of Europe
Asia-Pacific
- India
- Japan
- China
- Australia
- South Korea
- Rest of Asia-Pacific
Latin America
- Brazil
- Mexico
- Rest of Latin America
The Middle East & Africa
- South Africa
- GCC Countries
- Rest of the Middle East & Africa (ME&A)

Hydropower Market Regional Analysis
In terms of revenue, as demand for hydropower in the Asia Pacific region increases, the installed capacity of countries in the region contributes significantly to the global market share. Hydropower is the primary source of electricity in China, and the country plans to add more hydro capacity to its infrastructure than any other Asian country. China's five-year energy growth program aims to increase coal consumption while targeting a minimum 15% share of non-fossil fuel electricity. Europe plays a moderately significant role in global sales and is expected to experience substantial growth over the hydropower industry projected period. The adoption of renewable energy in the region is projected to accelerate due to environmental concerns and government initiatives. In the forecast period, the North American hydropower market is expected to expand. Additionally, the market in the Middle East and Africa is in the early stages of reaching its target market and is projected to experience strong growth as energy demand in the region increases. According to a report published by the World Energy Council, hydropower is the leading renewable source for power generation, accounting for 71% of global renewable electricity. The overall installed capacity was 1,064 GW, representing 16.4% of all energy sources worldwide.
Hydropower Market Players
Some of the top hydropower companies offered in our report includes Companhia Energetica de Minas Gerais, CPFL Energia S.A., GE Energy, Sinohydro Corporation, IHI Corporation, Andritz AG, Alstom Hydro, Gerdau S.A., China Three Gorges Corporation, ABB Ltd., China Hydroelectric Corporation, The Tata Power Company, OJSC Bashkirenergo, EDP Energias do Brasil SA, and Ertan Hydropower Development Company, Ltd.
Frequently Asked Questions
How big is the Hydropower market?
The hydropower market size was valued at USD 232.8 billion in 2022.
What is the CAGR of the global hydropower market from 2023 to 2032?
The CAGR of hydropower is 5.6% during the analysis period of 2023 to 2032.
Which are the key players in the hydropower market?
The key players operating in the global market are including Companhia Energetica de Minas Gerais, CPFL Energia S.A., GE Energy, Sinohydro Corporation, IHI Corporation, Andritz AG, Alstom Hydro, Gerdau S.A., China Three Gorges Corporation, ABB Ltd., China Hydroelectric Corporation, The Tata Power Company, OJSC Bashkirenergo, EDP Energias do Brasil SA, and Ertan Hydropower Development Company, Ltd.
Which region dominated the global hydropower market share?
Asia-Pacific held the dominating position in hydropower industry during the analysis period of 2023 to 2032.
Which region registered fastest CAGR from 2023 to 2032?
Europe region exhibited fastest growing CAGR for market of hydropower during the analysis period of 2023 to 2032.
What are the current trends and dynamics in the global hydropower industry?
The current trends and dynamics in the hydropower industry include increasing demand for clean energy sources, technological advancements in hydropower systems, growing awareness of environmental sustainability, and government incentives and policies supporting renewable energy.
Which component held the maximum share in 2022?
The civil construction component held the maximum share of the hydropower industry.


