Green Ammonia Market | Acumen Research and Consulting
Green Ammonia Market Size - Global Industry, Share, Analysis, Trends and Forecast 2023 - 2032
Published :
Report ID:
Pages :
Format : ![]()
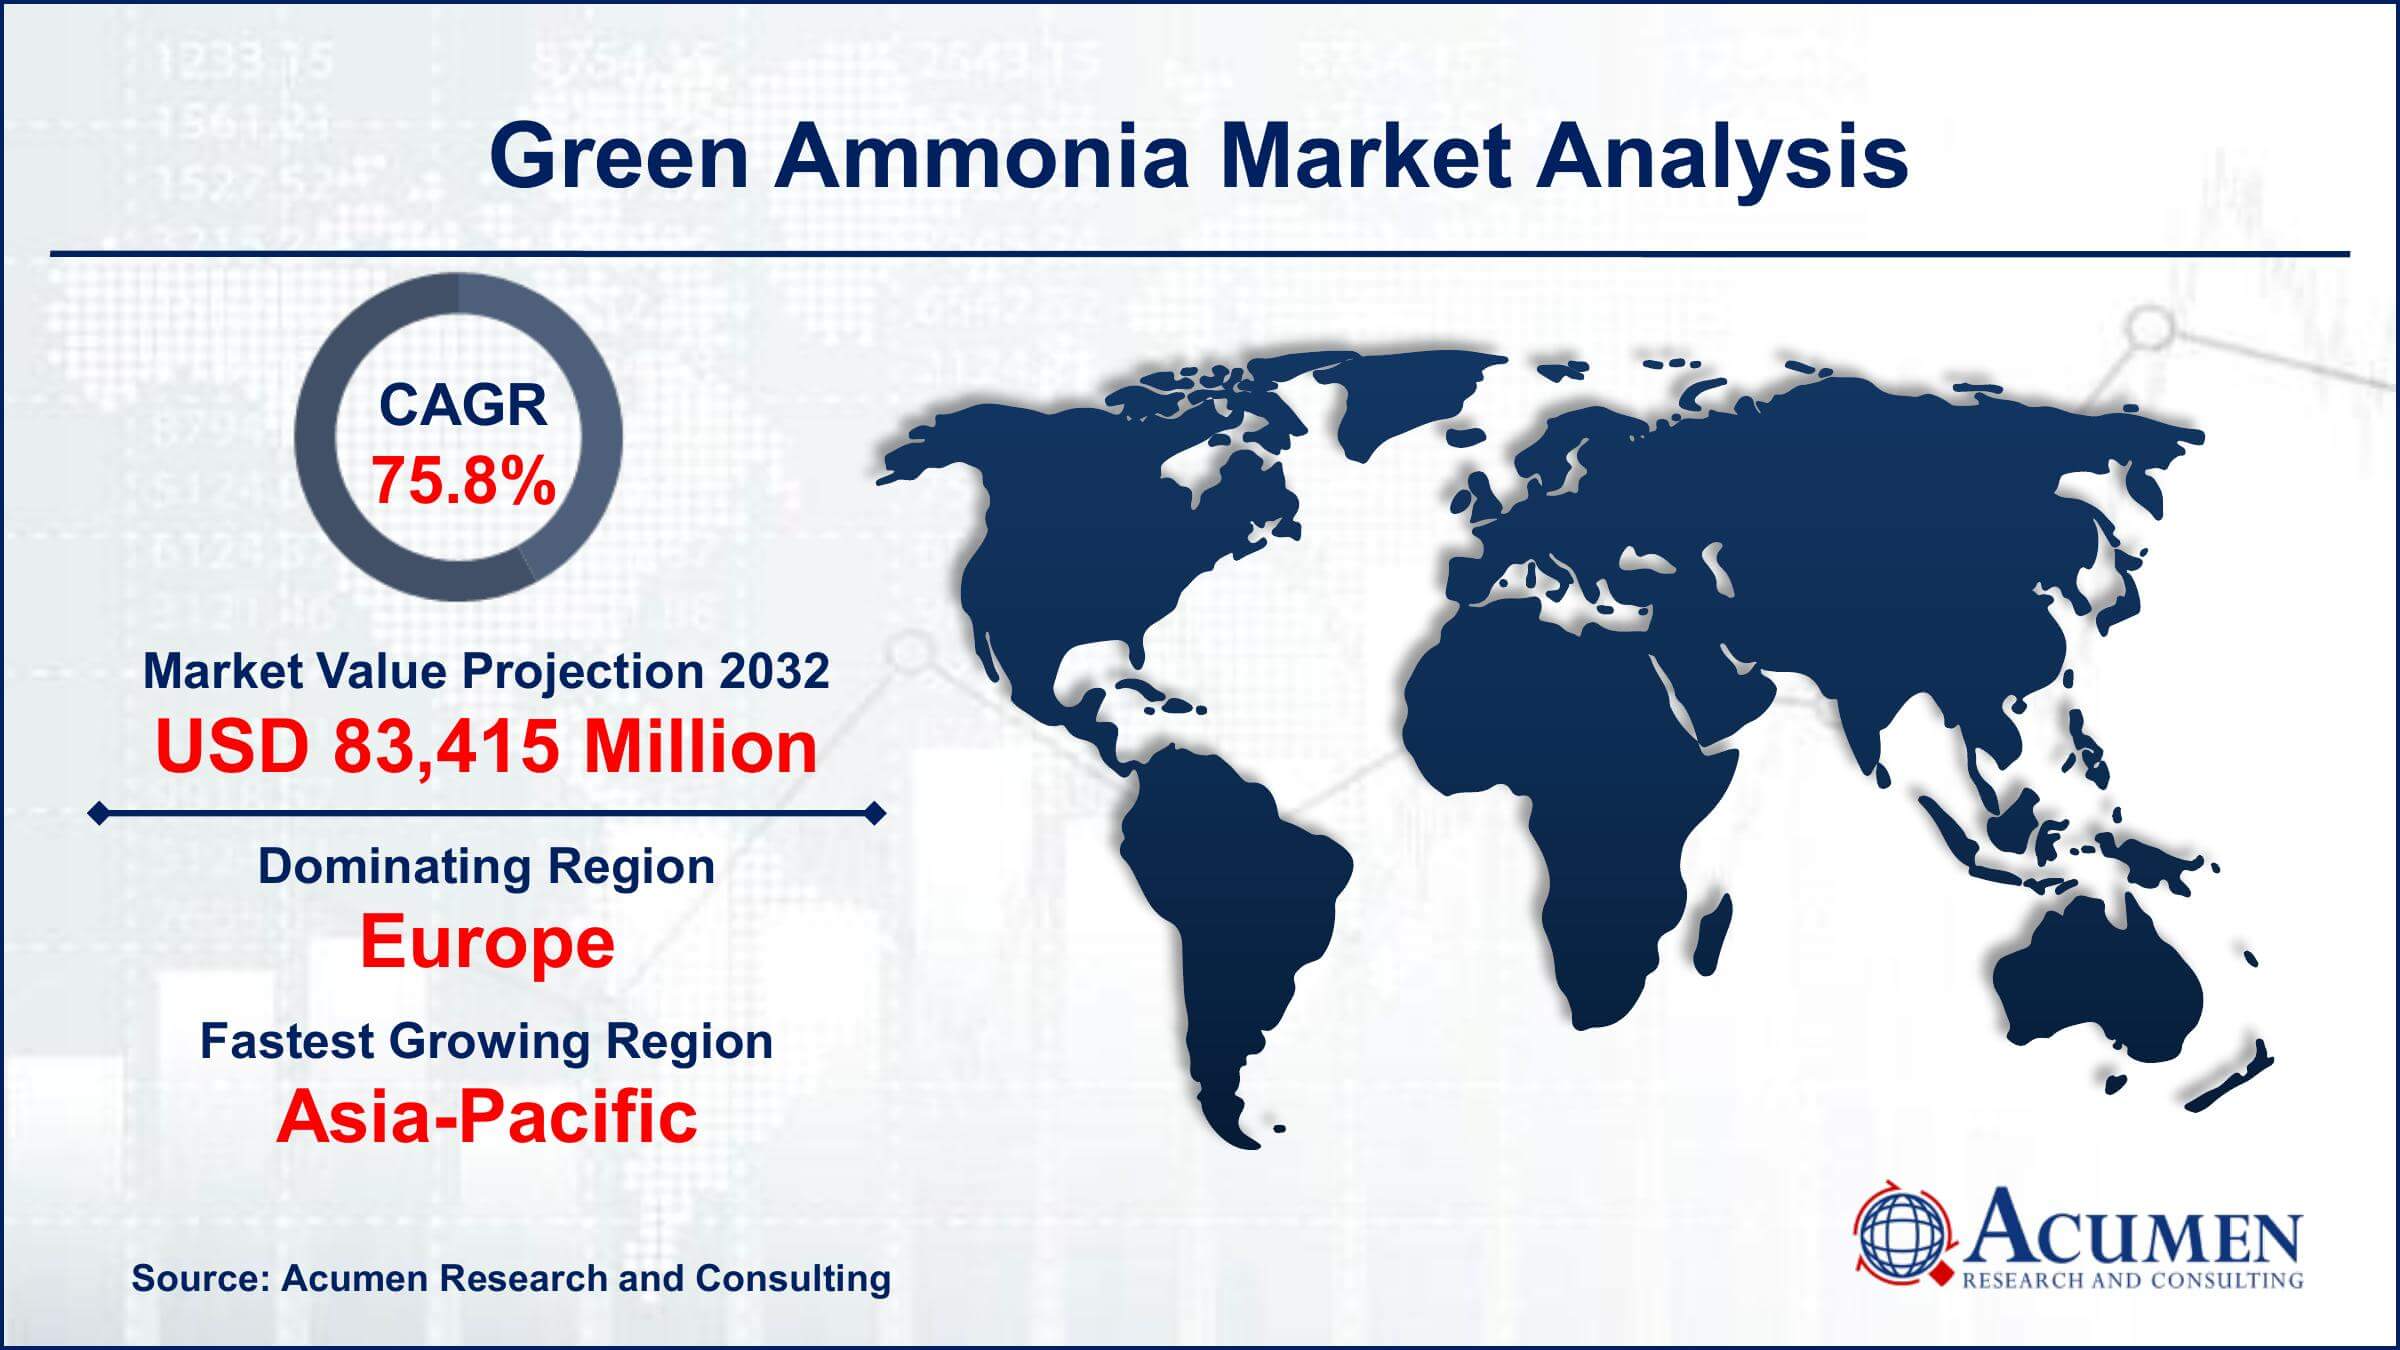
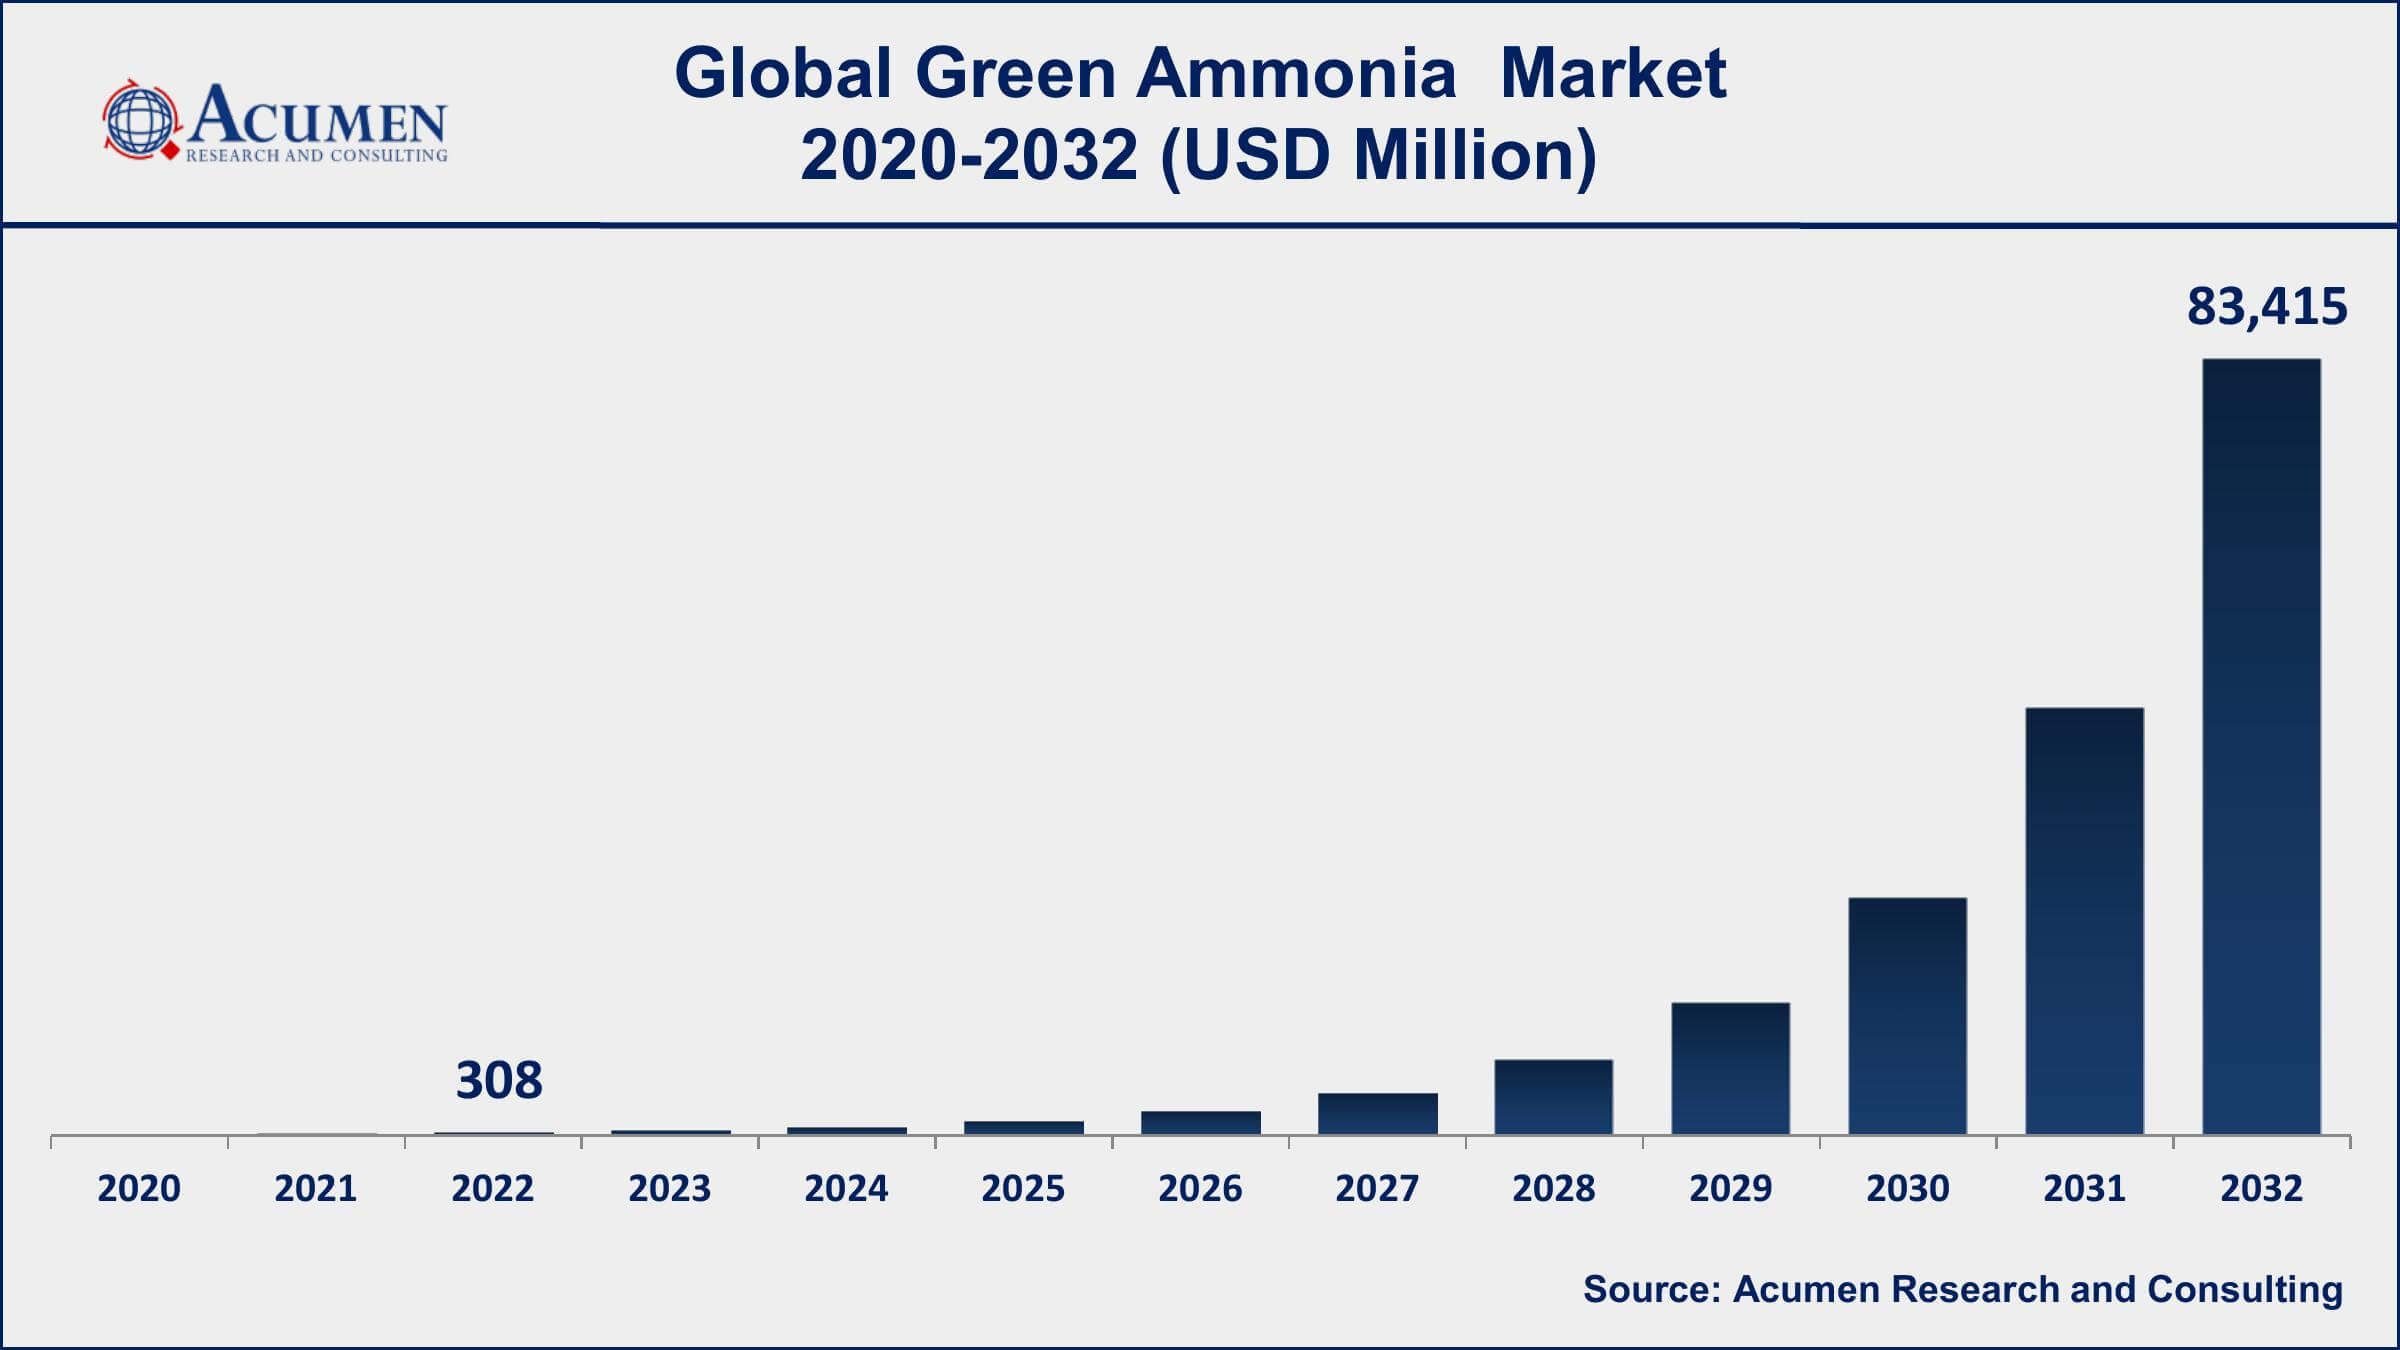
The Global Green Ammonia Market Size accounted for USD 308 Million in 2022 and is projected to achieve a market size of USD 83,415 Million by 2032 growing at a CAGR of 75.8% from 2023 to 2032.
Green Ammonia Market Highlights
- Global Green Ammonia Market revenue is expected to increase by USD 83,415 Million by 2032, with a 75.8% CAGR from 2023 to 2032
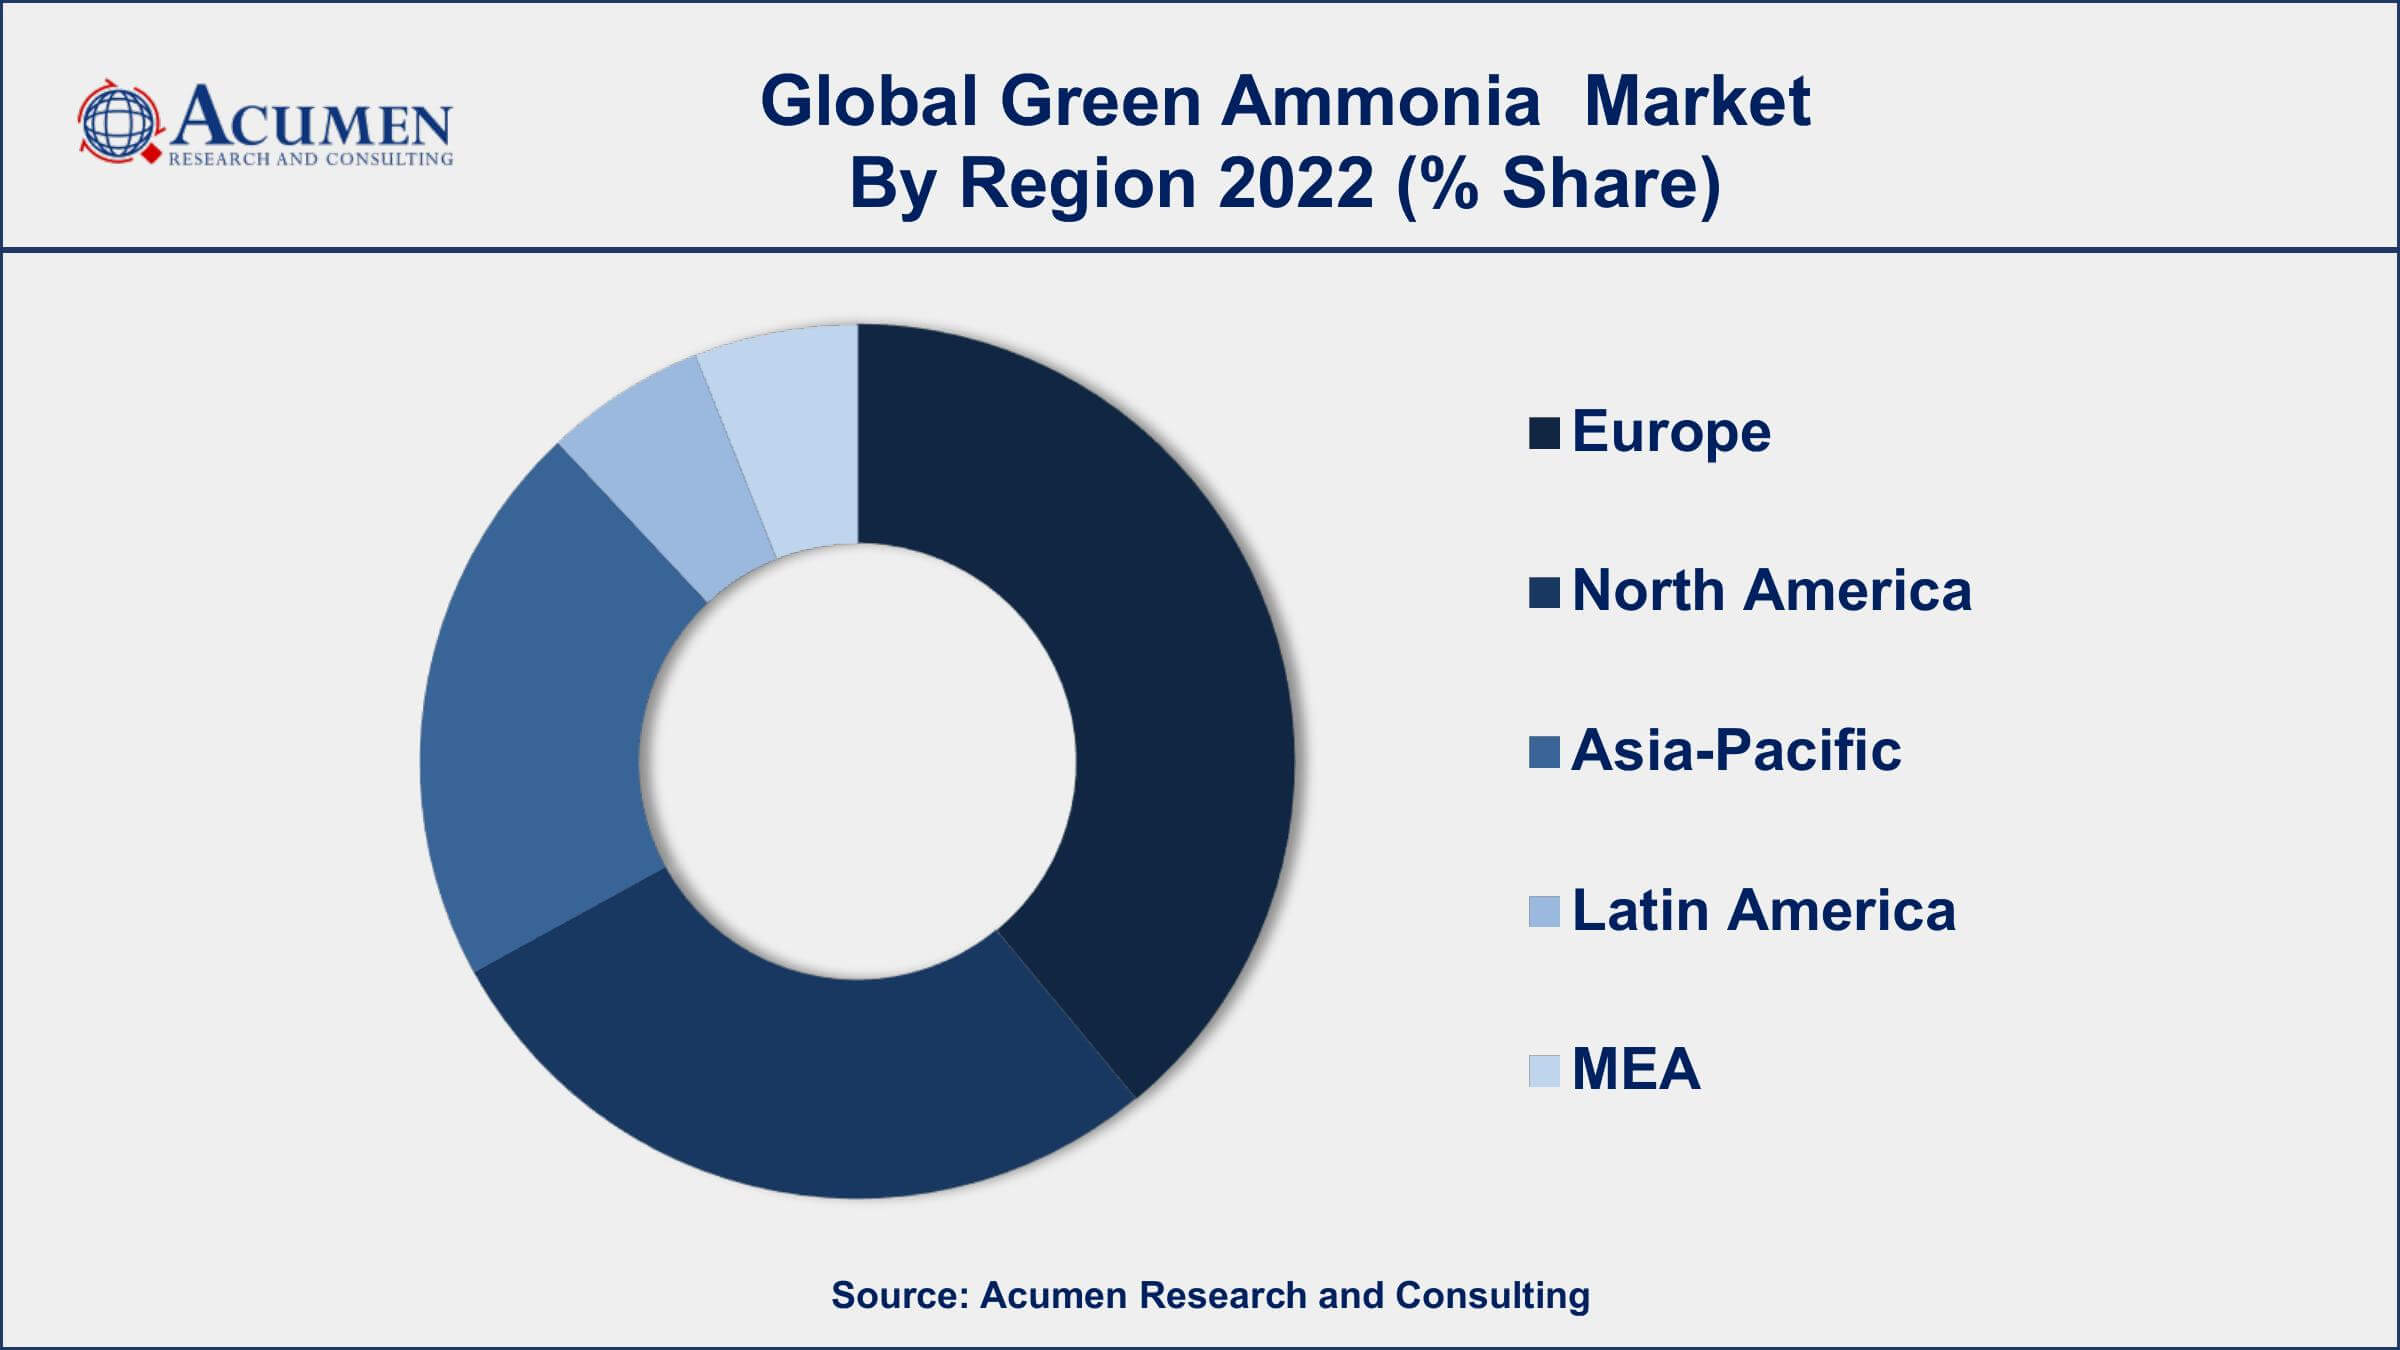
- Europe region led with more than 37% of Green Ammonia Market share in 2022
- Asia-Pacific Green Ammonia Market growth will record a CAGR of more than 82.1% from 2023 to 2032
- By technology, the alkaline water electrolysis segment has accounted more than 39% of the revenue share in 2022
- By end user, the power generation segment is expected to expand at the biggest CAGR of 79% from 2023 to 2032
- Increasing global focus on decarbonization and sustainability, drives the Green Ammonia Market value

Green ammonia, also known as sustainable ammonia or carbon-free ammonia, is a type of ammonia produced using renewable energy sources, such as wind, solar, or hydroelectric power, instead of relying on fossil fuels like natural gas. The traditional method of ammonia production, known as the Haber-Bosch process, is energy-intensive and emits a significant amount of greenhouse gases. Green ammonia, on the other hand, utilizes clean energy to produce hydrogen through water electrolysis, which is then combined with nitrogen to create ammonia. This process significantly reduces carbon emissions and offers a promising solution to decarbonize the fertilizer, chemical, and energy sectors while also serving as an energy carrier and a means of energy storage.
The market for green ammonia has been experiencing substantial growth over the past few years due to increasing global concerns about climate change and the urgent need to transition to sustainable energy solutions. Governments, businesses, and consumers are becoming more environmentally conscious, driving the demand for green alternatives. Additionally, as renewable energy technologies continue to advance and become more cost-competitive, the production of green ammonia becomes more economically viable. The growth of green ammonia is also spurred by its potential applications, including as a carbon-free fuel for ships and heavy transport, as a clean substitute for traditional ammonia-based fertilizers, and as a source of hydrogen for various industrial processes.

Global Green Ammonia Market Trends
Market Drivers
- Increasing global focus on decarbonization and sustainability
- Growing demand for clean energy and low-carbon alternatives
- Government support and incentives for renewable energy and green technologies
- Advancements in renewable energy sources, such as wind, solar, and hydroelectric power
Market Restraints
- High upfront costs and capital investments for green ammonia production facilities
- Limited infrastructure for green ammonia production and distribution
Market Opportunities
- Growing demand for sustainable agriculture and green fertilizers
- Emerging markets for green hydrogen and its derivatives
Green Ammonia Market Report Coverage
| Market | Green Ammonia Market |
| Green Ammonia Market Size 2022 | USD 308 Million |
| Green Ammonia Market Forecast 2032 | USD 83,415 Million |
| Green Ammonia Market CAGR During 2023 - 2032 | 75.8% |
| Green Ammonia Market Analysis Period | 2020 - 2032 |
| Green Ammonia Market Base Year | 2022 |
| Green Ammonia Market Forecast Data | 2023 - 2032 |
| Segments Covered | By Technology, By End User, By Sales Channel, And By Geography |
| Regional Scope | North America, Europe, Asia Pacific, Latin America, and Middle East & Africa |
| Key Companies Profiled | Siemens Energy AG, Yara International ASA, Ammonia Casale SA, Haldor Topsoe A/S, Nel ASA, thyssenkrupp Industrial Solutions AG, Mitsubishi Heavy Industries, Ltd., Kawasaki Heavy Industries, Ltd., ITM Power plc, MAN Energy Solutions SE, Green Hydrogen Systems A/S, and CF Industries Holdings, Inc. |
| Report Coverage |
Market Trends, Drivers, Restraints, Competitive Analysis, Player Profiling, Covid-19 Analysis, Regulation Analysis |
Green ammonia is a sustainable and environmentally friendly form of ammonia produced through a carbon-neutral or low-carbon process. Unlike traditional ammonia production, which relies on fossil fuels and emits significant greenhouse gases, green ammonia is generated using renewable energy sources like wind, solar, or hydroelectric power. The production process involves first obtaining hydrogen through water electrolysis, where electricity splits water into hydrogen and oxygen. This green hydrogen is then combined with nitrogen from the air to synthesize ammonia without releasing carbon dioxide into the atmosphere. By avoiding carbon emissions, green ammonia offers a promising solution to mitigate climate change and reduce the carbon footprint of various industries.
The applications of green ammonia are diverse and hold significant potential in multiple sectors. One of the primary uses is as a cleaner alternative to traditional ammonia-based fertilizers in agriculture. As the global demand for food increases, so does the need for sustainable farming practices. Green ammonia provides a way to produce nitrogen-based fertilizers without contributing to climate change, making it an eco-friendly option for promoting efficient and environmentally conscious agriculture. Another essential application is as an energy carrier and storage medium.
The green ammonia market was experiencing significant growth and gaining momentum as a key player in the global energy transition. The increasing awareness of climate change and the urgent need to reduce greenhouse gas emissions have been major driving forces behind the surge in demand for sustainable and low-carbon alternatives like green ammonia. One of the primary drivers of the green ammonia market growth is the rapid expansion of renewable energy sources. The falling costs and increasing efficiency of renewable technologies, such as wind and solar power, have made them more accessible and attractive for green ammonia production. As a result, the integration of renewable energy into the ammonia production process has become more economically viable, leading to a rise in green ammonia projects worldwide.
Green Ammonia Market Segmentation
The global Green Ammonia Market segmentation is based on technology, end user, sales channel, and geography.
Green Ammonia Market By Technology
- Alkaline Water Electrolysis
- Solid Oxide Electrolysis
- Proton Exchange Membrane
According to the green ammonia industry analysis, the alkaline water electrolysis segment accounted for the largest market share in 2022. This growth due to its pivotal role in producing green hydrogen, a critical component in green ammonia production. Alkaline water electrolysis is a well-established and widely adopted technology for hydrogen generation, and its continued development has contributed significantly to the expansion of the green ammonia sector. One of the key drivers of the segment's growth is the increasing deployment of renewable energy sources. Alkaline water electrolysis systems are highly compatible with intermittent renewable energy, such as wind and solar power, which allows for the efficient utilization of excess electricity generated during periods of low demand. As the global capacity of renewable energy installations continues to rise, the demand for hydrogen produced via alkaline water electrolysis for green ammonia production is expected to grow significantly.
Green Ammonia Market By End User
- Transportation
- Fertilizers
- Power Generation
- Others
In terms of end users, the power generation segment is expected to witness significant growth in the coming years. Green ammonia has emerged as a potential energy carrier, with the ability to store and transport hydrogen efficiently, making it an attractive option for power generation. One of the key drivers behind the growth of the power generation segment is the increasing global focus on decarbonization and the transition to renewable energy sources. Green ammonia offers a unique advantage as it can be stored and transported easily, making it a viable option for providing consistent power from renewable energy, even during periods of low wind or sunlight. It can act as a clean energy buffer, helping to stabilize grids and enhance the reliability of renewable power generation. Furthermore, advancements in technology and the integration of fuel cells or gas turbines with ammonia-based systems have improved the efficiency and cost-effectiveness of green ammonia-based power generation.
Green Ammonia Market By Sales Channel
- Indirect Sale
- Direct Sale
According to the green ammonia market forecast, the direct sale segment is expected to witness significant growth in the coming years. This segment involves the direct sale of green ammonia to end-users, including agriculture, chemical manufacturing, and other industrial processes that rely on ammonia-based products. As the demand for sustainable and low-carbon solutions rises, industries are increasingly seeking green alternatives to traditional ammonia, and direct sales of green ammonia have emerged as a viable option. One of the primary drivers of the direct sale segment's growth is the increasing awareness and commitment to sustainability and environmental responsibility among businesses and consumers.
Green Ammonia Market Regional Outlook
North America
- U.S.
- Canada
Europe
- U.K.
- Germany
- France
- Spain
- Rest of Europe
Asia-Pacific
- India
- Japan
- China
- Australia
- South Korea
- Rest of Asia-Pacific
Latin America
- Brazil
- Mexico
- Rest of Latin America
The Middle East & Africa
- South Africa
- GCC Countries
- Rest of the Middle East & Africa (ME&A)

Green Ammonia Market Regional Analysis
Europe is emerging as a dominating region in the green ammonia market due to several key factors that have propelled the region to the forefront of sustainable energy and climate action. One of the primary reasons is Europe's strong commitment to decarbonization and achieving climate neutrality. The European Union (EU) has set ambitious climate goals, such as the European Green Deal and the goal of becoming climate-neutral by 2050. These targets have stimulated significant investments and policy support for green technologies, including green ammonia production. Additionally, Europe benefits from a well-established renewable energy sector, with a substantial share of its electricity generated from renewable sources like wind, solar, and hydroelectric power. This abundant and reliable supply of renewable energy provides a conducive environment for green ammonia production, as it is a key component in the water electrolysis process used to generate green hydrogen, the primary feedstock for green ammonia.
Green Ammonia Market Player
Some of the top green ammonia market companies offered in the professional report include Siemens Energy AG, Yara International ASA, Ammonia Casale SA, Haldor Topsoe A/S, Nel ASA, thyssenkrupp Industrial Solutions AG, Mitsubishi Heavy Industries, Ltd., Kawasaki Heavy Industries, Ltd., ITM Power plc, MAN Energy Solutions SE, Green Hydrogen Systems A/S, and CF Industries Holdings, Inc.
Frequently Asked Questions
What was the market size of the global green ammonia in 2022?
The market size of green ammonia was USD 308 Million in 2022.
What is the CAGR of the global green ammonia market from 2023 to 2032?
The CAGR of green ammonia is 75.8% during the analysis period of 2023 to 2032.
Which are the key players in the green ammonia market?
The key players operating in the global market are including Siemens Energy AG, Yara International ASA, Ammonia Casale SA, Haldor Topsoe A/S, Nel ASA, thyssenkrupp Industrial Solutions AG, Mitsubishi Heavy Industries, Ltd., Kawasaki Heavy Industries, Ltd., ITM Power plc, MAN Energy Solutions SE, Green Hydrogen Systems A/S, and CF Industries Holdings, Inc.
Which region dominated the global green ammonia market share?
Europe held the dominating position in green ammonia industry during the analysis period of 2023 to 2032.
Which region registered fastest CAGR from 2023 to 2032?
Asia-Pacific region exhibited fastest growing CAGR for market of green ammonia during the analysis period of 2023 to 2032.
What are the current trends and dynamics in the global green ammonia industry?
The current trends and dynamics in the green ammonia industry include increasing global focus on decarbonization and sustainability, and growing demand for clean energy and low-carbon alternatives.
Which technology held the maximum share in 2022?
The alkaline water electrolysis technology held the maximum share of the green ammonia industry.


