Recycled Elastomers Market Size - Global Industry, Share, Analysis, Trends and Forecast 2024 - 2032
Published :
Report ID:
Pages :
Format :
Recycled Elastomers Market Size - Global Industry, Share, Analysis, Trends and Forecast 2024 - 2032
Report Coverage
- Industry Dynamics
- Market Size and Forecast Data
- Segment Analysis
- Competitive Landscape
- Regional Analysis with a Niche Focus on Country-Level Data
- High Level Analysis - Porter's, PESTEL, Value Chain, etc.
- Company Profiles of Key Players
- Option to Customize the Report As Per Your Specific Need
Request Sample Report
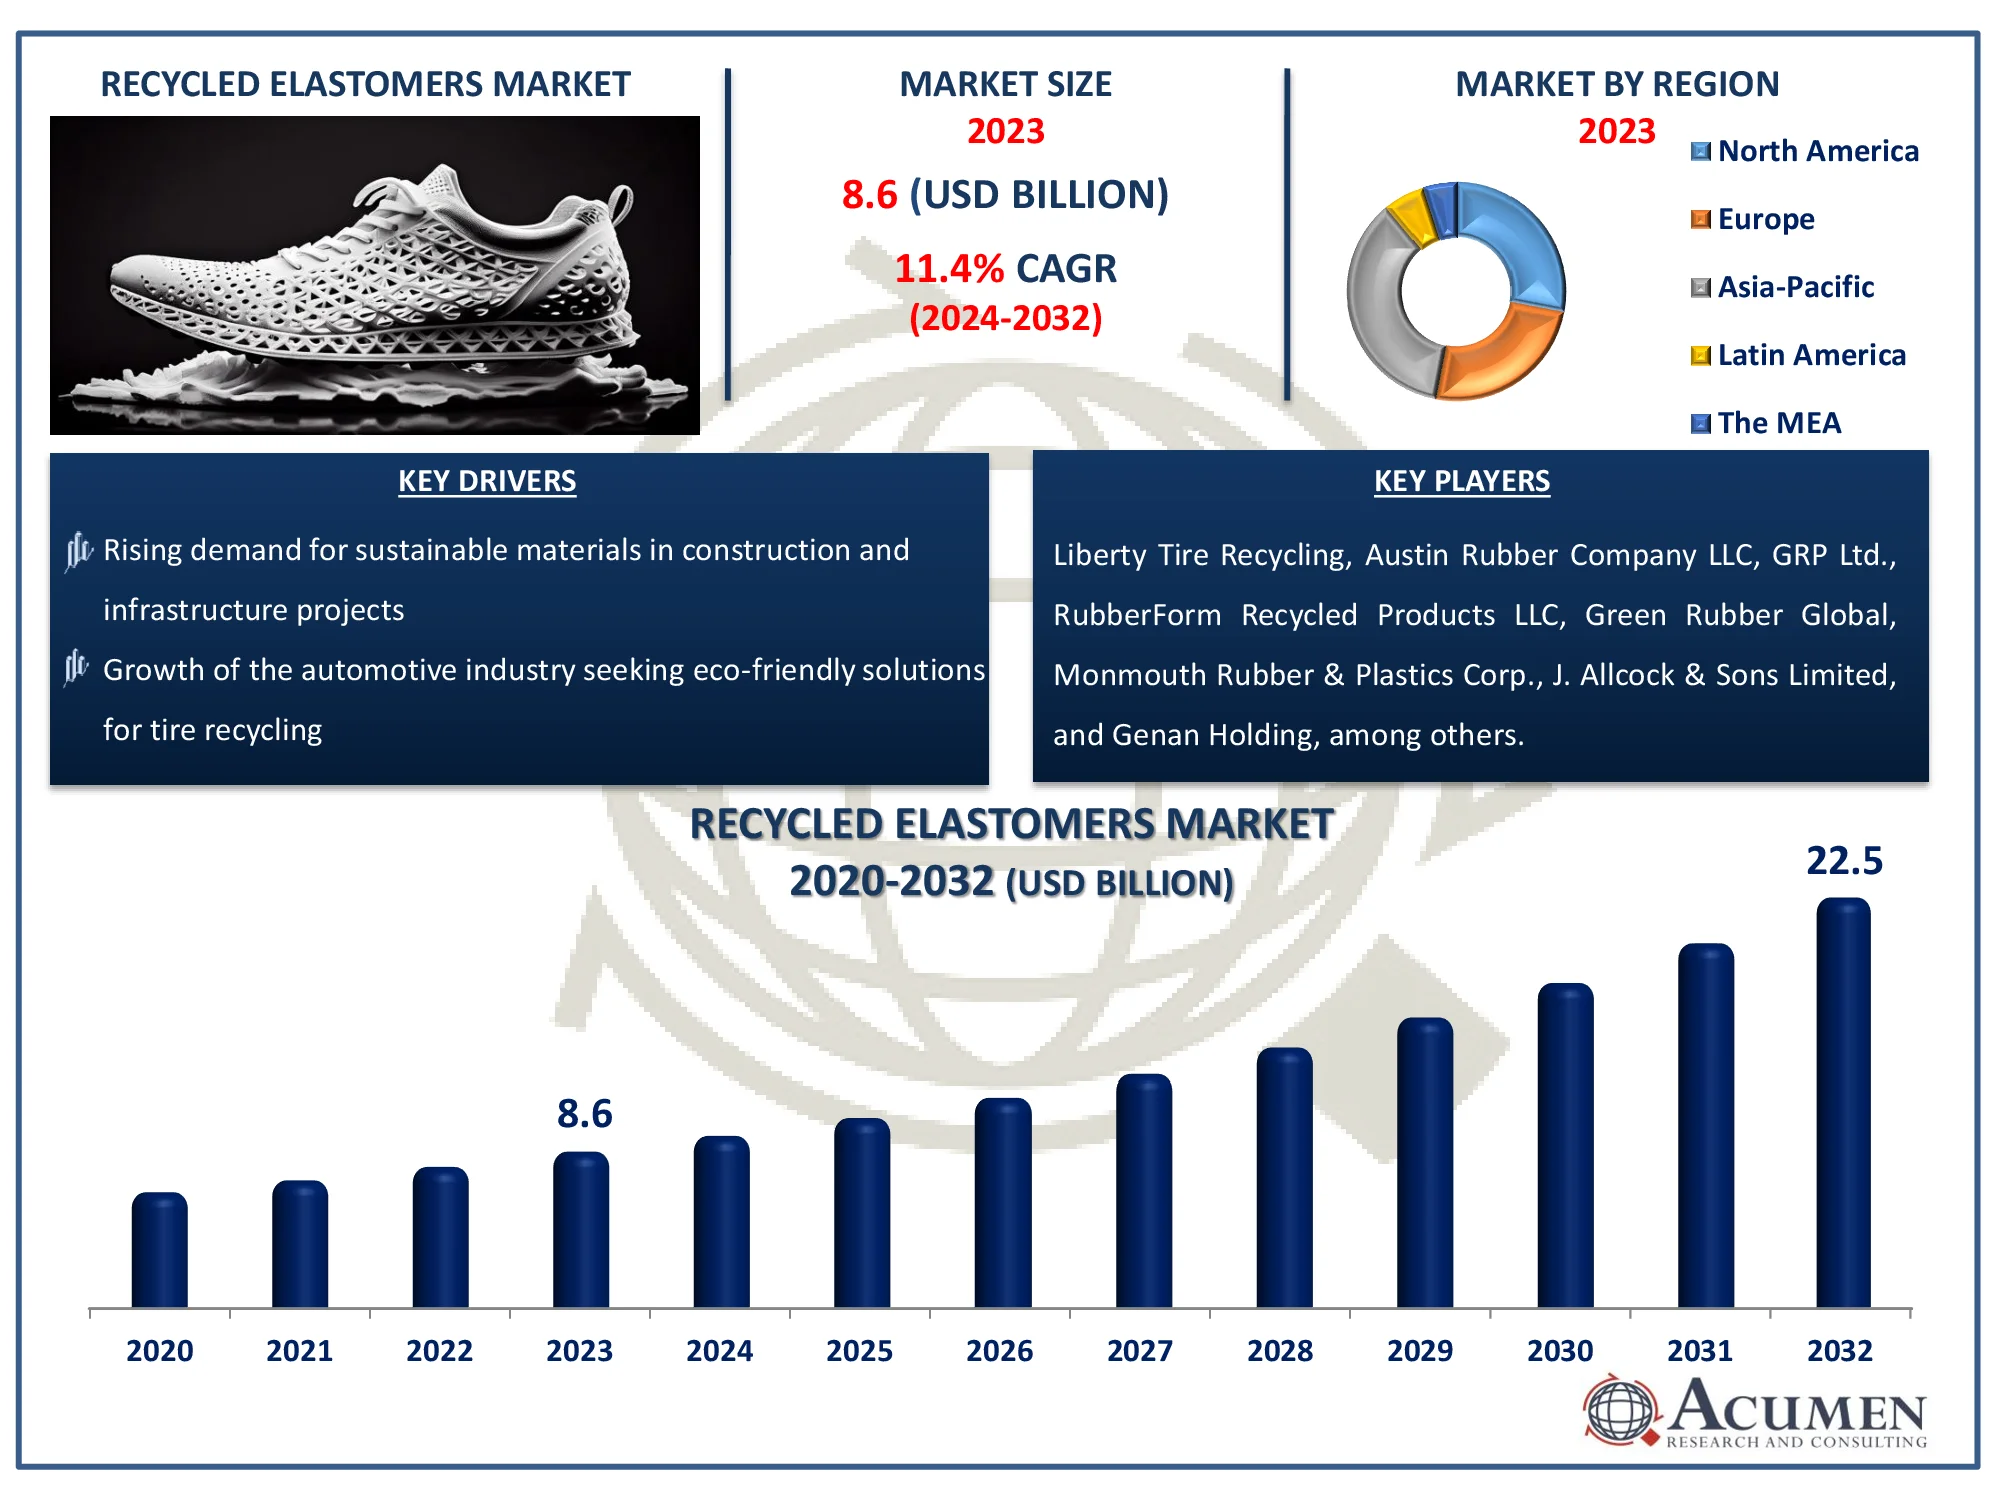
The Global Recycled Elastomers Market Size accounted for USD 8.6 Billion in 2023 and is estimated to achieve a market size of USD 22.5 Billion by 2032 growing at a CAGR of 11.4% from 2024 to 2032.
Recycled Elastomers Market Highlights
- Global recycled elastomers market revenue is poised to garner USD 22.5 billion by 2032 with a CAGR of 11.4% from 2024 to 2032
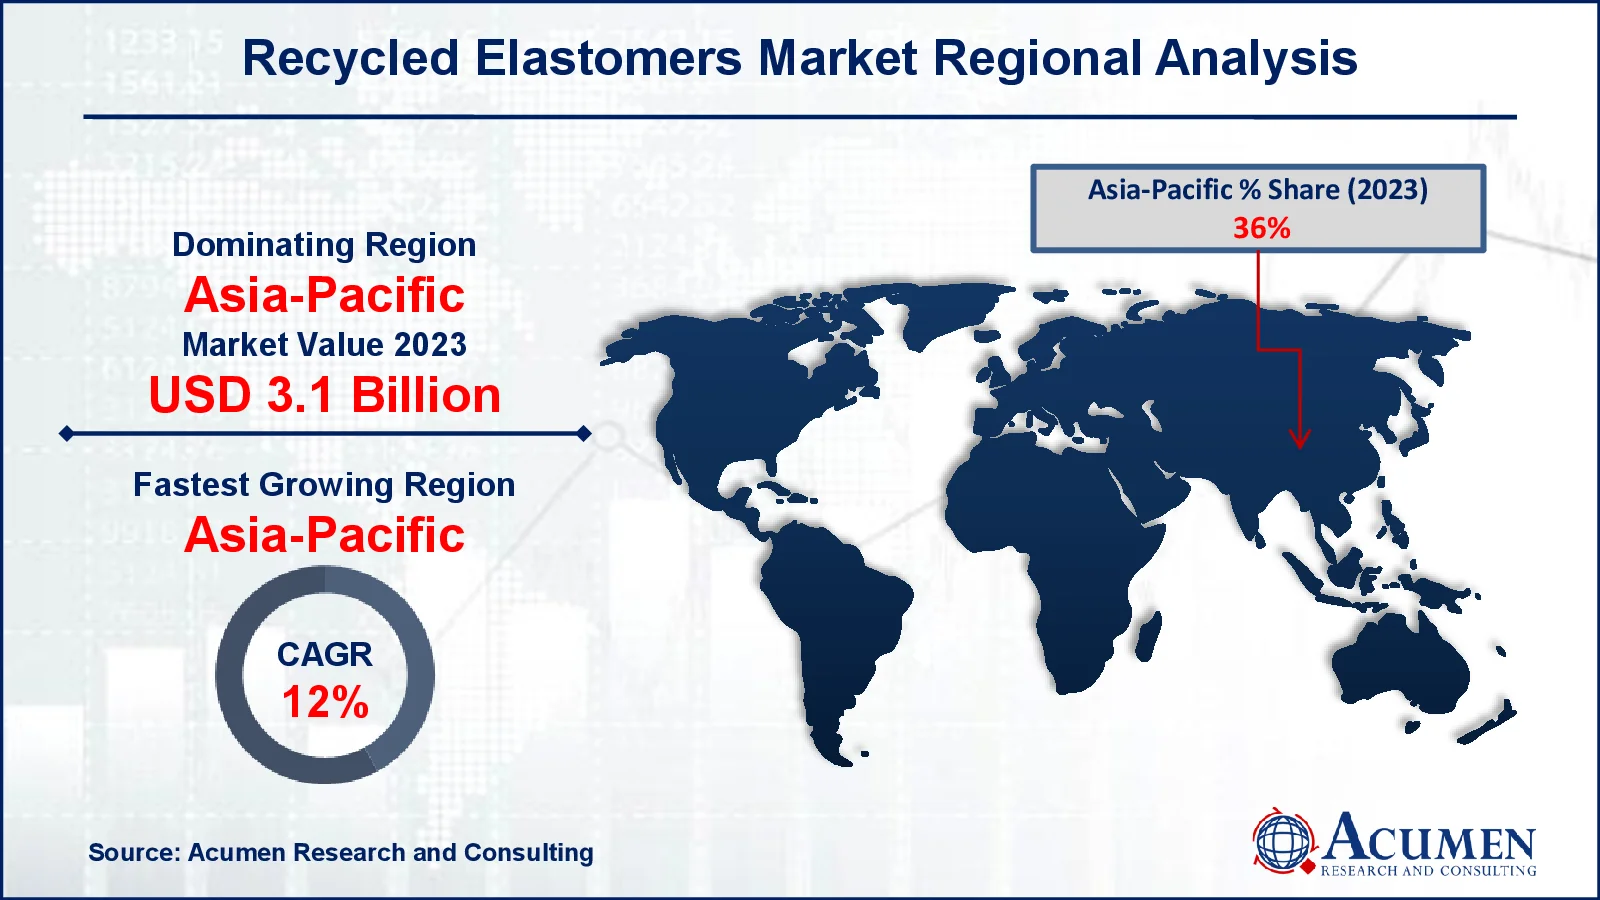
- Asia-Pacific recycled elastomers market value occupied around USD 3.1 billion in 2023
- Asia-Pacific recycled elastomers market growth will record a CAGR of more than 12% from 2024 to 2032
- Among raw material, the chloroprene rubber sub-segment generated noteworthy revenue in 2023
- Based on application, the infrastructure sub-segment generated 24% recycled elastomers recycled elastomers market share in 2023
- Rising preference for green building materials is a popular recycled elastomers market trend that fuels the industry demand

Elastomer materials are polymers with chemical linkages that provide remarkable elongation and flexibility, making them useful in a variety of sectors. These materials are made up of rubber compounds with five to 10 components, each with a specific function. Elastomers are regarded as superior alternatives to natural rubber due to their improved performance and adaptability. They are broadly classified into three types: diene elastomers, which include materials such as natural and synthetic rubber known for their elasticity and durability; non-diene elastomers, such as silicone rubber, which are valued for their heat and chemical resistance; and thermoplastic elastomers, which combine the properties of rubber and plastic, making molding and recycling simple. This accreditation confirms their suitability for a wide range of applications, including automotive and consumer items.
Global Recycled Elastomers Market Dynamics
Market Drivers
- Rising demand for sustainable materials in construction and infrastructure projects
- Growth of the automotive industry seeking eco-friendly solutions for tire recycling
- Increasing regulations promoting waste management and rubber recycling initiatives
- Expanding applications of recycled elastomers in sports surfaces and playgrounds
Market Restraints
- High initial investment required for advanced recycling technologies
- Limited awareness about recycled elastomers in emerging economies
- Quality and performance inconsistencies compared to virgin elastomers
Market Opportunities
- Development of innovative recycling techniques for improved material efficiency
- Growing adoption of recycled elastomers in the footwear and fashion industries
- Expansion of government subsidies and grants for rubber recycling startups
Recycled Elastomers Market Report Coverage
| Market | Recycled Elastomers Market |
| Recycled Elastomers Market Size 2022 |
USD 8.6 Billion |
| Recycled Elastomers Market Forecast 2032 | USD 22.5 Billion |
| Recycled Elastomers Market CAGR During 2023 - 2032 | 11.4% |
| Recycled Elastomers Market Analysis Period | 2020 - 2032 |
| Recycled Elastomers Market Base Year |
2023 |
| Recycled Elastomers Market Forecast Data | 2024 - 2032 |
| Segments Covered | By Raw Material, By Application, And By Geography |
| Regional Scope | North America, Europe, Asia Pacific, Latin America, and Middle East & Africa |
| Key Companies Profiled | Liberty Tire Recycling, Austin Rubber Company LLC, GRP Ltd., RubberForm Recycled Products LLC, Green Rubber Global, Klean Industries, Monmouth Rubber & Plastics Corp., J. Allcock & Sons Limited, Genan Holding, American Tire Recycling, and American Recycling Center. |
| Report Coverage |
Market Trends, Drivers, Restraints, Competitive Analysis, Player Profiling, Covid-19 Analysis, Regulation Analysis |
Recycled Elastomers Market Insights
Major factors expected to drive the growth of the global recycled elastomers are increasing R&D activities for development of eco-friendly polymer products, along with wide applicability of recycled elastomers in various end use industry. In addition, sustainable development activities in road construction, coupled with wide applicability of recycled elastomers as a binder in construction of road is another factor expected to support the growth of the global market.
However, high cost involved in processing of material is resulting in high cost of end product which is a major factor expected to hamper the growth of the global recycled elastomers market. In addition, fluctuating raw material prices is another factor expected to challenge the growth of the target market.
Increasing investment for technological advancements and R&D activities and development of cost-effective product are factors expected to create new opportunities in terms of revenue for players operating in the target market over the recycled elastomers market forecast period. In addition, increasing business expansion activities by major players through strategic merger and acquisitions in order to increase their global presence is expected to further support the growth of the market.
Recycled Elastomers Market Segmentation
The worldwide market for recycled elastomers is split based on raw material, application, and geography.
Recycled Elastomers Raw Material
- Nitrile Butadiene Rubber
- Styrene Butadiene Rubber
- Propylene Rubber
- Natural Rubber
- Chloroprene Rubber
- Polyurethane Rubber
- Others
According to recycled elastomers industry analysis, the raw material segment of the global market in segmented into styrene butadiene rubber, nitrile butadiene rubber, propylene rubber, chloroprene rubber, natural rubber, polyurethane rubber, and others. The chloroprene rubber segment is expected to contribute significant revenue share in the global market, due to its properties such as high resistance to sunlight and harmful gases. In addition, high resistance properties of chloroprene rubber is resulting in increasing demand from infrastructure industry for various application such as flooring mats and bathroom accessories.
Recycled Elastomers Application
- Agriculture
- Medical
- Sports Product
- Infrastructure
- Playground Surfaces
- Home & Garden
The application segment of the target market is segmented in to medical, agriculture, sports product, playground surfaces, infrastructure, home & garden, and others. Infrastructure segment expected to generate significant revenue also the agriculture segment is expected to contribute significant market share in the global industry, owing to its properties such as high resistant to heat, UV resistance, and high durability. In addition, growing demand for cost-effective packaging solution for vegetables, livestock mats, and feeders is expected to increase demand for recycled elastomers products.
Recycled Elastomers Market Regional Outlook
North America
- U.S.
- Canada
Europe
- U.K.
- Germany
- France
- Spain
- Rest of Europe
Asia-Pacific
- India
- Japan
- China
- Australia
- South Korea
- Rest of Asia-Pacific
Latin America
- Brazil
- Mexico
- Rest of Latin America
The Middle East & Africa
- South Africa
- GCC Countries
- Rest of the Middle East & Africa (ME&A)

Recycled Elastomers Market Regional Analysis
The market in Asia-Pacific is the largest recycled elastomers market and is expected to witness fastest growth, owing to increasing demand from construction sector. Increasing road infrastructure development activities in the developing countries, coupled with adoption of recycled elastomers in road construction due to its binding property is expected to support the target market growth in Asia-Pacific market. In addition, increasing use of elastomers in textile and tire manufacturing is expected to further support the growth of the target market.
Europe is expected to contribute major revenue share in the global recycled elastomers market. This can be attributed to increasing R&D activities pertaining to development of eco-friendly plastic products. In addition, flourishing sport industry, rising number of global sports events is resulting in demand for recycled elastomers products for athletics surfaces and other arenas is expected to support the growth of the target market in Europe.
Moreover, rapid technological advancements in medical devices, increasing government spending on healthcare sector, coupled with wide applicability of recycled elastomers in medical devices products is expected to support the target market.
Recycled Elastomers Market Players
Some of the top recycled elastomers companies offered in our report includes Liberty Tire Recycling, Austin Rubber Company LLC, GRP Ltd., RubberForm Recycled Products LLC, Green Rubber Global, Klean Industries, Monmouth Rubber & Plastics Corp., J. Allcock & Sons Limited, Genan Holding, American Tire Recycling, and American Recycling Center.
Frequently Asked Questions
How big is the recycled elastomers market?
The recycled elastomers market size was valued at USD 8.6 billion in 2023.
What is the CAGR of the global recycled elastomers market from 2024 to 2032?
The CAGR of recycled elastomers is 11.4% during the analysis period of 2024 to 2032.
Which are the key players in the recycled elastomers market?
The key players operating in the global market are including Liberty Tire Recycling, Austin Rubber Company LLC, GRP Ltd., RubberForm Recycled Products LLC, Green Rubber Global, Klean Industries, Monmouth Rubber & Plastics Corp., J. Allcock & Sons Limited, Genan Holding, American Tire Recycling, and American Recycling Center.
Which region dominated the global recycled elastomers market share?
Asia-Pacific held the dominating position in recycled elastomers industry during the analysis period of 2024 to 2032.
Which region registered fastest CAGR from 2024 to 2032?
Asia-Pacific region exhibited fastest growing CAGR for market of recycled elastomers during the analysis period of 2024 to 2032.
What are the current trends and dynamics in the global recycled elastomers industry?
The current trends and dynamics in the recycled elastomers industry include rising demand for sustainable materials in construction and infrastructure projects, and growth of the automotive industry seeking eco-friendly solutions for tire recycling.
Which application held the maximum share in 2023?
The infrastructure application held the maximum share of the recycled elastomers industry.


