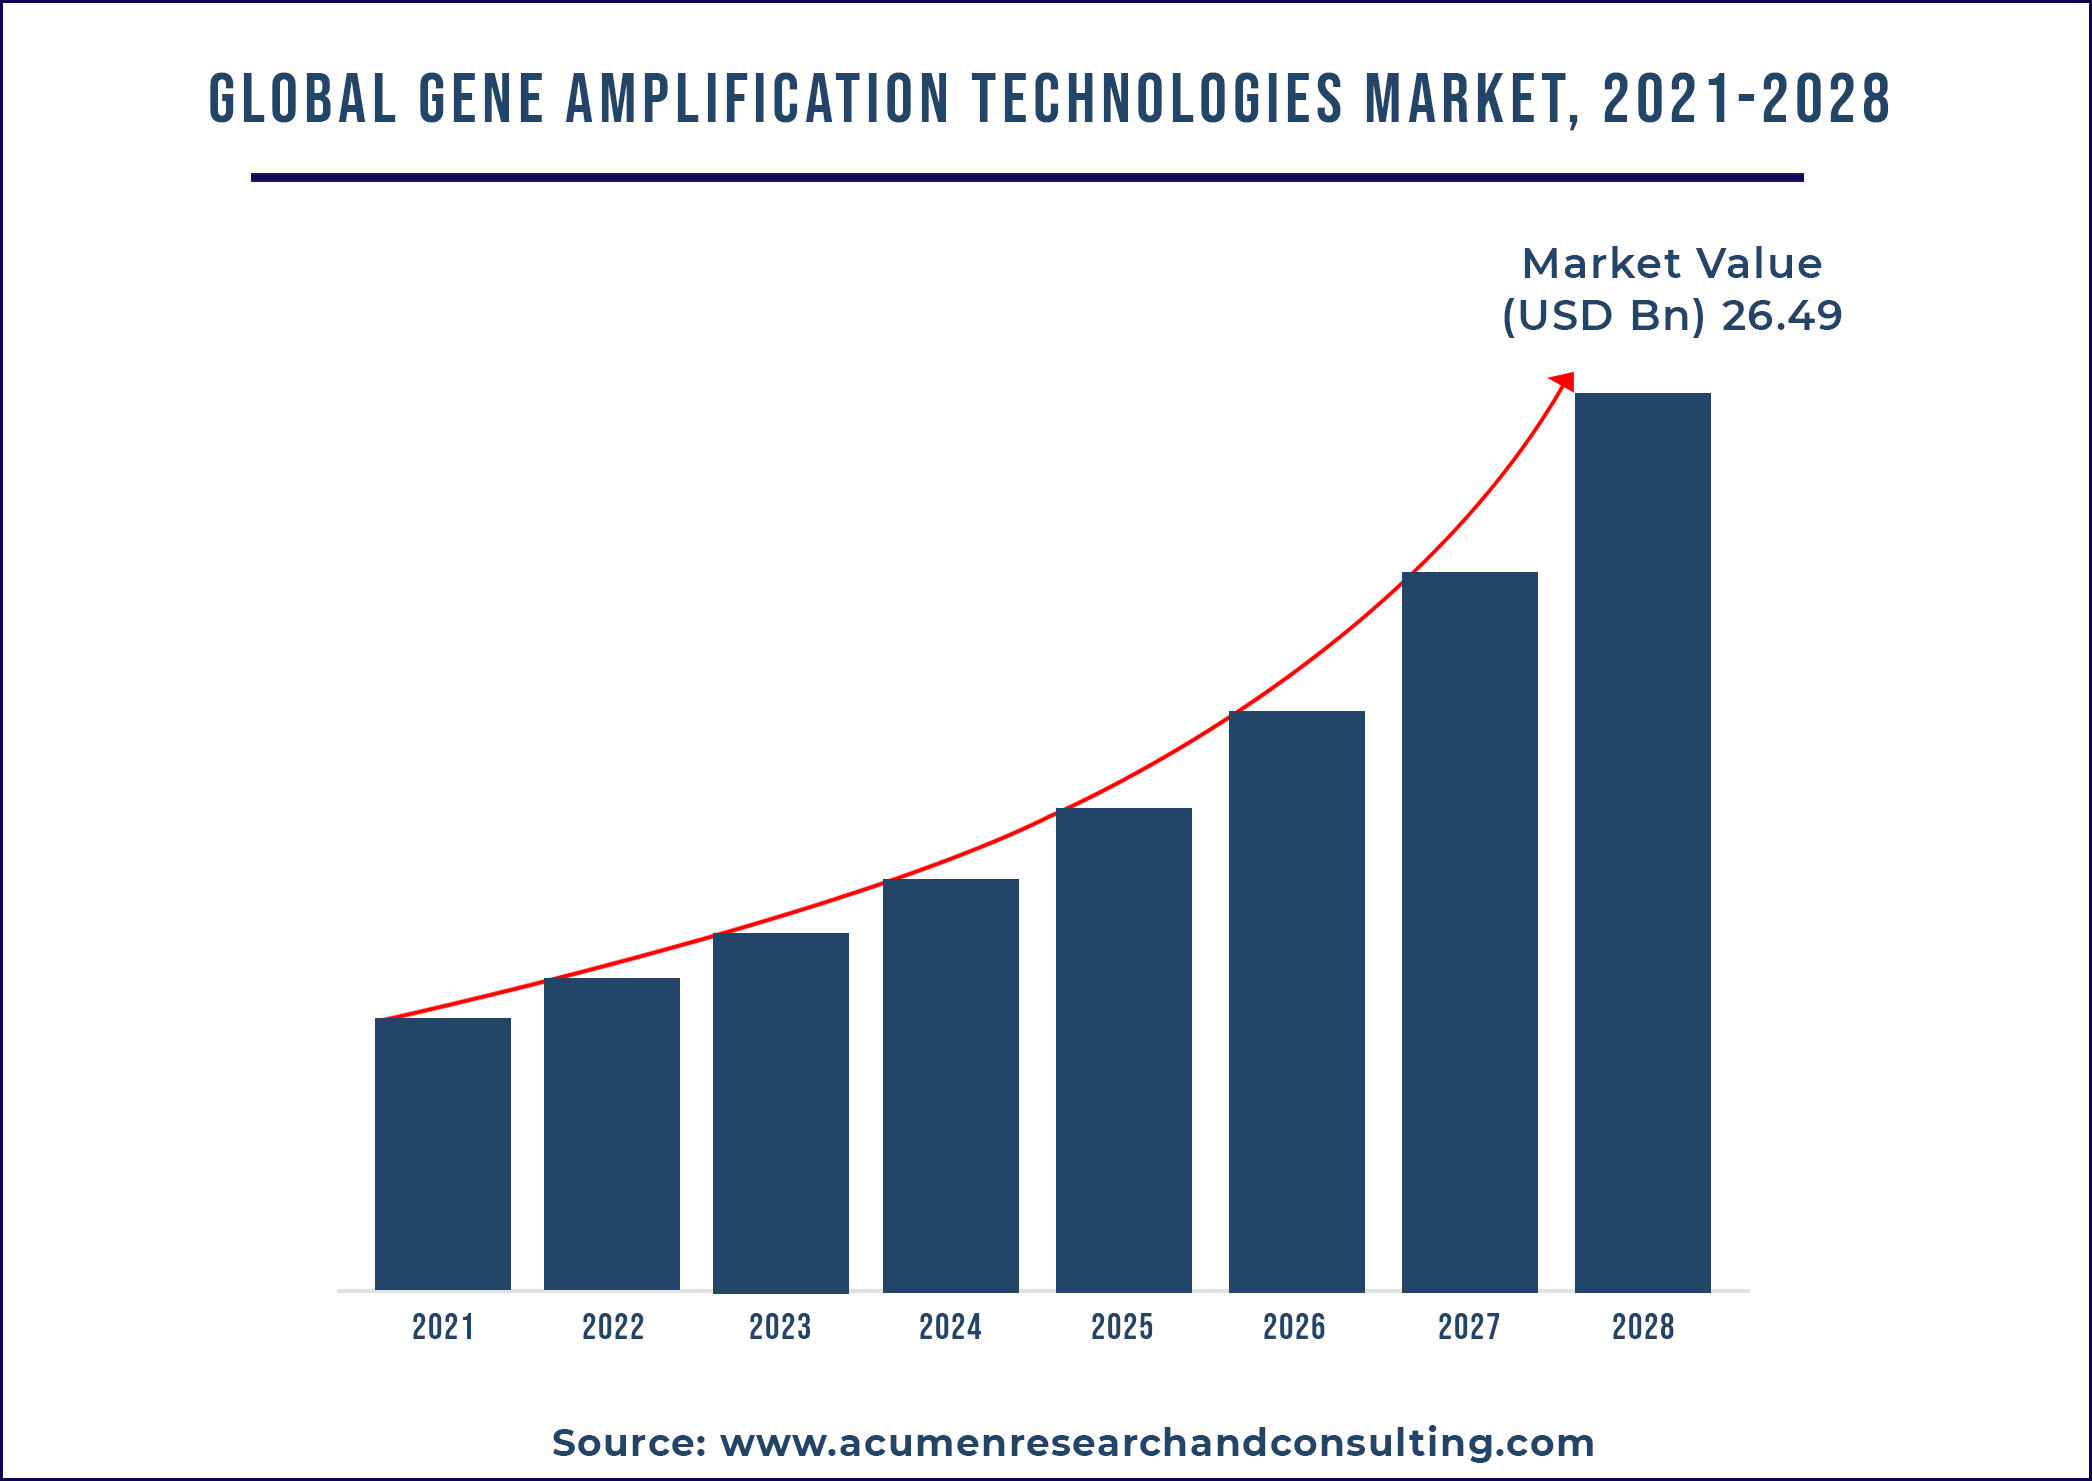
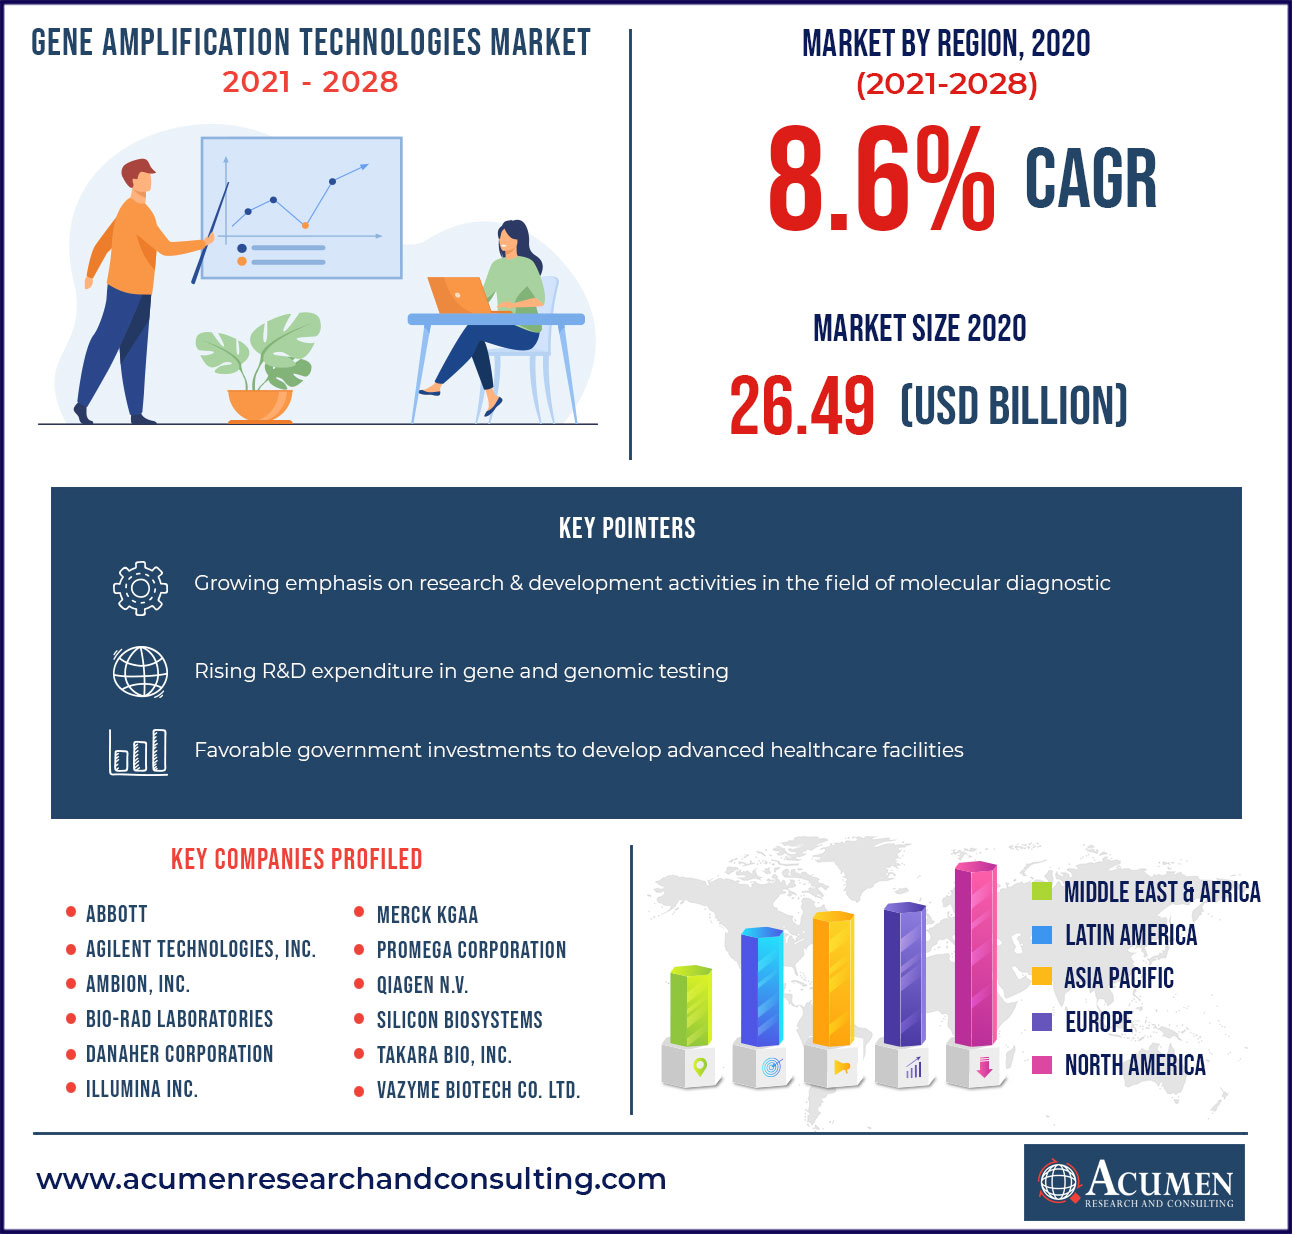
The global gene amplification technologies market accounted for US$ 26.49 Bn in 2020 with a considerable CAGR of 8.6% during the forecast period of 2021 to 2028.
According to the National Human Genome Research Institute, gene amplification is an increase in the number of copies of gene sequence without a proportional increase in other genes. This results from a duplication of a region of DNA that contains a gene through errors in DNA replication and repair machinery. Gene amplification can also be referred to as the polymerase chain reaction (PCR); a laboratory technique used to amplify gene sequences in a test tube, which is in tremendous demand owing to the COVID-19 pandemic. Gene amplification technology plays a crucial role during development when it is responsible for the programmed increase of gene expression.
Report coverage
Market |
Gene Amplification Technologies Market |
Analysis Period |
2017 - 2028 |
Base Year |
2020 |
Forecast Data |
2021 - 2028 |
Segments Covered |
By Technology, By Application, By Sample Type, By Product, By End-Use, and By Geography |
Regional Scope |
North America, Europe, Asia Pacific, Latin America, and Middle East & Africa |
Key Companies Profiled |
Abbott Laboratories, Agilent Technologies, Inc., Ambion, Inc., Bio-Rad Laboratories, Danaher Corporation, Illumina Inc., Merck KGaA, Promega Corporation, QIAGEN N.V., Silicon Biosystems, Takara Bio, Inc., Vazyme Biotech Co. Ltd., and others.
|
Report Coverage
|
Market Trends, Drivers, Restraints, Competitive Analysis, Player Profiling, Regulation Analysis |
Customization Scope |
10 hrs of free customization and expert consultation
|
Market Dynamics
The global gene amplification technologies market is primarily driven by the Human Genome Project (HGP). The Human Genome Project was a worldwide scientific research project to determine the base pairs that compose human DNA. It was the world’s largest collaborative biological project that started in 1990 and was declared completed in April 2003. However, Level "complete genome" was attained in May 2021.
In addition, growing emphasis on research & development activities in the field of molecular diagnostic, genetic & genomic testing, drug discovery, and environmental monitoring among others are also boosting the global gene amplification technologies market share. For instance, genomic testing is commonly used in cancer treatment to determine the behavior of the tumor. It further helps healthcare professionals to predict how progressive cancer will be and whether it is likely to spread to other body parts. According to the reports, Global Cancer Observatory (GLOBOCAN) and International Agency for Research on Cancer states that an estimated 19.3 million new cancer cases were diagnosed in 2020. Also, cancer is the leading cause of death the world. According to estimates from the World Health Organization (WHO) in 2019, cancer is the first or second cause of death before 70 years in most of the countries in the world.
However, the high costs of these technologies and limited awareness in emerging economies are the factors that might restraint the market from growing. Moreover, technological advancement in the field of advanced DNA multiplication technologies will contribute to profitable opportunities for the market in the coming years.
Increasing research & development activities in the field of molecular diagnostics fuels the gene amplification technologies market growth
The molecular diagnostics industry has been playing a vital role in the screening, detection, and monitoring of numerous life-threatening diseases. This industry is quickly evolving and has established itself as a significant part of the healthcare industry. Clinicians have benefited from molecular diagnostic tools such as polymerase chain reaction (PCR), sequencing, and hybridization, as well as microarray, by providing rapid and sensitive approaches for the screening, detection, and monitoring of a wide range of genetic disorders, cancers, infectious, and chronic diseases
Impact of the Covid-19 Pandemic on Gene Amplification Technology Industry
The pandemic has increased the pressure on the sector to handle the issues it faces. The COVID-19 pandemic has tested the healthcare ecosystem of even the most developed economies. With the addition of the quick antigen detection test to the molecular tests, which remain the basis of diagnosis, the testing rate has increased dramatically in recent months. The government's increased focus on testing has expedited the need, demand, and responsibility of the world's diagnostic business, particularly the molecular diagnostic sector, which has proven to be the backbone, supporting containment efforts to minimize the outbreak.
Market Segmentation
The global gene amplification technologies market is segmented based on technology, product, sample type, application, end-use, and region. Based on the technology segment, the market classifies as PCR-based amplification, multiple displacement amplification, nucleic acid sequence-based amplification, loop-mediated isothermal amplification, strand displacement amplification, rolling circle amplification, ramification amplification, and others.
Based on product, the segmentation bifurcates into instruments, kits & reagents, and services. The sample type segment is further categorized into a single cell, FFPE, and others. The application segment is further sub-segmented into whole genome amplification, exome sequencing, SNP genotyping arrays, array CGH, hybridization, and other applications. Furthermore, pharmaceutical & biotechnology companies, academic & research institutes, and others.
Regional Overview
North America region is expected to lead global gene amplification technologies market during the projected period of 2021 to 2028
Among all the regions, North America generated the highest revenues in 2020, accounting for a significant market share in the global market. This is attributed to the presence of several advanced healthcare facilities, tremendous growth in genetic testing, and ongoing research programs in the region. For instance, in Sept 2021 - GeneDx, Inc. a US-based genomic analysis leader announced the completion of clinical genetic exome sequencing for more than 300000 patients, making the company’s dataset the largest of its kind in the world. Besides, growing funding by numerous government organizations in medical research and its infrastructure is also likely to boost the North American gene amplification technologies market growth.
Europe has also exhibited significant growth in the global market, owing to the growing focus on innovations through R&D, and the presence of advanced healthcare facilities in countries such as Germany, the UK, and others. Meanwhile, the Asia-Pacific region is likely to register the fastest CAGR throughout the forecast period on account of the increasing prevalence of various diseases that lets the growing need in genomic research. Moreover, favorable government initiatives to develop advanced healthcare facilities in countries such as China and India are also expected to propel the demand for the APAC gene amplification technologies market.
Competitive Landscape
This section of the report pinpoints various key vendors of the market. Some of the key players offered in the report include Abbott Laboratories, Agilent Technologies, Inc., Ambion, Inc., Bio-Rad Laboratories, Danaher Corporation, Illumina Inc., Merck KGaA, Promega Corporation, QIAGEN N.V., Silicon Biosystems, Takara Bio, Inc., Vazyme Biotech Co. Ltd., and others.
Market Segmentation
Market By Technology
- PCR-based Amplification
- Multiple Displacement Amplification
- Nucleic Acid Sequence Based Amplification
- Loop-mediated Isothermal Amplification
- Strand Displacement Amplification
- Rolling Circle Amplification
- Ramification Amplification
- Others
Market By Application
- Whole Genome Amplification
- Exome Sequencing
- SNP Genotyping Arrays
- Array CGH
- Hybridization
- Others
Market By Sample Type
Market By Product
- Instruments
- Kits & Reagents
- Services
Market By End-Use
- Pharmaceutical & Biotechnology Companies
- Academic & Research Institutes
- Others
Market By Geography
- North America
- Europe
- U.K.
- Germany
- France
- Spain
- Rest of Europe
- Asia-Pacific
- China
- Japan
- India
- Australia
- South Korea
- Rest of Asia-Pacific
- Latin America
- Brazil
- Mexico
- Rest of Latin America
- Middle East & Africa
- GCC
- South Africa
- Rest of Middle East & Africa
CHAPTER 1. Industry Overview of Gene Amplification Technologies
1.1. Definition and Scope
1.1.1. Definition of Gene Amplification Technologies
1.1.2. Market Segmentation
1.1.3. Years Considered for the Study
1.1.4. Assumptions and Acronyms Used
1.1.4.1. Market Assumptions and Market Forecast
1.1.4.2. Acronyms Used in Global Gene Amplification Technologies market
1.2. Summary
1.2.1. Executive Summary
1.2.2. Gene Amplification Technologies By Technology
1.2.3. Gene Amplification Technologies By Application
1.2.4. Gene Amplification Technologies By Product
1.2.5. Gene Amplification Technologies By Sample Type
1.2.6. Gene Amplification Technologies By End-User
1.2.7. Gene Amplification Technologies by Regions
CHAPTER 2. Research Approach
2.1. Methodology
2.1.1. Research Programs
2.1.2. Market Size Estimation
2.1.3. Market Breakdown and Data Triangulation
2.2. Data Source
2.2.1. Secondary Sources
2.2.2. Primary Sources
CHAPTER 3. Market Dynamics And Competition Analysis
3.1. Market Drivers
3.1.1. Driver 1
3.1.2. Driver 2
3.2. Restraints and Challenges
3.2.1. Restrain 1
3.2.2. Restrain 2
3.3. Growth Opportunities
3.3.1. Opportunity 1
3.3.2. Opportunity 2
3.4. Porter’s Five Forces Analysis
3.4.1. Bargaining Power of Suppliers
3.4.2. Bargaining Power of Buyers
3.4.3. Threat of Substitute
3.4.4. Threat of New Entrants
3.4.5. Degree of Competition
3.5. Market Concentration Ratio and Market Maturity Analysis of Gene Amplification Technologies Market
3.5.1. Go To Market Strategy
3.5.1.1. Introduction
3.5.1.2. Growth
3.5.1.3. Maturity
3.5.1.4. Saturation
3.5.1.5. Possible Development
3.6. Technological Roadmap for Gene Amplification Technologies Market
3.7. Value Chain Analysis
3.7.1. List of Key Manufacturers
3.7.2. List of Customers
3.7.3. Level of Integration
3.8. Cost Structure Analysis
3.8.1. Price Trend of Key Raw Materials
3.8.2. Raw Material Suppliers
3.8.3. Proportion of Manufacturing Cost Structure
3.8.3.1. Raw Material
3.8.3.2. Labor Cost
3.8.3.3. Manufacturing Expense
3.9. Regulatory Compliance
3.10. Competitive Landscape, 2019
3.10.1. Player Positioning Analysis
3.10.2. Key Strategies Adopted By Leading Players
CHAPTER 4. Manufacturing Plant Analysis
4.1. Manufacturing Plant Location and Establish Date of Major Manufacturers in 2019
4.2. R&D Status and Application Source of Gene Amplification Technologies Major Manufacturers in 2019
CHAPTER 5. Gene Amplification Technologies By Technology
5.1. Introduction
5.2. Gene Amplification Technologies Revenue By Technology
5.2.1. Gene Amplification Technologies Revenue (US$ Bn) and Forecast, By Technology, 2017-2028
5.2.2. PCR-based Amplification
5.2.2.1. PCR-based Amplification Market Revenue (US$ Bn) and Growth Rate (%), 2017-2028
5.2.3. Nucleic Acid Sequence Based Amplification
5.2.3.1. Nucleic Acid Sequence Based Amplification Market Revenue (US$ Bn) and Growth Rate (%), 2017-2028
5.2.4. Multiple Displacement Amplification
5.2.4.1. Multiple Displacement Amplification Market Revenue (US$ Bn) and Growth Rate (%), 2017-2028
5.2.5. Loop-mediated Isothermal Amplification
5.2.5.1. Loop-mediated Isothermal Amplification Market Revenue (US$ Bn) and Growth Rate (%), 2017-2028
5.2.6. Strand Displacement Amplification
5.2.6.1. Strand Displacement Amplification Market Revenue (US$ Bn) and Growth Rate (%), 2017-2028
5.2.7. Rolling Circle Amplification
5.2.7.1. Rolling Circle Amplification Market Revenue (US$ Bn) and Growth Rate (%), 2017-2028
5.2.8. Ramification Amplification
5.2.8.1. Ramification Amplification Market Revenue (US$ Bn) and Growth Rate (%), 2017-2028
5.2.9. Others
5.2.9.1. Others Market Revenue (US$ Bn) and Growth Rate (%), 2017-2028
CHAPTER 6. Gene Amplification Technologies Market Revenue By Application
6.1. Introduction
6.2. Gene Amplification Technologies Revenue (US$ Bn) By Application
6.2.1. Gene Amplification Technologies Revenue (US$ Bn) and Forecast By Application, 2017-2028
6.2.2. Whole Genome Amplification
6.2.2.1. Whole Genome Amplification Market Revenue (US$ Bn) and Growth Rate (%), 2017-2028
6.2.3. Exome Sequencing
6.2.3.1. Exome Sequencing Market Revenue (US$ Bn) and Growth Rate (%), 2017-2028
6.2.4. SNP Genotyping Arrays
6.2.4.1. SNP Genotyping Arrays Market Revenue (US$ Bn) and Growth Rate (%), 2017-2028
6.2.5. Array CGH
6.2.5.1. Array CGH Market Revenue (US$ Bn) and Growth Rate (%), 2017-2028
6.2.6. Hybridization
6.2.6.1. Hybridization Market Revenue (US$ Bn) and Growth Rate (%), 2017-2028
6.2.7. Others
6.2.7.1. Others Market Revenue (US$ Bn) and Growth Rate (%), 2017-2028
CHAPTER 7. Gene Amplification Technologies Market By Sample Type
7.1. Introduction
7.2. Gene Amplification Technologies Revenue (US$ Bn) By Product
7.2.1. Gene Amplification Technologies Revenue (US$ Bn) and Forecast By Product, 2017-2028
7.2.2. Single Cell
7.2.2.1. Single Cell Market Revenue (US$ Bn) and Growth Rate (%), 2017-2028
7.2.3. FFPE
7.2.3.1. FFPE Market Revenue (US$ Bn) and Growth Rate (%), 2017-2028
7.2.4. Others
7.2.4.1. Others Market Revenue (US$ Bn) and Growth Rate (%), 2017-2028
CHAPTER 8. Gene Amplification Technologies Market By Product
8.1. Introduction
8.2. Gene Amplification Technologies Revenue (US$ Bn) By Product
8.2.1. Gene Amplification Technologies Revenue (US$ Bn) and Forecast By Product, 2017-2028
8.2.2. Instruments
8.2.2.1. Instruments Market Revenue (US$ Bn) and Growth Rate (%), 2017-2028
8.2.3. Kits & Reagents
8.2.3.1. Kits & Reagents Market Revenue (US$ Bn) and Growth Rate (%), 2017-2028
8.2.4. Others
8.2.4.1. Others Market Revenue (US$ Bn) and Growth Rate (%), 2017-2028
CHAPTER 9. Gene Amplification Technologies Market By End-User
9.1. Introduction
9.2. Gene Amplification Technologies Revenue (US$ Bn) By Product
9.2.1. Gene Amplification Technologies Revenue (US$ Bn) and Forecast By Product, 2017-2028
9.2.2. Pharmaceuticals & Biotechnology Companies
9.2.2.1. Pharmaceuticals & Biotechnology Companies Market Revenue (US$ Bn) and Growth Rate (%), 2017-2028
9.2.3. Academic & Research Institutes
9.2.3.1. Academic & Research Institutes Market Revenue (US$ Bn) and Growth Rate (%), 2017-2028
9.2.4. Others
9.2.4.1. Others Market Revenue (US$ Bn) and Growth Rate (%), 2017-2028
CHAPTER 10. North America Gene Amplification Technologies Market By Country
10.1. North America Gene Amplification Technologies Overview
10.2. U.S.
10.2.1. U.S. Gene Amplification Technologies Revenue (US$ Bn) and Forecast By Technology, 2017-2028
10.2.2. U.S. Gene Amplification Technologies Revenue (US$ Bn) and Forecast By Application, 2017-2028
10.2.3. U.S. Gene Amplification Technologies Revenue (US$ Bn) and Forecast By Sample Type, 2017-2028
10.2.4. U.S. Gene Amplification Technologies Revenue (US$ Bn) and Forecast By Product, 2017-2028
10.2.5. U.S. Gene Amplification Technologies Revenue (US$ Bn) and Forecast By End-User, 2017-2028
10.3. Canada
10.3.1. Canada Gene Amplification Technologies Revenue (US$ Bn) and Forecast By Technology, 2017-2028
10.3.2. Canada Gene Amplification Technologies Revenue (US$ Bn) and Forecast By Application, 2017-2028
10.3.3. Canada Gene Amplification Technologies Revenue (US$ Bn) and Forecast By Sample Type, 2017-2028
10.3.4. Canada Gene Amplification Technologies Revenue (US$ Bn) and Forecast By Product, 2017-2028
10.3.5. Canada Gene Amplification Technologies Revenue (US$ Bn) and Forecast By End-User, 2017-2028
10.4. North America PEST Analysis
CHAPTER 11. Europe Gene Amplification Technologies Market By Country
11.1. Europe Gene Amplification Technologies Overview
11.2. U.K.
11.2.1. U.K. Gene Amplification Technologies Revenue (US$ Bn) and Forecast By Technology, 2017-2028
11.2.2. U.K. Gene Amplification Technologies Revenue (US$ Bn) and Forecast By Application, 2017-2028
11.2.3. U.K. Gene Amplification Technologies Revenue (US$ Bn) and Forecast By Sample Type, 2017-2028
11.2.4. U.K. Gene Amplification Technologies Revenue (US$ Bn) and Forecast By Product, 2017-2028
11.2.5. U.K. Gene Amplification Technologies Revenue (US$ Bn) and Forecast By End-User, 2017-2028
11.3. Germany
11.3.1. Germany Gene Amplification Technologies Revenue (US$ Bn) and Forecast By Technology, 2017-2028
11.3.2. Germany Gene Amplification Technologies Revenue (US$ Bn) and Forecast By Application, 2017-2028
11.3.3. Germany Gene Amplification Technologies Revenue (US$ Bn) and Forecast By Sample Type, 2017-2028
11.3.4. Germany Gene Amplification Technologies Revenue (US$ Bn) and Forecast By Product, 2017-2028
11.3.5. Germany Gene Amplification Technologies Revenue (US$ Bn) and Forecast By End-User, 2017-2028
11.4. France
11.4.1. France Gene Amplification Technologies Revenue (US$ Bn) and Forecast By Technology, 2017-2028
11.4.2. France Gene Amplification Technologies Revenue (US$ Bn) and Forecast By Application, 2017-2028
11.4.3. France Gene Amplification Technologies Revenue (US$ Bn) and Forecast By Sample Type, 2017-2028
11.4.4. France Gene Amplification Technologies Revenue (US$ Bn) and Forecast By Product, 2017-2028
11.4.5. France Gene Amplification Technologies Revenue (US$ Bn) and Forecast By End-User, 2017-2028
11.5. Spain
11.5.1. Spain Gene Amplification Technologies Revenue (US$ Bn) and Forecast By Technology, 2017-2028
11.5.2. Spain Gene Amplification Technologies Revenue (US$ Bn) and Forecast By Application, 2017-2028
11.5.3. Spain Gene Amplification Technologies Revenue (US$ Bn) and Forecast By Sample Type, 2017-2028
11.5.4. Spain Gene Amplification Technologies Revenue (US$ Bn) and Forecast By Product, 2017-2028
11.5.5. Spain Gene Amplification Technologies Revenue (US$ Bn) and Forecast By End-User, 2017-2028
11.6. Rest of Europe
11.6.1. Rest of Europe Gene Amplification Technologies Revenue (US$ Bn) and Forecast By Technology, 2017-2028
11.6.2. Rest of Europe Gene Amplification Technologies Revenue (US$ Bn) and Forecast By Application, 2017-2028
11.6.3. Rest of Europe Gene Amplification Technologies Revenue (US$ Bn) and Forecast By Sample Type, 2017-2028
11.6.4. Rest of Europe Gene Amplification Technologies Revenue (US$ Bn) and Forecast By Product, 2017-2028
11.6.5. Rest of Europe Gene Amplification Technologies Revenue (US$ Bn) and Forecast By End-User, 2017-2028
11.7. Europe PEST Analysis
CHAPTER 12. Asia Pacific Gene Amplification Technologies Market By Country
12.1. Asia Pacific Gene Amplification Technologies Overview
12.2. China
12.2.1. China Gene Amplification Technologies Revenue (US$ Bn) and Forecast By Technology, 2017-2028
12.2.2. China Gene Amplification Technologies Revenue (US$ Bn) and Forecast By Application, 2017-2028
12.2.3. China Gene Amplification Technologies Revenue (US$ Bn) and Forecast By Sample Type, 2017-2028
12.2.4. China Gene Amplification Technologies Revenue (US$ Bn) and Forecast By Product, 2017-2028
12.2.5. China Gene Amplification Technologies Revenue (US$ Bn) and Forecast By End-User, 2017-2028
12.3. Japan
12.3.1. Japan Gene Amplification Technologies Revenue (US$ Bn) and Forecast By Technology, 2017-2028
12.3.2. Japan Gene Amplification Technologies Revenue (US$ Bn) and Forecast By Application, 2017-2028
12.3.3. Japan Gene Amplification Technologies Revenue (US$ Bn) and Forecast By Sample Type, 2017-2028
12.3.4. Japan Gene Amplification Technologies Revenue (US$ Bn) and Forecast By Product, 2017-2028
12.3.5. Japan Gene Amplification Technologies Revenue (US$ Bn) and Forecast By End-User, 2017-2028
12.4. India
12.4.1. India Gene Amplification Technologies Revenue (US$ Bn) and Forecast By Technology, 2017-2028
12.4.2. India Gene Amplification Technologies Revenue (US$ Bn) and Forecast By Application, 2017-2028
12.4.3. India Gene Amplification Technologies Revenue (US$ Bn) and Forecast By Sample Type, 2017-2028
12.4.4. India Gene Amplification Technologies Revenue (US$ Bn) and Forecast By Product, 2017-2028
12.4.5. India Gene Amplification Technologies Revenue (US$ Bn) and Forecast By End-User, 2017-2028
12.5. Australia
12.5.1. Australia Gene Amplification Technologies Revenue (US$ Bn) and Forecast By Technology, 2017-2028
12.5.2. Australia Gene Amplification Technologies Revenue (US$ Bn) and Forecast By Application, 2017-2028
12.5.3. Australia Gene Amplification Technologies Revenue (US$ Bn) and Forecast By Sample Type, 2017-2028
12.5.4. Australia Gene Amplification Technologies Revenue (US$ Bn) and Forecast By Product, 2017-2028
12.5.5. Australia Gene Amplification Technologies Revenue (US$ Bn) and Forecast By End-User, 2017-2028
12.6. South Korea
12.6.1. South Korea Gene Amplification Technologies Revenue (US$ Bn) and Forecast By Technology, 2017-2028
12.6.2. South Korea Gene Amplification Technologies Revenue (US$ Bn) and Forecast By Application, 2017-2028
12.6.3. South Korea Gene Amplification Technologies Revenue (US$ Bn) and Forecast By Sample Type, 2017-2028
12.6.4. South Korea Gene Amplification Technologies Revenue (US$ Bn) and Forecast By Product, 2017-2028
12.6.5. South Korea Gene Amplification Technologies Revenue (US$ Bn) and Forecast By End-User, 2017-2028
12.7. Rest of Asia-Pacific
12.7.1. Rest of Asia-Pacific Gene Amplification Technologies Revenue (US$ Bn) and Forecast By Technology, 2017-2028
12.7.2. Rest of Asia-Pacific Gene Amplification Technologies Revenue (US$ Bn) and Forecast By Application, 2017-2028
12.7.3. Rest of Asia-Pacific Gene Amplification Technologies Revenue (US$ Bn) and Forecast By Sample Type, 2017-2028
12.7.4. Rest of Asia-Pacific Gene Amplification Technologies Revenue (US$ Bn) and Forecast By Product, 2017-2028
12.7.5. Rest of Asia-Pacific Gene Amplification Technologies Revenue (US$ Bn) and Forecast By End-User, 2017-2028
12.8. Asia Pacific PEST Analysis
CHAPTER 13. Latin America Gene Amplification Technologies Market By Country
13.1. Latin America Gene Amplification Technologies Overview
13.2. Brazil
13.2.1. Brazil Gene Amplification Technologies Revenue (US$ Bn) and Forecast By Technology, 2017-2028
13.2.2. Brazil Gene Amplification Technologies Revenue (US$ Bn) and Forecast By Application, 2017-2028
13.2.3. Brazil Gene Amplification Technologies Revenue (US$ Bn) and Forecast By Sample Type, 2017-2028
13.2.4. Brazil Gene Amplification Technologies Revenue (US$ Bn) and Forecast By Product, 2017-2028
13.2.5. Brazil Gene Amplification Technologies Revenue (US$ Bn) and Forecast By End-User, 2017-202
13.3. Mexico
13.3.1. Mexico Gene Amplification Technologies Revenue (US$ Bn) and Forecast By Technology, 2017-2028
13.3.2. Mexico Gene Amplification Technologies Revenue (US$ Bn) and Forecast By Application, 2017-2028
13.3.3. Mexico Gene Amplification Technologies Revenue (US$ Bn) and Forecast By Sample Type, 2017-2028
13.3.4. Mexico Gene Amplification Technologies Revenue (US$ Bn) and Forecast By Product, 2017-2028
13.3.5. Mexico Gene Amplification Technologies Revenue (US$ Bn) and Forecast By End-User, 2017-2028
13.4. Rest of Latin America
13.4.1. Rest of Latin America Gene Amplification Technologies Revenue (US$ Bn) and Forecast By Technology, 2017-2028
13.4.2. Rest of Latin America Gene Amplification Technologies Revenue (US$ Bn) and Forecast By Application, 2017-2028
13.4.3. Rest of Latin America Gene Amplification Technologies Revenue (US$ Bn) and Forecast By Sample Type, 2017-2028
13.4.4. Rest of Latin America Gene Amplification Technologies Revenue (US$ Bn) and Forecast By Product, 2017-2028
13.4.5. Rest of Latin America Gene Amplification Technologies Revenue (US$ Bn) and Forecast By End-User, 2017-2028
13.5. Latin America PEST Analysis
CHAPTER 14. Middle East & Africa Gene Amplification Technologies Market By Country
14.1. Middle East & Africa Gene Amplification Technologies Overview
14.2. GCC
14.2.1. GCC Gene Amplification Technologies Revenue (US$ Bn) and Forecast By Technology, 2017-2028
14.2.2. GCC Gene Amplification Technologies Revenue (US$ Bn) and Forecast By Application, 2017-2028
14.2.3. GCC Gene Amplification Technologies Revenue (US$ Bn) and Forecast By Sample Type, 2017-2028
14.2.4. GCC Gene Amplification Technologies Revenue (US$ Bn) and Forecast By Product, 2017-2028
14.2.5. GCC Gene Amplification Technologies Revenue (US$ Bn) and Forecast By GCC, 2017-2028
14.3. South Africa
14.3.1. South Africa Gene Amplification Technologies Revenue (US$ Bn) and Forecast By Technology, 2017-2028
14.3.2. South Africa Gene Amplification Technologies Revenue (US$ Bn) and Forecast By Application, 2017-2028
14.3.3. South Africa Gene Amplification Technologies Revenue (US$ Bn) and Forecast By Sample Type, 2017-2028
14.3.4. South Africa Gene Amplification Technologies Revenue (US$ Bn) and Forecast By Product, 2017-2028
14.3.5. South Africa Gene Amplification Technologies Revenue (US$ Bn) and Forecast By South Africa, 2017-2028
14.4. Rest of Middle East & Africa
14.4.1. Rest of Middle East & Africa Gene Amplification Technologies Revenue (US$ Bn) and Forecast By Technology, 2017-2028
14.4.2. Rest of Middle East & Africa Gene Amplification Technologies Revenue (US$ Bn) and Forecast By Application, 2017-2028
14.4.3. Rest of Middle East & Africa Gene Amplification Technologies Revenue (US$ Bn) and Forecast By Sample Type, 2017-2028
14.4.4. Rest of Middle East & Africa Gene Amplification Technologies Revenue (US$ Bn) and Forecast By Product, 2017-2028
14.4.5. Rest of Middle East & Africa Gene Amplification Technologies Revenue (US$ Bn) and Forecast By End-User, 2017-2028
14.5. Middle East & Africa PEST Analysis
CHAPTER 15. Player Analysis Of Gene Amplification Technologies
15.1. Gene Amplification Technologies Company Share Analysis
15.2. Competition Matrix
15.2.1. Competitive Benchmarking of key players by price, presence, market share, and R&D investment
15.2.2. New Product Launches and Product Enhancements
15.2.3. Mergers And Acquisition In Global Gene Amplification Technologies market
15.2.4. Partnership, Joint Ventures and Strategic Alliances/ Sales Agreements
CHAPTER 16. COMPANY PROFILE
16.1. Abbott Laboratories
16.1.1. Company Snapshot
16.1.2. Business Overview
16.1.3. Financial Overview
16.1.3.1. Revenue (US$ Bn), 2020
16.1.3.2. Abbott Laboratories 2020 Gene Amplification Technologies Business Regional Distribution
16.1.4. Product/ Service and Specification
16.1.5. Recent Developments & Business Strategy
16.1.6. Manufacturing Plant Footprint Analysis
16.2. Ambion, Inc.
16.3. Bio-Rad Laboratories
16.4. Agilent Technologies, Inc.
16.5. Danaher Corporation
16.6. Illumina Inc.
16.7. Merck KGaA
16.8. Promega Corporation
16.9. QIAGEN N.V.
16.10. Silicon Biosystems
16.11. Takara Bio, Inc.
16.12. Vazyme Biotech Co. Ltd.