DNA and Gene Chip Market Size - Global Industry, Share, Analysis, Trends and Forecast 2024 - 2032
Published :
Report ID:
Pages :
Format :
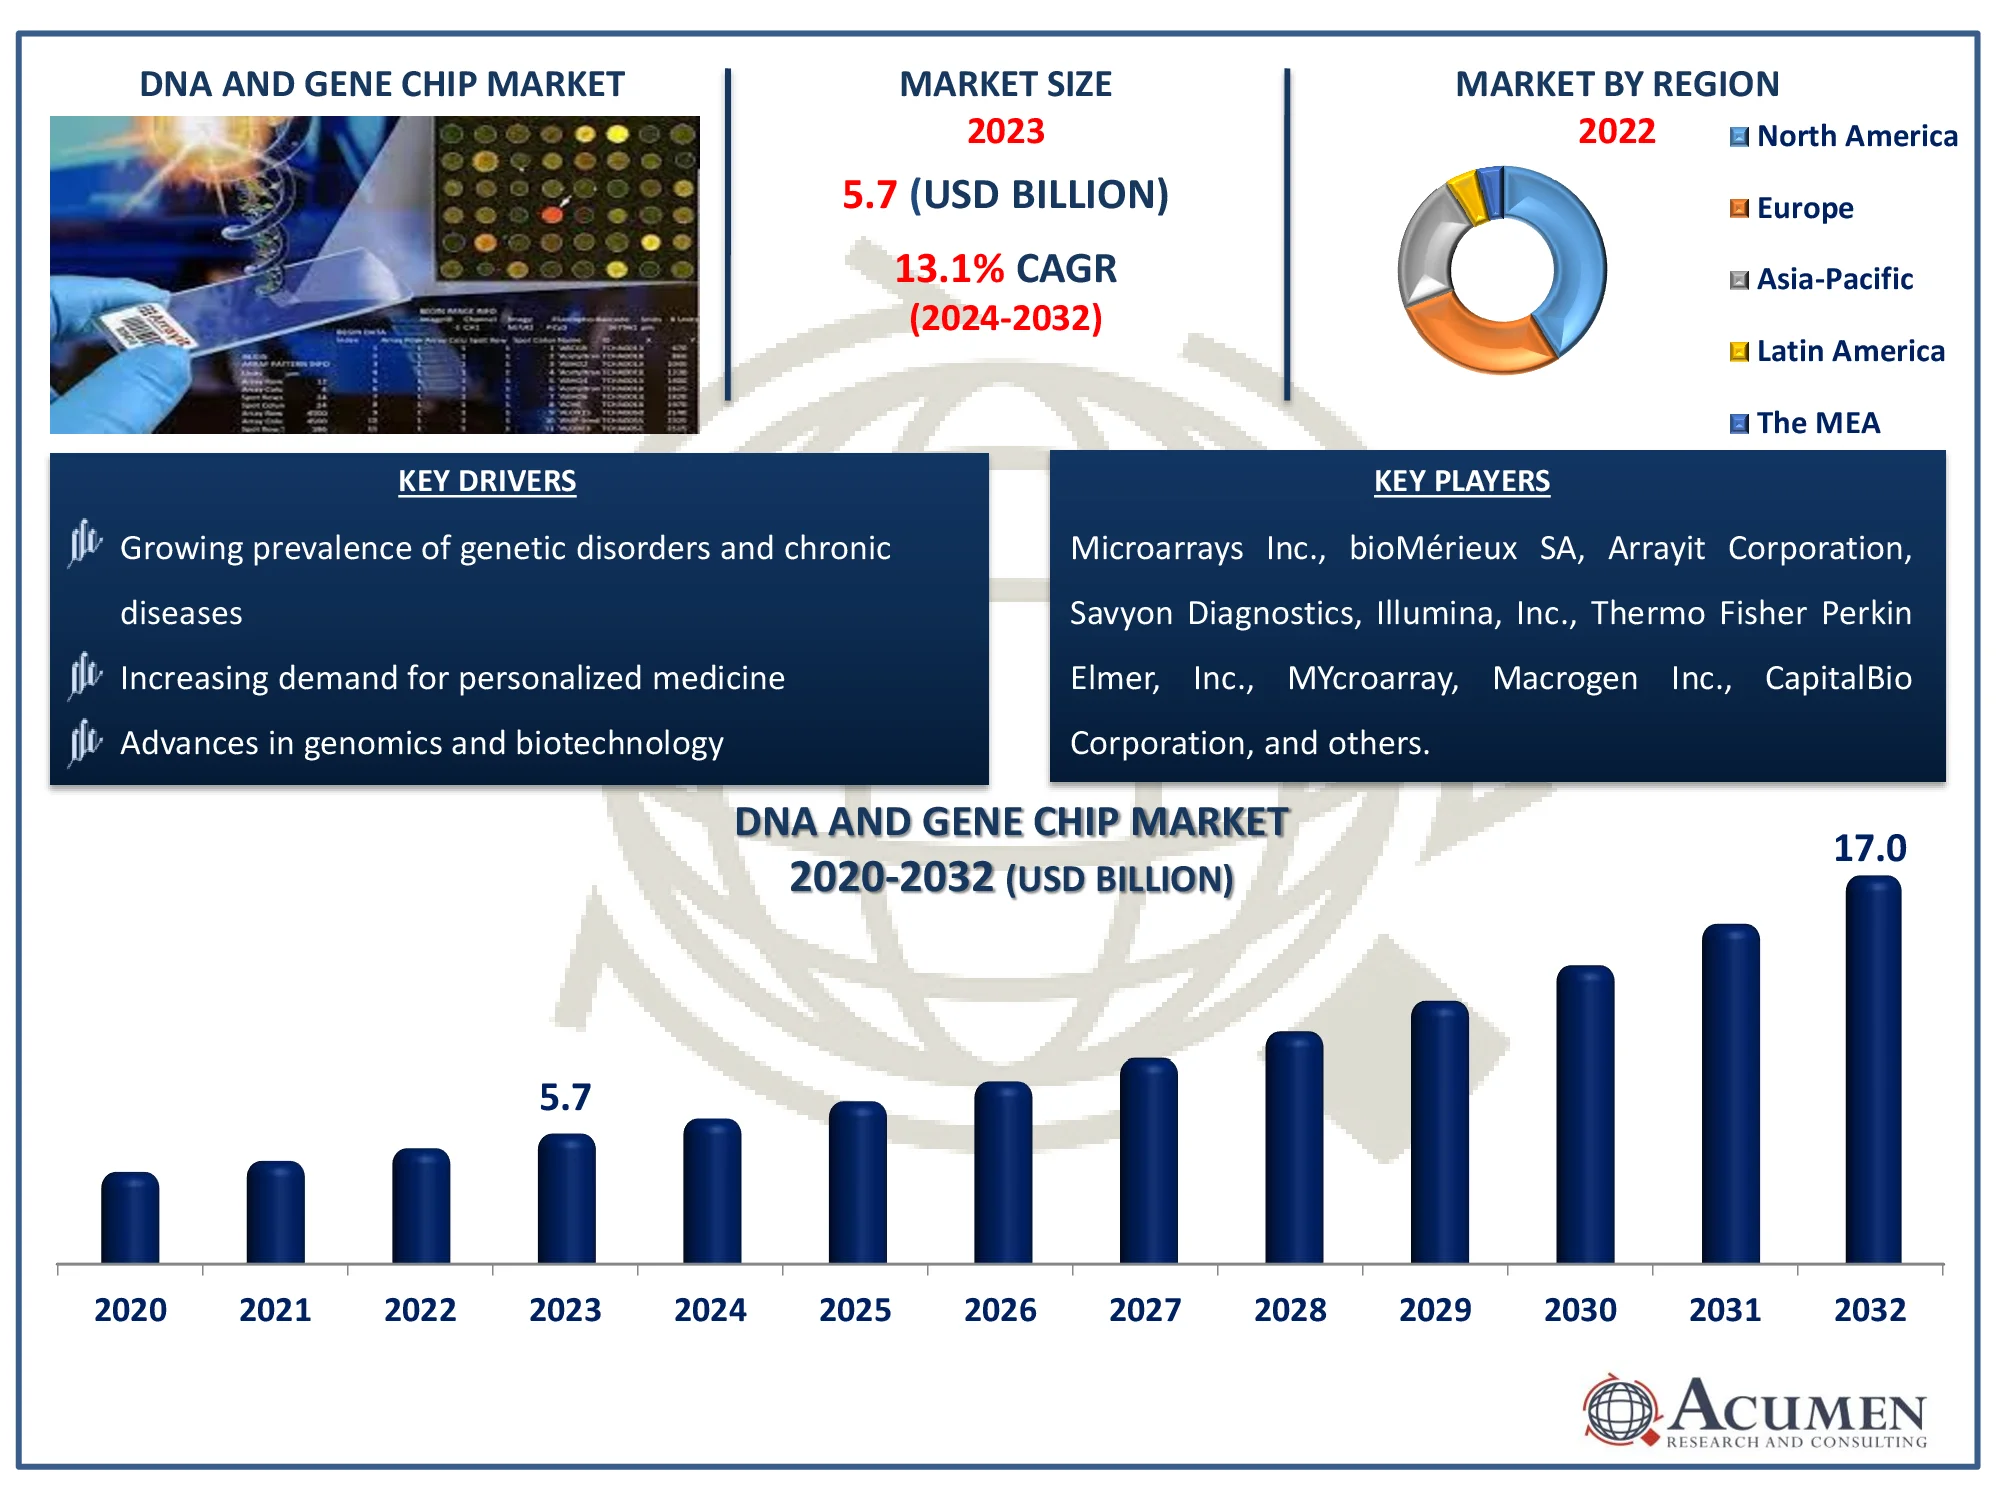
The Global DNA and Gene Chip Market Size accounted for USD 5.7 Billion in 2023 and is estimated to achieve a market size of USD 17.0 Billion by 2032 growing at a CAGR of 13.1% from 2024 to 2032.
DNA and Gene Chip Market Highlights
- Global DNA and gene chip market revenue is poised to garner USD 17.0 billion by 2032 with a CAGR of 13.1% from 2024 to 2032
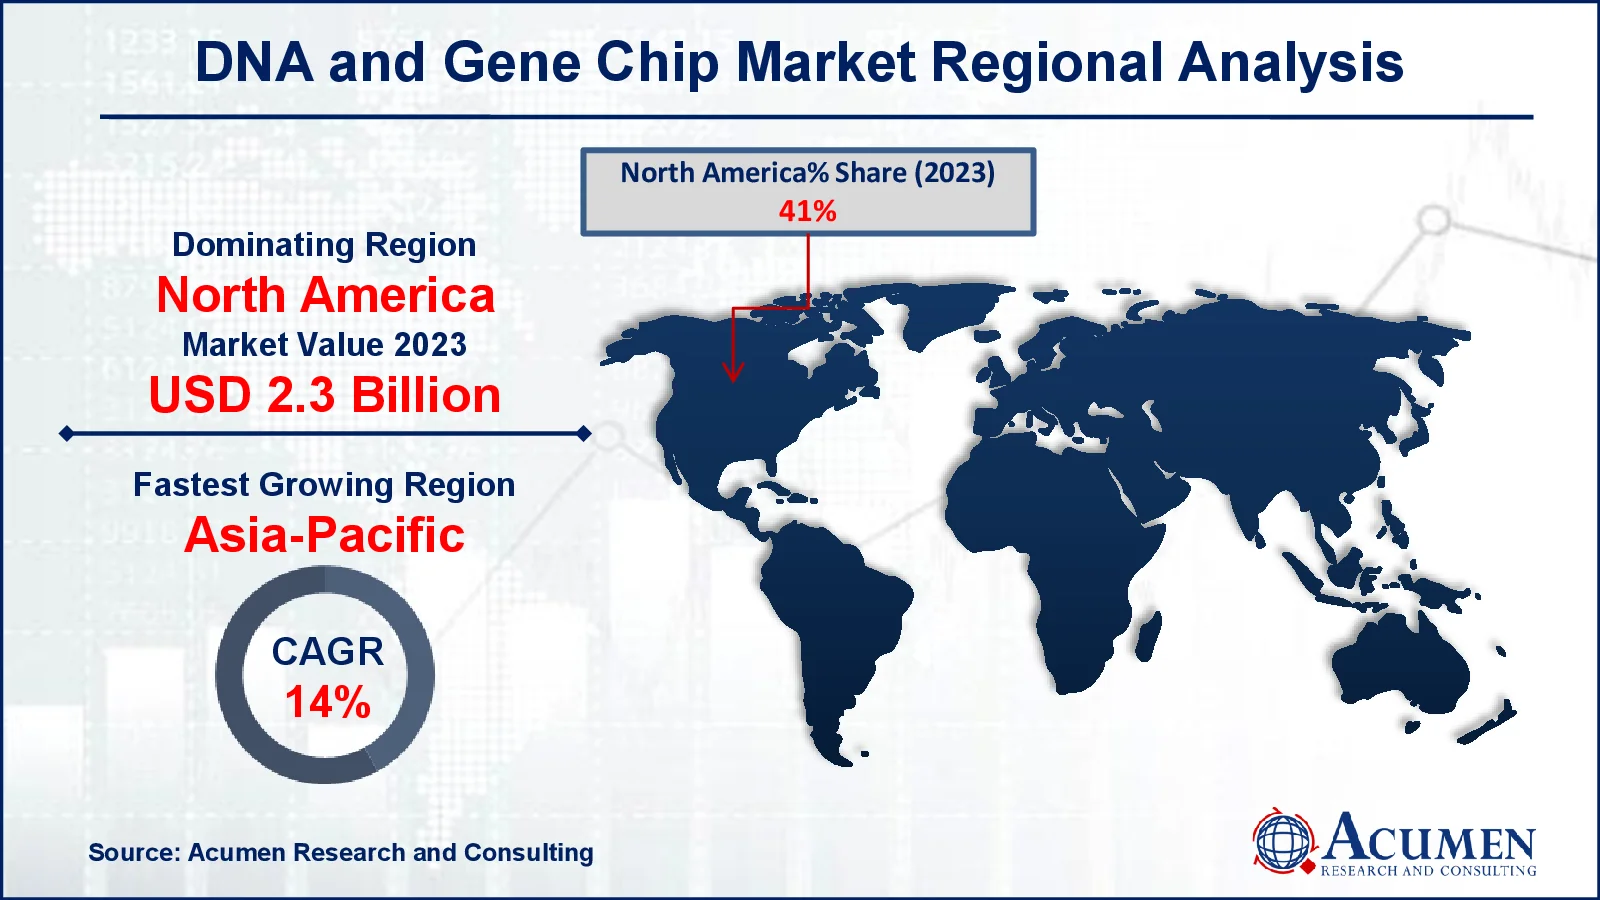
- North America DNA and gene chip market value occupied around USD 2.3 billion in 2023
- Asia-Pacific DNA and gene chip market growth will record a CAGR of more than 14% from 2024 to 2032
- Among application, the cancer diagnosis & treatment sub-segment generated significant of the market share in 2023
- Based on end-users, the academic & government research institutes sub-segment generated notable market share in 2023
- Gene chips are increasingly used for cancer research, including tumor profiling and drug response prediction is the DNA and gene chip market trend that fuels the industry demand

DNA and gene chips, also known as microarrays, are advanced tools used to analyze gene expression and genetic variations. They consist of a small glass or silicon chip with thousands of DNA probes attached, each representing a specific gene or genetic sequence. When a sample is applied to the chip, complementary DNA or RNA molecules bind to the probes, allowing researchers to detect and quantify gene activity or identify genetic mutations. Applications include studying gene expression patterns in diseases, such as cancer, and discovering genetic markers for various conditions. These chips are also used in personalized medicine to tailor treatments based on individual genetic profiles.
Global DNA and Gene Chip Market Dynamics
Market Drivers
- Growing prevalence of genetic disorders and chronic diseases
- Increasing demand for personalized medicine
- Advances in genomics and biotechnology
Market Restraints
- High costs associated with DNA and gene chip technologies
- Limited awareness and technical expertise
- Stringent regulatory frameworks and ethical concerns
Market Opportunities
- Expansion into emerging markets with growing healthcare infrastructure
- Integration of AI and machine learning for data analysis
- Development of novel applications in agriculture and environmental studies
DNA and Gene Chip Market Report Coverage
| Market | DNA and Gene Chip Market |
| DNA and Gene Chip Market Size 2022 |
USD 5.7 Billion |
| DNA and Gene Chip Market Forecast 2032 | USD 17.0 Billion |
| DNA and Gene Chip Market CAGR During 2023 - 2032 | 13,.1% |
| DNA and Gene Chip Market Analysis Period | 2020 - 2032 |
| DNA and Gene Chip Market Base Year |
2022 |
| DNA and Gene Chip Market Forecast Data | 2024 - 2032 |
| Segments Covered | By Application, By Product, By End-User, And By Geography |
| Regional Scope | North America, Europe, Asia Pacific, Latin America, and Middle East & Africa |
| Key Companies Profiled | Microarrays Inc., bioMérieux SA, Arrayit Corporation, Savyon Diagnostics, Illumina, Inc., Thermo Fisher Scientific, Inc, Perkin Elmer, Inc., MYcroarray, Macrogen Inc., CapitalBio Corporation, Agilent Technologies, Greiner Bio One International GmbH, Asper Biotech, and Oxford Gene Technology. |
| Report Coverage |
Market Trends, Drivers, Restraints, Competitive Analysis, Player Profiling, Covid-19 Analysis, Regulation Analysis |
DNA and Gene Chip Market Insights
The DNA and gene chip market is experiencing significant growth driven by the increasing prevalence of genetic disorders and chronic diseases. For instance, an estimated 129 million people in the US are affected by at least one major chronic disease, such as heart disease, cancer, diabetes, obesity, or hypertension, according to the US Department of Health and Human Services. These conditions often require advanced diagnostic and personalized treatment approaches, for which DNA and gene chips are crucial. These chips enable precise genetic analysis, facilitating early detection and tailored therapies, thus improving patient outcomes. As a result, the demand for DNA and gene chips continues to rise, reflecting their vital role in modern medical diagnostics and treatment planning.
The high costs associated with DNA and gene chip technologies present a significant restraint for the market due to several factors. Firstly, the initial investment in advanced equipment and materials required for manufacturing these chips is substantial. Additionally, the complexity of the technology necessitates specialized skills and training, further driving up operational costs. The expenses related to R&D and regulatory approvals also add to the overall financial burden. Moreover, limited reimbursement policies for genomic testing can hinder widespread adoption. Consequently, these financial barriers can slow down the market's growth and accessibility.
Expanding into emerging markets with growing healthcare infrastructure presents a significant opportunity for the DNA and gene chip market. For instance, according to Invest India, the Indian Medtech industry was valued at $10.63 billion in 2020 and is projected to grow to $50 billion by 2025. Expanding regions often face a high burden of genetic diseases and infectious illnesses, driving demand for advanced diagnostic tools. Improved healthcare systems facilitate the adoption of cutting-edge technologies, making gene chips more accessible and widely used. Furthermore, supportive government policies and increasing investments in healthcare infrastructure enhance market potential.
DNA and Gene Chip Market Segmentation
The worldwide market for DNA and gene chip is split based on application, product, end-user, and geography.
DNA and Gene Chip Applications
- Cancer Diagnosis & Treatment
- Gene Expression
- Genotyping
- Genomics
- Drug Discovery
- Agricultural Biotechnology
- Others
According to the DNA and gene chip industry analysis, the market is significantly driven by advancements in cancer diagnosis and treatment. These technologies enable precise genetic profiling of tumors, facilitating personalized treatment plans and early detection. The demand for targeted therapies and the rising prevalence of cancer have accelerated the adoption of gene chips in clinical settings. For instance, according to Down to Earth Organization, the minister noted that in 2023, India saw an estimated 1,496,972 cancer cases, up from 1,461,427 in 2022. Consequently, the market sees substantial investment and innovation focused on oncology applications.
DNA and Gene Chip Products
- Consumables
- Instrumentation
The consumables segment is the largest application category in the DNA and gene chip market due to their recurring demand in various research and diagnostic applications. These include reagents, microarrays, and other essential supplies that are frequently used in high-throughput genomic studies. The constant need for these items in laboratory workflows ensures a steady market demand. Additionally, advancements in biotechnology and personalized medicine further drive the consumption of these products. For instance, according to The Personalized Medicine Coalition, in 2023, the FDA approved 16 new personalized treatments for patients with rare diseases, a significant increase from the six approved in 2022. Among these new approvals, there are seven cancer drugs and three treatments for other diseases and conditions, which significantly accelerated growth of these products.
DNA and Gene Chip End-users
- Academic & Government Research Institutes
- Hospitals & Diagnostics Centers
- Biotechnology & Pharmaceutical Companies
- Others
According to the DNA and gene chip industry forecast, academic and government research institutes dominate the market due to their substantial investment in genomic research and biotechnological advancements. These institutions often have access to significant funding and resources, enabling them to purchase advanced genomic technologies for large-scale studies. Their focus on exploring genetic variations, disease mechanisms, and personalized medicine drives demand for high-throughput DNA and gene chips. Furthermore, collaborations with pharmaceutical companies and participation in large genomic projects enhance their market influence.
DNA and Gene Chip Market Regional Outlook
North America
- U.S.
- Canada
Europe
- U.K.
- Germany
- France
- Spain
- Rest of Europe
Asia-Pacific
- India
- Japan
- China
- Australia
- South Korea
- Rest of Asia-Pacific
Latin America
- Brazil
- Mexico
- Rest of Latin America
The Middle East & Africa
- South Africa
- GCC Countries
- Rest of the Middle East & Africa (ME&A)

DNA and Gene Chip Market Regional Analysis
For several reasons, North America dominates the DNA and gene chip market due to its advanced research infrastructure and high investment in biotechnology. The region boasts numerous top-tier research institutions and biotech firms driving innovation and adoption of cutting-edge genetic technologies. Significant research and development efforts by major industry players are driving market growth. For instance, in September 2020, Cardea Bio and Nanosens Innovations collaborated to create a diagnostic device based on CRISPR-Cas9 technology, which incorporates a graphene transistor, known as the CRISPR-Chip. Additionally, a strong regulatory framework and favorable policies further propel North America's dominance in this field.
Asia-Pacific is expected to emerge as a promising market, recording the highest CAGR during the forecast period due to increased demand for research and development in genomic studies and rising biotechnology sector. For instance, in 2023, the Indian bioeconomy industry was valued at $137 billion. It is projected to grow to $150 billion by 2025 and $300 billion by 2030. This biotechnology sector’s expansion is driven by increasing demand both domestically and internationally. Additionally, growing awareness about genetic testing for disease risk assessment and prevention is anticipated to positively impact the region's market growth.
DNA and Gene Chip Market Players
Some of the top DNA and gene chip companies offered in our report include Microarrays Inc., bioMérieux SA, Arrayit Corporation, Savyon Diagnostics, Illumina, Inc., Thermo Fisher Scientific, Inc, Perkin Elmer, Inc., MYcroarray, Macrogen Inc., CapitalBio Corporation, Agilent Technologies, Greiner Bio One International GmbH, Asper Biotech, and Oxford Gene Technology.
Frequently Asked Questions
How big is the DNA and Gene Chip market?
The DNA and gene chip market size was valued at USD 5.7 billion in 2023.
What is the CAGR of the global DNA and Gene Chip market from 2024 to 2032?
The CAGR of DNA and gene chip is 13.1% during the analysis period of 2024 to 2032.
Which are the key players in the DNA and Gene Chip market?
The key players operating in the global market are including Microarrays Inc., bioM�rieux SA, Arrayit Corporation, Savyon Diagnostics, Illumina, Inc., Thermo Fisher Scientific, Inc, Perkin Elmer, Inc., MYcroarray, Macrogen Inc., CapitalBio Corporation, Agilent Technologies, Greiner Bio One International GmbH, Asper Biotech, and Oxford Gene Technology.
Which region dominated the global DNA and Gene Chip market share?
North America held the dominating position in DNA and gene chip industry during the analysis period of 2024 to 2032.
Which region registered fastest CAGR from 2024 to 2032?
Asia-Pacific region exhibited fastest growing CAGR for market of DNA and gene chip during the analysis period of 2024 to 2032.
What are the current trends and dynamics in the global DNA and Gene Chip industry?
The current trends and dynamics in the DNA and gene chip industry include growing prevalence of genetic disorders and chronic diseases, increasing demand for personalized medicine, and advances in genomics and biotechnology.
Which application held the maximum share in 2023?
The cancer diagnosis & treatment application held the maximum share of the DNA and gene chip industry.


