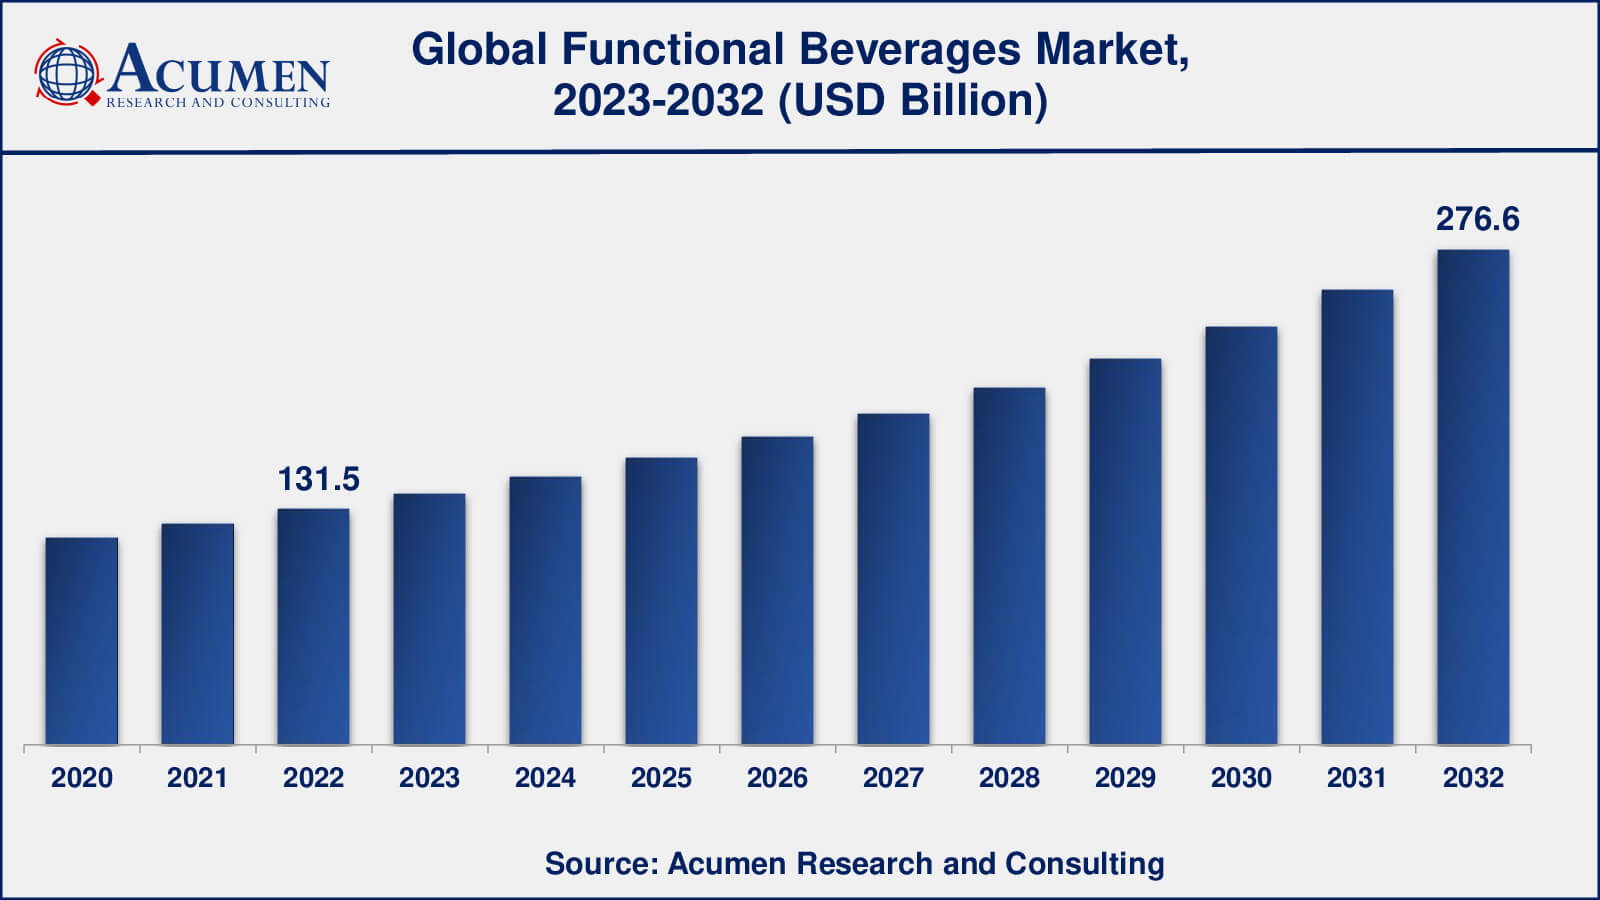
The Global Functional Beverages Market Size accounted for USD 131.5 Billion in 2022 and is estimated to achieve a market size of USD 276.6 Billion by 2032 growing at a CAGR of 7.8% from 2023 to 2032.
Functional Beverages Market Highlights
- Global functional beverages market revenue is poised to garner USD 276.6 billion by 2032 with a CAGR of 7.8% from 2023 to 2032
- North America functional beverages market value occupied around USD 56.6 billion in 2022
- Asia-Pacific functional beverages market growth will record a CAGR of more than 8% from 2023 to 2032
- Among type, the energy drinks sub-segment generated over US$ 49.9 billion revenue in 2022
- Based on end-user, the fitness lifestyle users based sub-segment generated around 38% share in 2022
- Increasing awareness in fitness is a popular market trend that fuels the industry demand
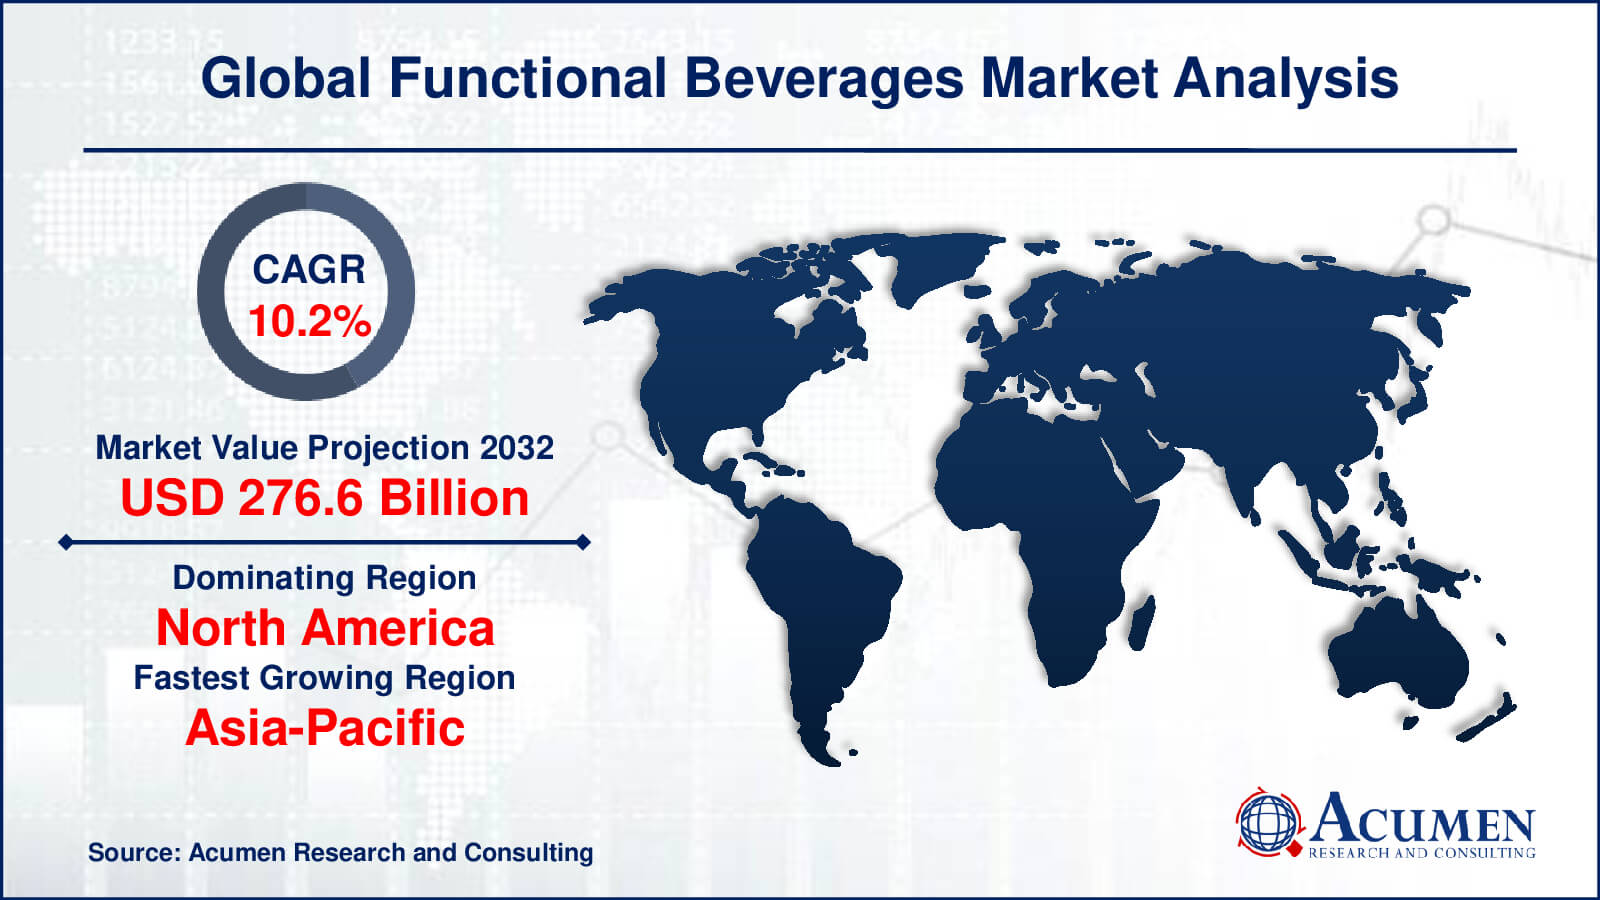
Functional beverages are specifically manufactured to enhance bodily functions and provide health benefits. These drinks are designed to promote immunity, aid digestion, manage stress, and offer various other advantages. They play a crucial role in maintaining a healthy lifestyle and are expected to experience rapid growth in the coming years. The rising demand for products that promote well-being will drive the expansion of this market. Functional beverages encompass a range of beverages, including energy drinks, sports drinks, functional water, and fortified drinks. These beverages have gained popularity, particularly among young people, as they contribute to improving health, addressing digestive issues, and providing numerous other benefits. They are available in a variety of flavors to cater to different preferences. Function beverages are non-alcoholic in nature and typically contain a combination of herbs, minerals, amino acids, and artificial additives. These ingredients have a positive impact on the human body and brain. Increased awareness of the importance of a healthy lifestyle and the consumption of nutritious products will contribute to the growth of the functional beverages market.
Global Functional Beverages Market Dynamics
Market Drivers
- Rising popularity in healthy and nutritious drinks
- Increasing awareness of fitness and healthy lifestyle
- Growing demand of sports drink in youngsters
- Rising demand for plant-based and lactose free products
Market Restraints
- Ingredient-level health concern
- Increase in government taxes
Market Opportunities
- Rising growth in retail sector
- Increase investment by food manufacturing companies
Functional Beverages Market Report Coverage
Market |
Functional Beverages Market
|
Functional Beverages Market Size 2022 |
USD 131.5 Billion |
Functional Beverages Market Forecast 2032 |
USD 276.6 Billion |
Functional Beverages Market CAGR During 2023 - 2032 |
7.8% |
Functional Beverages Market Analysis Period |
2020 - 2032 |
Functional Beverages Market Base Year |
2022 |
Functional Beverages Market Forecast Data |
2023 - 2032 |
Segments Covered |
By Type, By Ingredient Type, By Function, By End-User, By Distribution, And By Geography
|
Regional Scope |
North America, Europe, Asia Pacific, Latin America, and Middle East & Africa |
Key Companies Profiled |
Clif Bar, The Coca-Cola Company, DANONE SA, Dupont Nutrition Biosciences ApS, MaxiNutrition, MEIJI CO., LTD., Monster Beverage Corporation, National Beverage Corp., Nestlé, Otsuka Holdings Co., Ltd, PepsiCo, Red Bull GmbH, and Suntory Group.
|
Report Coverage
|
Market Trends, Drivers, Restraints, Competitive Analysis, Player Profiling, Covid-19 Analysis, Regulation Analysis |
Functional Beverages Market Insights
The growth of the functional beverages market is primarily driven by the increasing awareness of healthy lifestyles and fitness. These beverages offer various health benefits, including hydration, fluid maintenance, and nutritional advantages. The market is further propelled by the rise in sports activities at both national and international levels, leading to an increased number of athletes and sports enthusiasts. To cater to the growing demand, beverage manufacturing companies are introducing low-calorie, fat-free drinks with added flavors and vegetables to enhance taste quality. This trend, coupled with the rising adoption of vegan diets and the prevalence of lactose intolerance, has fueled the demand for plant-based and sugar-free functional beverages. In Germany, lactose-free drinks are gaining popularity and are available in a wide range of flavors, such as Sour mango kiwi, classic, Acai berry, and sour cherry.
However, the growth of the functional beverages market may face some challenges. Several countries, including Denmark, Mexico, Hungary, and the United Kingdom, have implemented or are considering increased taxes on food and drinks. In particular, the United Kingdom has raised taxes on sweet drinks. These tax policies may act as a restraint on the growth of the functional beverages market.
Overall, the functional beverages market is witnessing significant growth due to factors such as increased health awareness, sports participation, demand for low-calorie and sugar-free options, and the availability of a wide range of flavors. However, the market may face obstacles in the form of taxation policies imposed by certain countries.
Functional Beverages Market Segmentation
The worldwide market for functional beverages is split based on type, ingredient type, function, end-user, distribution channel, and geography.
Functional Beverage Types
- Energy Drinks
- Sports Drinks
- Dairy-Based Beverages
- Juices
- Nutraceutical Drinks
- Enhanced Water
- Others
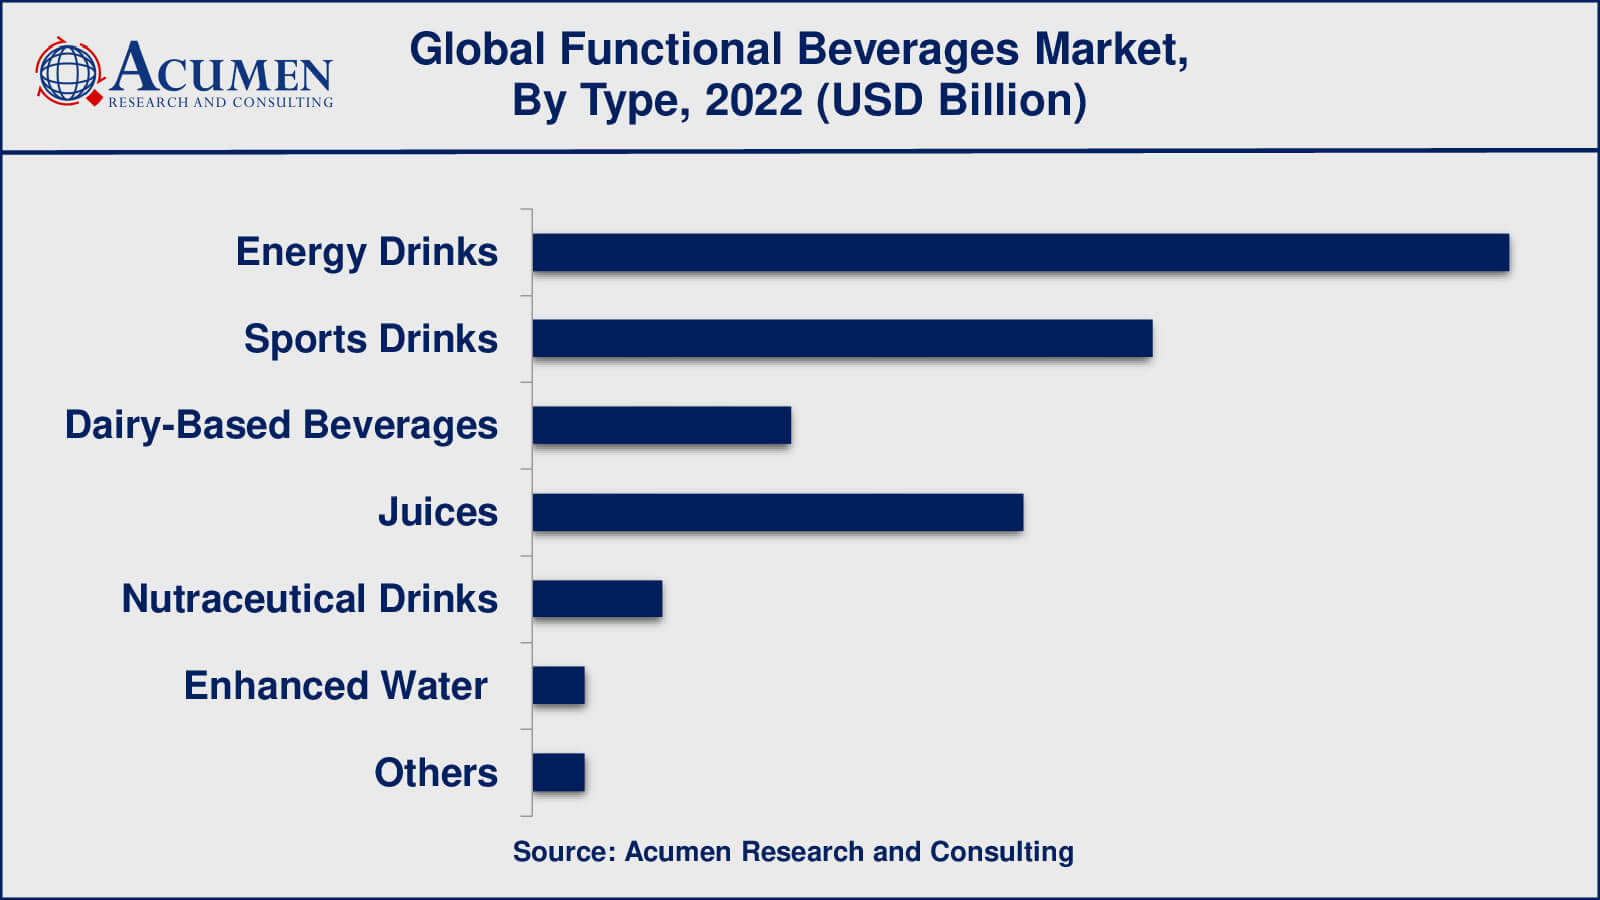
The functional beverage market can be segmented into various types, including energy drinks, sports drinks, dairy-based beverages, juices, nutraceutical drinks, enhanced water, and others. Among these segments, energy drinks have dominated the market in previous years. The increasing demand for a healthy lifestyle and growing fitness awareness, coupled with the rise in fitness centers, will be key drivers for the growth of this segment.
In the forecast period, the sports drink segment is expected to experience significant growth. Sports drinks are specifically formulated to provide instant energy during physical activities, thereby boosting both physical and mental health. These drinks are designed to enhance performance and replenish essential nutrients lost during exercise.
Overall, the functional beverage market encompasses a wide range of types, and energy drinks have been the dominant segment historically. However, the sports drink segment is projected to exhibit substantial growth due to its ability to provide instant energy and support overall well-being during physical activities.
Functional Beverage Ingredient Types
- Antioxidants
- Minerals
- Amino ACIDS
- Probiotics
- Prebiotics
- Vitamins
- Super-Fruit Extracts
- Botanical Flavors
The ingredient segment is an important component of the Functional Beverages market. Among the various ingredient types, vitamins hold a significant share. Notably, the sub-segment of vitamins, particularly vitamin C and vitamin D, is widely used in Functional Beverages. These vitamins offer numerous health benefits, including cell protection and maintenance, promoting healthy skin, blood vessels, bones, and cartilage, enhancing immune function, and facilitating relaxation. Vitamin D plays a crucial role in maintaining healthy bones, collagen production, and muscle generation and maintenance. The importance of these benefits drives the growth of the ingredient type segment in the Functional Beverages market.
Functional Beverage Functions
- Health and Wellness
- Weight Management
The function segment of the functional beverages market is categorized into two parts: health and wellness, and weight management. In previous years, the health and wellness category has emerged as the leader in terms of revenue share. Within the Health and Wellness segment, vitamin C plays a crucial role. Many beverage drinks contain vitamin C, which offers various benefits such as boosting immune function, aiding in bone formation, and providing structural support to the body. The Health and Wellness segment presents significant opportunities for the growth of the Functional Beverages market.
Functional Beverage End-Users
- Athletes
- Fitness Lifestyle Users
- Others
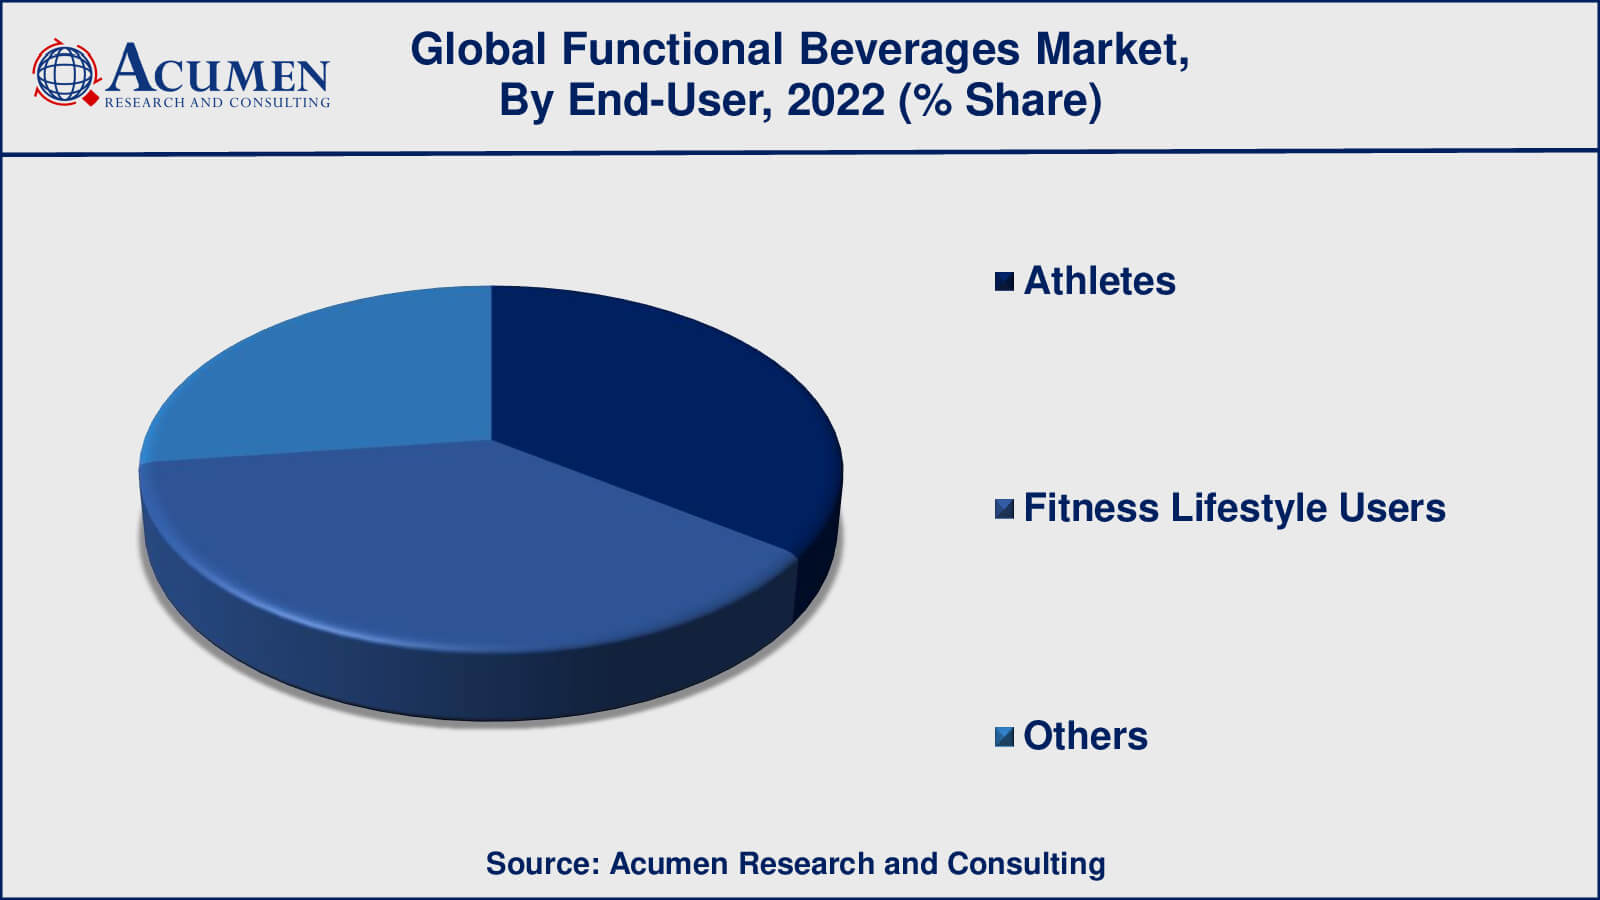
The end-user segment of the functional beverages market can be divided into three categories: athletes, fitness lifestyle users, and others. Among these sub-segments, the fitness lifestyle user category holds the largest market share. This sub-segment represents a growing trend in the health and fitness industry, as more consumers incorporate fitness and sports activities into their daily lives. The increasing awareness about the health benefits of activities like yoga and regular exercise is driving the rise in the number of fitness lifestyle users. These factors contribute to the growth of the fitness lifestyle user segment within the Functional Beverages market.
Functional Beverages Distribution Channel
- Supermarket And Hypermarket
- Specialty Stores
- E-Commerce
- Online Retails
- Health Store
- Store-Based
- Others
The distribution channel segment of the global functional beverages market includes supermarkets and hypermarkets, specialty stores, e-commerce, online retail, health stores, store-based retail, and others. Historically, supermarkets and hypermarkets have held the largest market share. However, it is projected that the online distribution channel will experience the highest compound annual growth rate (CAGR) during the forecast period. This growth can be attributed to the increasing rate of online shopping, particularly among young and working individuals. The convenience and accessibility offered by online shopping platforms, coupled with advancements in technology, are important factors driving the growth of the functional beverages market in the online distribution segment. While supermarkets and hypermarkets continue to contribute significantly to the market, the online distribution channel is expected to exhibit substantial growth in the coming years.
Functional Beverages Market Regional Outlook
North America
Europe
- U.K.
- Germany
- France
- Spain
- Rest of Europe
Asia-Pacific
- India
- Japan
- China
- Australia
- South Korea
- Rest of Asia-Pacific
Latin America
- Brazil
- Mexico
- Rest of Latin America
The Middle East & Africa
- South Africa
- GCC Countries
- Rest of the Middle East & Africa (ME&A)
Functional Beverages Market Regional Analysis
North America has emerged as the leading region in terms of revenue share in the functional beverages market in recent years. This growth is primarily driven by the increased demand for energy drinks and the growing adoption of a healthy lifestyle among consumers. The region is witnessing advancements in the development of beverages with attributes such as zero calories, zero sugar, and low carbohydrate content to cater to the preferences of health-conscious individuals.
In the upcoming years, Europe is expected to become the second-largest region in the functional beverages market. This growth is fueled by the rising demand for beverages among athletes and the youth population. Functional beverages, including sports and energy drinks, are gaining popularity as they are known to enhance performance and stamina among sports players. These factors are anticipated to drive the growth of the functional beverages market in Europe.
Functional Beverages Market Players
Some of the top functional beverages companies offered in our report include Clif Bar, The Coca-Cola Company, DANONE SA, Dupont Nutrition Biosciences ApS, MaxiNutrition, MEIJI CO., LTD., Monster Beverage Corporation, National Beverage Corp., Nestlé, Otsuka Holdings Co., Ltd, PepsiCo, Red Bull GmbH, and Suntory Group.

CHAPTER 1. Industry Overview of Functional Beverages Market
1.1. Definition and Scope
1.1.1. Definition of Functional Beverages
1.1.2. Market Segmentation
1.1.3. Years Considered for the Study
1.1.4. Assumptions and Acronyms Used
1.1.4.1. Market Assumptions and Market Forecast
1.1.4.2. Acronyms Used in Global Functional Beverages Market
1.2. Summary
1.2.1. Executive Summary
1.2.2. Functional Beverages Market By Type
1.2.3. Functional Beverages Market By Ingredient Types
1.2.4. Functional Beverages Market By Function
1.2.5. Functional Beverages Market By End-User
1.2.6. Functional Beverages Market By Distribution Channel
1.2.7. Functional Beverages Market By Region
CHAPTER 2. Research Approach
2.1. Methodology
2.1.1. Research Programs
2.1.2. Market Size Estimation
2.1.3. Market Breakdown and Data Triangulation
2.2. Data Source
2.2.1. Secondary Sources
2.2.2. Primary Sources
CHAPTER 3. Market Dynamics And Competition Analysis
3.1. Market Drivers
3.1.1. Driver 1
3.1.2. Driver 2
3.1.3. Driver 3
3.1.4. Driver 4
3.2. Restraints and Challenges
3.2.1. Restraint 1
3.2.2. Restraint 2
3.3. Growth Opportunities
3.3.1. Opportunity 1
3.3.2. Opportunity 2
3.4. Porter’s Five Forces Analysis
3.4.1. Bargaining Power of Suppliers
3.4.2. Bargaining Power of Buyers
3.4.3. Threat of Substitute
3.4.4. Threat of New Entrants
3.4.5. Degree of Competition
3.5. Market Concentration Ratio and Market Maturity Analysis of Functional Beverages Market
3.5.1. Go To Market Strategy
3.5.1.1. Introduction
3.5.1.2. Growth
3.5.1.3. Maturity
3.5.1.4. Saturation
3.5.1.5. Possible Development
3.6. Technological Roadmap for Functional Beverages Market
3.7. Value Chain Analysis
3.7.1. List of Key Manufacturers
3.7.2. List of Customers
3.7.3. Level of Integration
3.8. Cost Structure Analysis
3.8.1. Price Trend of Key Raw Materials
3.8.2. Raw Material Suppliers
3.8.3. Proportion of Manufacturing Cost Structure
3.8.3.1. Raw Material
3.8.3.2. Labor Cost
3.8.3.3. Manufacturing Expense
3.9. Regulatory Compliance
3.10. Competitive Landscape, 2022
3.10.1. Player Positioning Analysis
3.10.2. Key Strategies Adopted By Leading Players
CHAPTER 4. Manufacturing Plant Analysis
4.1. Manufacturing Plant Location and Establish Date of Major Manufacturers in 2022
4.2. R&D Status of Major Manufacturers in 2022
CHAPTER 5. Functional Beverages Market By Type
5.1. Introduction
5.2. Functional Beverages Revenue By Type
5.2.1. Functional Beverages Revenue (USD Billion) and Forecast, By Type, 2020-2032
5.2.2. Energy Drinks
5.2.2.1. Energy Drinks Market Revenue (USD Billion) and Growth Rate (%), 2020-2032
5.2.3. Sports Drinks
5.2.3.1. Sports Drinks Market Revenue (USD Billion) and Growth Rate (%), 2020-2032
5.2.4. Dairy-Based Beverages
5.2.4.1. Dairy-Based Beverages Market Revenue (USD Billion) and Growth Rate (%), 2020-2032
5.2.5. Juices
5.2.5.1. Juices Market Revenue (USD Billion) and Growth Rate (%), 2020-2032
5.2.6. Nutraceutical Drinks
5.2.6.1. Nutraceutical Drinks Market Revenue (USD Billion) and Growth Rate (%), 2020-2032
5.2.7. Enhanced Water
5.2.7.1. Enhanced Water Market Revenue (USD Billion) and Growth Rate (%), 2020-2032
5.2.8. Others
5.2.8.1. Others Market Revenue (USD Billion) and Growth Rate (%), 2020-2032
CHAPTER 6. Functional Beverages Market By Ingredient Types
6.1. Introduction
6.2. Functional Beverages Revenue By Ingredient Types
6.2.1. Functional Beverages Revenue (USD Billion) and Forecast, By Ingredient Types, 2020-2032
6.2.2. Antioxidants
6.2.2.1. Antioxidants Market Revenue (USD Billion) and Growth Rate (%), 2020-2032
6.2.3. Minerals
6.2.3.1. Minerals Market Revenue (USD Billion) and Growth Rate (%), 2020-2032
6.2.4. Amino acids
6.2.4.1. Amino Acids Market Revenue (USD Billion) and Growth Rate (%), 2020-2032
6.2.5. Probiotics
6.2.5.1. Probiotics Market Revenue (USD Billion) and Growth Rate (%), 2020-2032
6.2.6. Prebiotics
6.2.6.1. Prebiotics Market Revenue (USD Billion) and Growth Rate (%), 2020-2032
6.2.7. Vitamins
6.2.7.1. Vitamins Market Revenue (USD Billion) and Growth Rate (%), 2020-2032
6.2.8. Super-Fruit extracts
6.2.8.1. Super-Fruit Extracts Market Revenue (USD Billion) and Growth Rate (%), 2020-2032
6.2.9. Botanical Flavors
6.2.9.1. Botanical Flavors Market Revenue (USD Billion) and Growth Rate (%), 2020-2032
CHAPTER 7. Functional Beverages Market By Function
7.1. Introduction
7.2. Functional Beverages Revenue By Function
7.2.1. Functional Beverages Revenue (USD Billion) and Forecast, By Function, 2020-2032
7.2.2. Health and Wellness
7.2.2.1. Health and Wellness Market Revenue (USD Billion) and Growth Rate (%), 2020-2032
7.2.3. Weight Management
7.2.3.1. Weight Management Market Revenue (USD Billion) and Growth Rate (%), 2020-2032
CHAPTER 8. Functional Beverages Market By End-User
8.1. Introduction
8.2. Functional Beverages Revenue By End-User
8.2.1. Functional Beverages Revenue (USD Billion) and Forecast, By End-User, 2020-2032
8.2.2. Athletes
8.2.2.1. Athletes Market Revenue (USD Billion) and Growth Rate (%), 2020-2032
8.2.3. Fitness Lifestyle Users
8.2.3.1. Fitness Lifestyle Users Market Revenue (USD Billion) and Growth Rate (%), 2020-2032
8.2.4. Others
8.2.4.1. Others Market Revenue (USD Billion) and Growth Rate (%), 2020-2032
CHAPTER 9. Functional Beverages Market By Distribution Channel
9.1. Introduction
9.2. Functional Beverages Revenue By Distribution Channel
9.2.1. Functional Beverages Revenue (USD Billion) and Forecast, By Distribution Channel, 2020-2032
9.2.2. Supermarket and Hypermarket
9.2.2.1. Supermarket and Hypermarket Market Revenue (USD Billion) and Growth Rate (%), 2020-2032
9.2.3. Specialty Stores
9.2.3.1. Specialty Stores Market Revenue (USD Billion) and Growth Rate (%), 2020-2032
9.2.4. E-Commerce
9.2.4.1. E-Commerce Market Revenue (USD Billion) and Growth Rate (%), 2020-2032
9.2.5. Online Retails
9.2.5.1. Online Retails Market Revenue (USD Billion) and Growth Rate (%), 2020-2032
9.2.6. Health Store
9.2.6.1. Health Store Market Revenue (USD Billion) and Growth Rate (%), 2020-2032
9.2.7. Store-Based
9.2.7.1. Store-Based Market Revenue (USD Billion) and Growth Rate (%), 2020-2032
9.2.8. Others
9.2.8.1. Others Market Revenue (USD Billion) and Growth Rate (%), 2020-2032
CHAPTER 10. North America Functional Beverages Market By Country
10.1. North America Functional Beverages Market Overview
10.2. U.S.
10.2.1. U.S. Functional Beverages Revenue (USD Billion) and Forecast By Type, 2020-2032
10.2.2. U.S. Functional Beverages Revenue (USD Billion) and Forecast By Ingredient Types, 2020-2032
10.2.3. U.S. Functional Beverages Revenue (USD Billion) and Forecast By Function, 2020-2032
10.2.4. U.S. Functional Beverages Revenue (USD Billion) and Forecast By End-User, 2020-2032
10.2.5. U.S. Functional Beverages Revenue (USD Billion) and Forecast By Distribution Channel, 2020-2032
10.3. Canada
10.3.1. Canada Functional Beverages Revenue (USD Billion) and Forecast By Type, 2020-2032
10.3.2. Canada Functional Beverages Revenue (USD Billion) and Forecast By Ingredient Types, 2020-2032
10.3.3. Canada Functional Beverages Revenue (USD Billion) and Forecast By Function, 2020-2032
10.3.4. Canada Functional Beverages Revenue (USD Billion) and Forecast By End-User, 2020-2032
10.3.5. Canada Functional Beverages Revenue (USD Billion) and Forecast By Distribution Channel, 2020-2032
10.4. North America PEST Analysis
CHAPTER 11. Europe Functional Beverages Market By Country
11.1. Europe Functional Beverages Market Overview
11.2. U.K.
11.2.1. U.K. Functional Beverages Revenue (USD Billion) and Forecast By Type, 2020-2032
11.2.2. U.K. Functional Beverages Revenue (USD Billion) and Forecast By Ingredient Types, 2020-2032
11.2.3. U.K. Functional Beverages Revenue (USD Billion) and Forecast By Function, 2020-2032
11.2.4. U.K. Functional Beverages Revenue (USD Billion) and Forecast By End-User, 2020-2032
11.2.5. U.K. Functional Beverages Revenue (USD Billion) and Forecast By Distribution Channel, 2020-2032
11.3. Germany
11.3.1. Germany Functional Beverages Revenue (USD Billion) and Forecast By Type, 2020-2032
11.3.2. Germany Functional Beverages Revenue (USD Billion) and Forecast By Ingredient Types, 2020-2032
11.3.3. Germany Functional Beverages Revenue (USD Billion) and Forecast By Function, 2020-2032
11.3.4. Germany Functional Beverages Revenue (USD Billion) and Forecast By End-User, 2020-2032
11.3.5. Germany Functional Beverages Revenue (USD Billion) and Forecast By Distribution Channel, 2020-2032
11.4. France
11.4.1. France Functional Beverages Revenue (USD Billion) and Forecast By Type, 2020-2032
11.4.2. France Functional Beverages Revenue (USD Billion) and Forecast By Ingredient Types, 2020-2032
11.4.3. France Functional Beverages Revenue (USD Billion) and Forecast By Function, 2020-2032
11.4.4. France Functional Beverages Revenue (USD Billion) and Forecast By End-User, 2020-2032
11.4.5. France Functional Beverages Revenue (USD Billion) and Forecast By Distribution Channel, 2020-2032
11.5. Spain
11.5.1. Spain Functional Beverages Revenue (USD Billion) and Forecast By Type, 2020-2032
11.5.2. Spain Functional Beverages Revenue (USD Billion) and Forecast By Ingredient Types, 2020-2032
11.5.3. Spain Functional Beverages Revenue (USD Billion) and Forecast By Function, 2020-2032
11.5.4. Spain Functional Beverages Revenue (USD Billion) and Forecast By End-User, 2020-2032
11.5.5. Spain Functional Beverages Revenue (USD Billion) and Forecast By Distribution Channel, 2020-2032
11.6. Rest of Europe
11.6.1. Rest of Europe Functional Beverages Revenue (USD Billion) and Forecast By Type, 2020-2032
11.6.2. Rest of Europe Functional Beverages Revenue (USD Billion) and Forecast By Ingredient Types, 2020-2032
11.6.3. Rest of Europe Functional Beverages Revenue (USD Billion) and Forecast By Function, 2020-2032
11.6.4. Rest of Europe Functional Beverages Revenue (USD Billion) and Forecast By End-User, 2020-2032
11.6.5. Rest of Europe Functional Beverages Revenue (USD Billion) and Forecast By Distribution Channel, 2020-2032
11.7. Europe PEST Analysis
CHAPTER 12. Asia Pacific Functional Beverages Market By Country
12.1. Asia Pacific Functional Beverages Market Overview
12.2. China
12.2.1. China Functional Beverages Revenue (USD Billion) and Forecast By Type, 2020-2032
12.2.2. China Functional Beverages Revenue (USD Billion) and Forecast By Ingredient Types, 2020-2032
12.2.3. China Functional Beverages Revenue (USD Billion) and Forecast By Function, 2020-2032
12.2.4. China Functional Beverages Revenue (USD Billion) and Forecast By End-User, 2020-2032
12.2.5. China Functional Beverages Revenue (USD Billion) and Forecast By Distribution Channel, 2020-2032
12.3. Japan
12.3.1. Japan Functional Beverages Revenue (USD Billion) and Forecast By Type, 2020-2032
12.3.2. Japan Functional Beverages Revenue (USD Billion) and Forecast By Ingredient Types, 2020-2032
12.3.3. Japan Functional Beverages Revenue (USD Billion) and Forecast By Function, 2020-2032
12.3.4. Japan Functional Beverages Revenue (USD Billion) and Forecast By End-User, 2020-2032
12.3.5. Japan Functional Beverages Revenue (USD Billion) and Forecast By Distribution Channel, 2020-2032
12.4. India
12.4.1. India Functional Beverages Revenue (USD Billion) and Forecast By Type, 2020-2032
12.4.2. India Functional Beverages Revenue (USD Billion) and Forecast By Ingredient Types, 2020-2032
12.4.3. India Functional Beverages Revenue (USD Billion) and Forecast By Function, 2020-2032
12.4.4. India Functional Beverages Revenue (USD Billion) and Forecast By End-User, 2020-2032
12.4.5. India Functional Beverages Revenue (USD Billion) and Forecast By Distribution Channel, 2020-2032
12.5. Australia
12.5.1. Australia Functional Beverages Revenue (USD Billion) and Forecast By Type, 2020-2032
12.5.2. Australia Functional Beverages Revenue (USD Billion) and Forecast By Ingredient Types, 2020-2032
12.5.3. Australia Functional Beverages Revenue (USD Billion) and Forecast By Function, 2020-2032
12.5.4. Australia Functional Beverages Revenue (USD Billion) and Forecast By End-User, 2020-2032
12.5.5. Australia Functional Beverages Revenue (USD Billion) and Forecast By Distribution Channel, 2020-2032
12.6. South Korea
12.6.1. South Korea Functional Beverages Revenue (USD Billion) and Forecast By Type, 2020-2032
12.6.2. South Korea Functional Beverages Revenue (USD Billion) and Forecast By Ingredient Types, 2020-2032
12.6.3. South Korea Functional Beverages Revenue (USD Billion) and Forecast By Function, 2020-2032
12.6.4. South Korea Functional Beverages Revenue (USD Billion) and Forecast By End-User, 2020-2032
12.6.5. South Korea Functional Beverages Revenue (USD Billion) and Forecast By Distribution Channel, 2020-2032
12.7. Rest of Asia-Pacific
12.7.1. Rest of Asia-Pacific Functional Beverages Revenue (USD Billion) and Forecast By Type, 2020-2032
12.7.2. Rest of Asia-Pacific Functional Beverages Revenue (USD Billion) and Forecast By Ingredient Types, 2020-2032
12.7.3. Rest of Asia-Pacific Functional Beverages Revenue (USD Billion) and Forecast By Function, 2020-2032
12.7.4. Rest of Asia-Pacific Functional Beverages Revenue (USD Billion) and Forecast By End-User, 2020-2032
12.7.5. Rest of Asia-Pacific Functional Beverages Revenue (USD Billion) and Forecast By Distribution Channel, 2020-2032
12.8. Asia Pacific PEST Analysis
CHAPTER 13. Latin America Functional Beverages Market By Country
13.1. Latin America Functional Beverages Market Overview
13.2. Brazil
13.2.1. Brazil Functional Beverages Revenue (USD Billion) and Forecast By Type, 2020-2032
13.2.2. Brazil Functional Beverages Revenue (USD Billion) and Forecast By Ingredient Types, 2020-2032
13.2.3. Brazil Functional Beverages Revenue (USD Billion) and Forecast By Function, 2020-2032
13.2.4. Brazil Functional Beverages Revenue (USD Billion) and Forecast By End-User, 2020-2032
13.2.5. Brazil Functional Beverages Revenue (USD Billion) and Forecast By Distribution Channel, 2020-2032
13.3. Mexico
13.3.1. Mexico Functional Beverages Revenue (USD Billion) and Forecast By Type, 2020-2032
13.3.2. Mexico Functional Beverages Revenue (USD Billion) and Forecast By Ingredient Types, 2020-2032
13.3.3. Mexico Functional Beverages Revenue (USD Billion) and Forecast By Function, 2020-2032
13.3.4. Mexico Functional Beverages Revenue (USD Billion) and Forecast By End-User, 2020-2032
13.3.5. Mexico Functional Beverages Revenue (USD Billion) and Forecast By Distribution Channel, 2020-2032
13.4. Rest of Latin America
13.4.1. Rest of Latin America Functional Beverages Revenue (USD Billion) and Forecast By Type, 2020-2032
13.4.2. Rest of Latin America Functional Beverages Revenue (USD Billion) and Forecast By Ingredient Types, 2020-2032
13.4.3. Rest of Latin America Functional Beverages Revenue (USD Billion) and Forecast By Function, 2020-2032
13.4.4. Rest of Latin America Functional Beverages Revenue (USD Billion) and Forecast By End-User, 2020-2032
13.4.5. Rest of Latin America Functional Beverages Revenue (USD Billion) and Forecast By Distribution Channel, 2020-2032
13.5. Latin America PEST Analysis
CHAPTER 14. Middle East & Africa Functional Beverages Market By Country
14.1. Middle East & Africa Functional Beverages Market Overview
14.2. GCC
14.2.1. GCC Functional Beverages Revenue (USD Billion) and Forecast By Type, 2020-2032
14.2.2. GCC Functional Beverages Revenue (USD Billion) and Forecast By Ingredient Types, 2020-2032
14.2.3. GCC Functional Beverages Revenue (USD Billion) and Forecast By Function, 2020-2032
14.2.4. GCC Functional Beverages Revenue (USD Billion) and Forecast By End-User, 2020-2032
14.2.5. GCC Functional Beverages Revenue (USD Billion) and Forecast By Distribution Channel, 2020-2032
14.3. South Africa
14.3.1. South Africa Functional Beverages Revenue (USD Billion) and Forecast By Type, 2020-2032
14.3.2. South Africa Functional Beverages Revenue (USD Billion) and Forecast By Ingredient Types, 2020-2032
14.3.3. South Africa Functional Beverages Revenue (USD Billion) and Forecast By Function, 2020-2032
14.3.4. South Africa Functional Beverages Revenue (USD Billion) and Forecast By End-User, 2020-2032
14.3.5. South Africa Functional Beverages Revenue (USD Billion) and Forecast By Distribution Channel, 2020-2032
14.4. Rest of Middle East & Africa
14.4.1. Rest of Middle East & Africa Functional Beverages Revenue (USD Billion) and Forecast By Type, 2020-2032
14.4.2. Rest of Middle East & Africa Functional Beverages Revenue (USD Billion) and Forecast By Ingredient Types, 2020-2032
14.4.3. Rest of Middle East & Africa Functional Beverages Revenue (USD Billion) and Forecast By Function, 2020-2032
14.4.4. Rest of Middle East & Africa Functional Beverages Revenue (USD Billion) and Forecast By End-User, 2020-2032
14.4.5. Rest of Middle East & Africa Functional Beverages Revenue (USD Billion) and Forecast By Distribution Channel, 2020-2032
14.5. Middle East & Africa PEST Analysis
CHAPTER 15. Player Analysis Of Functional Beverages Market
15.1. Functional Beverages Market Company Share Analysis
15.2. Competition Matrix
15.2.1. Competitive Benchmarking of key players by price, presence, market share, and R&D investment
15.2.2. New Product Launches and Product Enhancements
15.2.3. Mergers And Acquisition In Global Functional Beverages Market
15.2.4. Partnership, Joint Ventures and Strategic Alliances/ Sales Agreements
CHAPTER 16. Company Profile
16.1. Clif Bar
16.1.1. Company Snapshot
16.1.2. Business Overview
16.1.3. Financial Overview
16.1.3.1. Revenue (USD Billion), 2022
16.1.3.2. Clif Bar 2022 Functional Beverages Business Regional Distribution
16.1.4. Product /Service and Specification
16.1.5. Recent Developments & Business Strategy
16.2. Monster Beverage Corporation
16.3. DANONE SA
16.4. Dupont Nutrition Biosciences ApS
16.5. MaxiNutrition
16.6. MEIJI CO., LTD.
16.7. Monster Beverage Corporation
16.8. National Beverage Corp.
16.9. Nestlé
16.10. Otsuka Holdings Co., Ltd
16.11. PepsiCo
16.12. Red Bull GmbH
16.13. Suntory Group
16.14. The Coca-Cola Company