Force Sensor Market Size - Global Industry, Share, Analysis, Trends and Forecast 2024 - 2032
Published :
Report ID:
Pages :
Format :
Force Sensor Market Size - Global Industry, Share, Analysis, Trends and Forecast 2024 - 2032
Report Coverage
- Industry Dynamics
- Market Size and Forecast Data
- Segment Analysis
- Competitive Landscape
- Regional Analysis with a Niche Focus on Country-Level Data
- High Level Analysis - Porter's, PESTEL, Value Chain, etc.
- Company Profiles of Key Players
- Option to Customize the Report As Per Your Specific Need
Request Sample Report
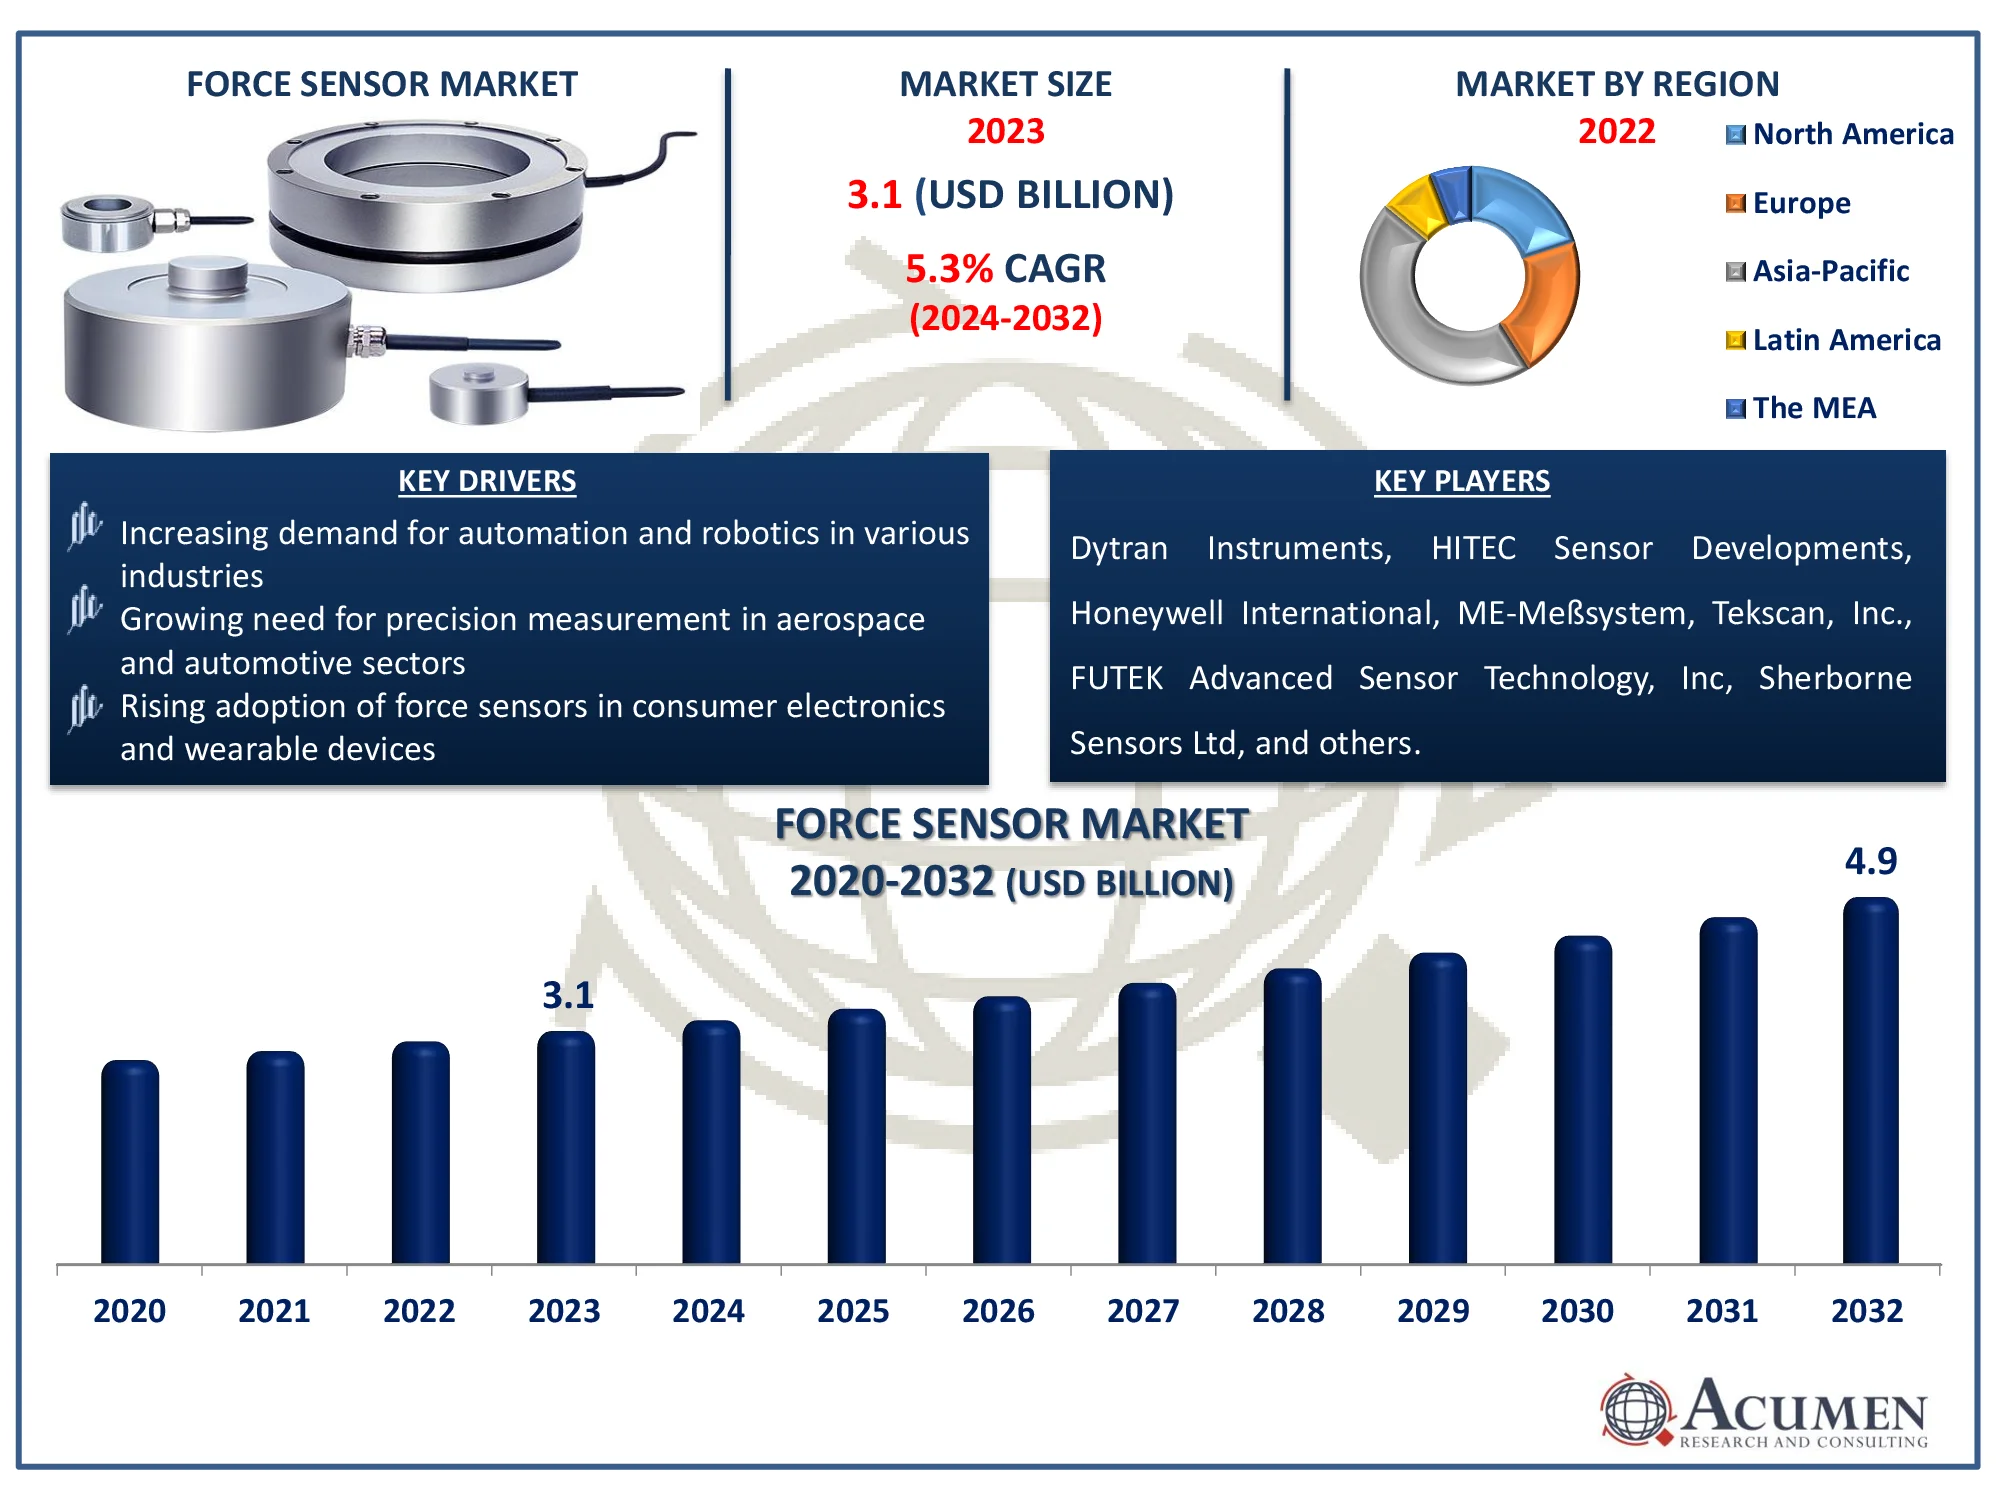
The Global Force Sensor Market Size accounted for USD 3.1 Billion in 2023 and is estimated to achieve a market size of USD 4.9 Billion by 2032 growing at a CAGR of 5.3% from 2024 to 2032
Force Sensor Market Highlights
- Global force sensor market revenue is poised to garner USD 4.9 billion by 2032 with a CAGR of 5.3% from 2024 to 2032
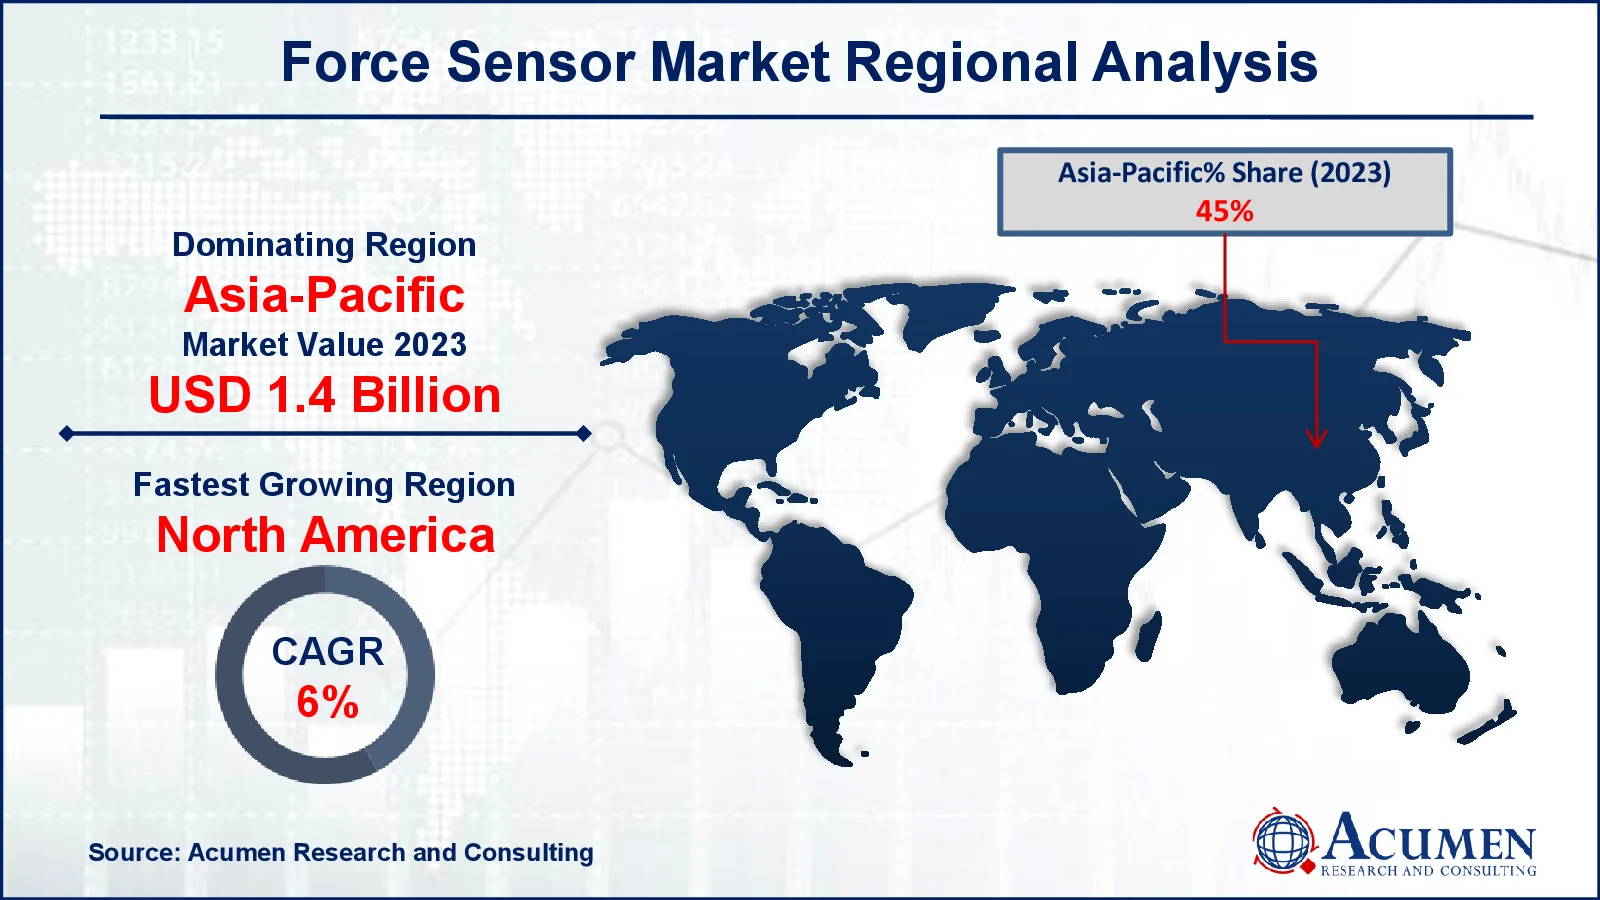
- Asia-Pacific force sensor market value occupied around USD 1.4 billion in 2023
- North America force sensor market growth will record a CAGR of more than 6% from 2024 to 2032
- Among force type, the compression sub-segment generated 51% of the market share in 2023
- Based on technology, the strain gauge sub-segment generated 40% market share in 2023
- Enhanced use in smart devices and IoT applications for real-time data monitoring is the force sensor market trend that fuels the industry demand

The force sensors measure the force between two surfaces. These sensors are primarily used to translate applied pressure into the corresponding value of electric current. Force sensors are ultra-thin and can be easily integrated into force measuring applications. Force sensors are known to be force sensing sensors; when external pressure, force, or mechanical stress is applied, the resistance varies. Force sensors are widely employed in a variety of industries, including medical and pharmaceutical, robotics, manufacturing, and automotive. Force sensors are utilized in a variety of industrial applications, including the process and manufacturing industries. It is employed in traffic engineering, medical science, rail monitoring, industrial control, and biomechanics, as well as for testing.
Global Force Sensor Market Dynamics
Market Drivers
- Increasing demand for automation and robotics in various industries
- Growing need for precision measurement in aerospace and automotive sectors
- Rising adoption of force sensors in consumer electronics and wearable devices
Market Restraints
- High initial cost of advanced force sensor technologies
- Challenges related to sensor calibration and maintenance
- Limited awareness and adoption in developing regions
Market Opportunities
- Expansion of the internet of things (IoT) and smart infrastructure
- Advancements in sensor technology leading to more affordable solutions
- Emerging applications in medical devices and healthcare monitoring
Force Sensor Market Report Coverage
| Market | Force Sensor Market |
| Force Sensor Market Size 2022 |
USD 3.1 Billion |
| Force Sensor Market Forecast 2032 | USD 4.9 Billion |
| Force Sensor Market CAGR During 2023 - 2032 | 5.3% |
| Force Sensor Market Analysis Period | 2020 - 2032 |
| Force Sensor Market Base Year |
2022 |
| Force Sensor Market Forecast Data | 2023 - 2032 |
| Segments Covered | By Operation, By Force Type, By Technology, By End-Use Industry, And By Geography |
| Regional Scope | North America, Europe, Asia Pacific, Latin America, and Middle East & Africa |
| Key Companies Profiled | Dytran Instruments, Inc., HITEC Sensor Developments, Inc., Honeywell International Inc., ME-Meßsysteme GmbH, Tekscan, Inc., FUTEK Advanced Sensor Technology, Inc., Sherborne Sensors Ltd., Kistler Group, TE Connectivity Ltd., Lorenz Messtechnik GmbH, Flintec Group AB, and among others. |
| Report Coverage |
Market Trends, Drivers, Restraints, Competitive Analysis, Player Profiling, Covid-19 Analysis, Regulation Analysis |
Force Sensor Market Insights
The increasing acceptance and application of force sensors in construction, industrial, and manufacturing sectors are driving market expansion. Furthermore, increased demand for force sensors in medical and robotic sensors is driving market expansion. For instance, in July 2020, Alps Electric Co. Ltd. stated that they would begin producing a new type of sensor known as the HSFPAR007A Force Sensor. This sensor can detect extremely low levels of pressure—as low as 0.01 Newtons. This makes it suitable for applications that demand exact force measurements, such as robotic arms and other machines that must handle sensitive equipment with precision.
Furthermore, cheap manufacturing costs, high reliability, and accuracy will drive the market throughout the projection period. Moreover, inflexible construction is limiting industry expansion. However, continued development and innovation in sensor technology have the potential to drive market expansion over the projection period. For instance, October, 2022 - Sensata Technologies has introduced a new Brake Pedal Force Sensor for electromechanical brakes (EMBs), resulting in safer and more efficient braking systems. Sensata's micro strain gauge Brake Pedal Force sensor contributes to the future of braking. When compared to other technologies, using this sensor minimizes a vehicle's stopping distance. It increases braking performance by precisely and quickly detecting a driver's braking intent.
The rise of the Internet of Things (IoT) and smart infrastructure is opening up new potential for force sensors. These sensors measure stresses and pressures in smart buildings and cities, so making them safer and more efficient. As more devices and systems connect via IoT, the demand for precise force measurement grows. This creates a greater demand for force sensors. Overall, the growth of IoT and smart technology is propelling the force sensor market.
Force Sensor Market Segmentation
The worldwide market for force sensor is split based on operation, force type, technology, end-use industry, and geography.
Force Sensors Market By Operation
- Analog
- Digital
According to the force sensor industry analysis, analog operation dominates the market because it is simple and reliable in sensing force. Analog sensors provide real-time data and continuous output, making them perfect for a variety of industrial applications requiring precise force measurement. Their basic design provides lower costs and better integration with current systems. Furthermore, analog sensors have great resolution and can be quite sensitive; making them ideal for applications that needs precise force measurement.
Force Sensors Market By Force Type
- Compression and Tension
- Compression
- Tension
As per the force sensor industry analysis, the compression type dominates the force sensor market due to its widespread use in applications requiring precise measurement of compressive forces. These sensors are highly accurate and reliable, making them ideal for industrial automation, material testing, and structural health monitoring. Additionally, compression force sensors are versatile and can be easily integrated into various systems, enhancing their appeal. Their durability and ability to function in harsh environments further contribute to their dominance in the market.
Force Sensors Market By Technology
- Strain Gauge
- Load Cell
- Force-Sensitive Resistors (FSRs)
- Others
According to the force sensor market forecast, strain gauges are the most popular type of force sensors because they are very accurate and reliable. They measure force by detecting small changes in a material when it's pressed or pulled. This makes them useful in many areas, like industrial machines, airplanes, and cars. Strain gauges are also cost-effective and can work in tough conditions. Recent improvements in their design have made them even better, due to they are widely used in the force sensor market.
Force Sensors Market By End-Use Industry
- Automotive
- Manufacturing
- Mining
- Aerospace & Defense
- Construction
- Healthcare
- Others
Based on force sensor industry, the automotive industry is likely to dominate the market due to increased need for sophisticated safety systems, automation, and electric vehicles. Force sensors play an important part in a variety of automotive applications, including airbags, brake systems, and engine control, improving vehicle performance and safety. Continuous innovation and severe safety standards in the automotive sector boost the implementation of sophisticated force sensors.
Force Sensor Market Regional Outlook
North America
- U.S.
- Canada
Europe
- U.K.
- Germany
- France
- Spain
- Rest of Europe
Asia-Pacific
- India
- Japan
- China
- Australia
- South Korea
- Rest of Asia-Pacific
Latin America
- Brazil
- Mexico
- Rest of Latin America
The Middle East & Africa
- South Africa
- GCC Countries
- Rest of the Middle East & Africa (ME&A)

Force Sensor Market Regional Analysis
For several reasons, Asia-Pacific dominates the global force sensor market, with the biggest share in the region. China, Taiwan, South Korea, Japan, and India are the major countries in this area, owing to fast growth in the manufacturing and industrial sectors. India is on forefront for E.V market. For instance, India is on course to become the world's largest EV market by 2030, with increased investment expected over the next 8-10 years. The Indian EV market is expected to grow from $3.21 billion in 2022 to $113.99 billion by 2029, at a CAGR of 66.52% according to India Brand Equity Foundation.
Furthermore, the United States and Canada are the major countries in North America, which is predicted to be a significant growing region. However, the rapid growth of manufacturing infrastructure in the region is likely to stimulate the force sensor throughout the next decade.
Force Sensor Market Players
Some of the top force sensor companies offered in our report include Dytran Instruments, Inc., HITEC Sensor Developments, Inc., Honeywell International Inc., ME-Meßsysteme GmbH, Tekscan, Inc., FUTEK Advanced Sensor Technology, Inc, Sherborne Sensors Ltd., Kistler Group, TE Connectivity Ltd., Lorenz Messtechnik GmbH, and Flintec Group AB.
Frequently Asked Questions
How big is the force sensor market?
The force sensor market size was valued at USD 3.1 billion in 2023.
What is the CAGR of the global force sensor market from 2024 to 2032?
The CAGR of force sensor is 5.3% during the analysis period of 2024 to 2032.
Which are the key players in the force sensor market?
The key players operating in the global market are including Dytran Instruments, Inc., HITEC Sensor Developments, Inc., Honeywell International Inc., ME-Meßsysteme GmbH, Tekscan, Inc., FUTEK Advanced Sensor Technology, Inc, Sherborne Sensors Ltd., Kistler Group, TE Connectivity Ltd., Lorenz Messtechnik GmbH, Flintec Group AB, and among others.
Which region dominated the global force sensor market share?
Asia-Pacific held the dominating position in force sensor industry during the analysis period of 2024 to 2032.
Which region registered fastest CAGR from 2024 to 2032?
Asia-Pacific region exhibited fastest growing CAGR for market of force sensor during the analysis period of 2024 to 2032.
What are the current trends and dynamics in the global force sensor industry?
The current trends and dynamics in the force sensor industry include increasing demand for automation and robotics in various industries, growing need for precision measurement in aerospace and automotive sectors, and rising adoption of force sensors in consumer electronics and wearable devices.
Which operation held the maximum share in 2023?
The analog operation held the maximum share of the force sensor industry.


