Floating Wind Power Market Size - Global Industry, Share, Analysis, Trends and Forecast 2022 - 2030
Published :
Report ID:
Pages :
Format :
Floating Wind Power Market Size - Global Industry, Share, Analysis, Trends and Forecast 2022 - 2030
Report Coverage
- Industry Dynamics
- Market Size and Forecast Data
- Segment Analysis
- Competitive Landscape
- Regional Analysis with a Niche Focus on Country-Level Data
- High Level Analysis - Porter's, PESTEL, Value Chain, etc.
- Company Profiles of Key Players
- Option to Customize the Report As Per Your Specific Need
Request Sample Report
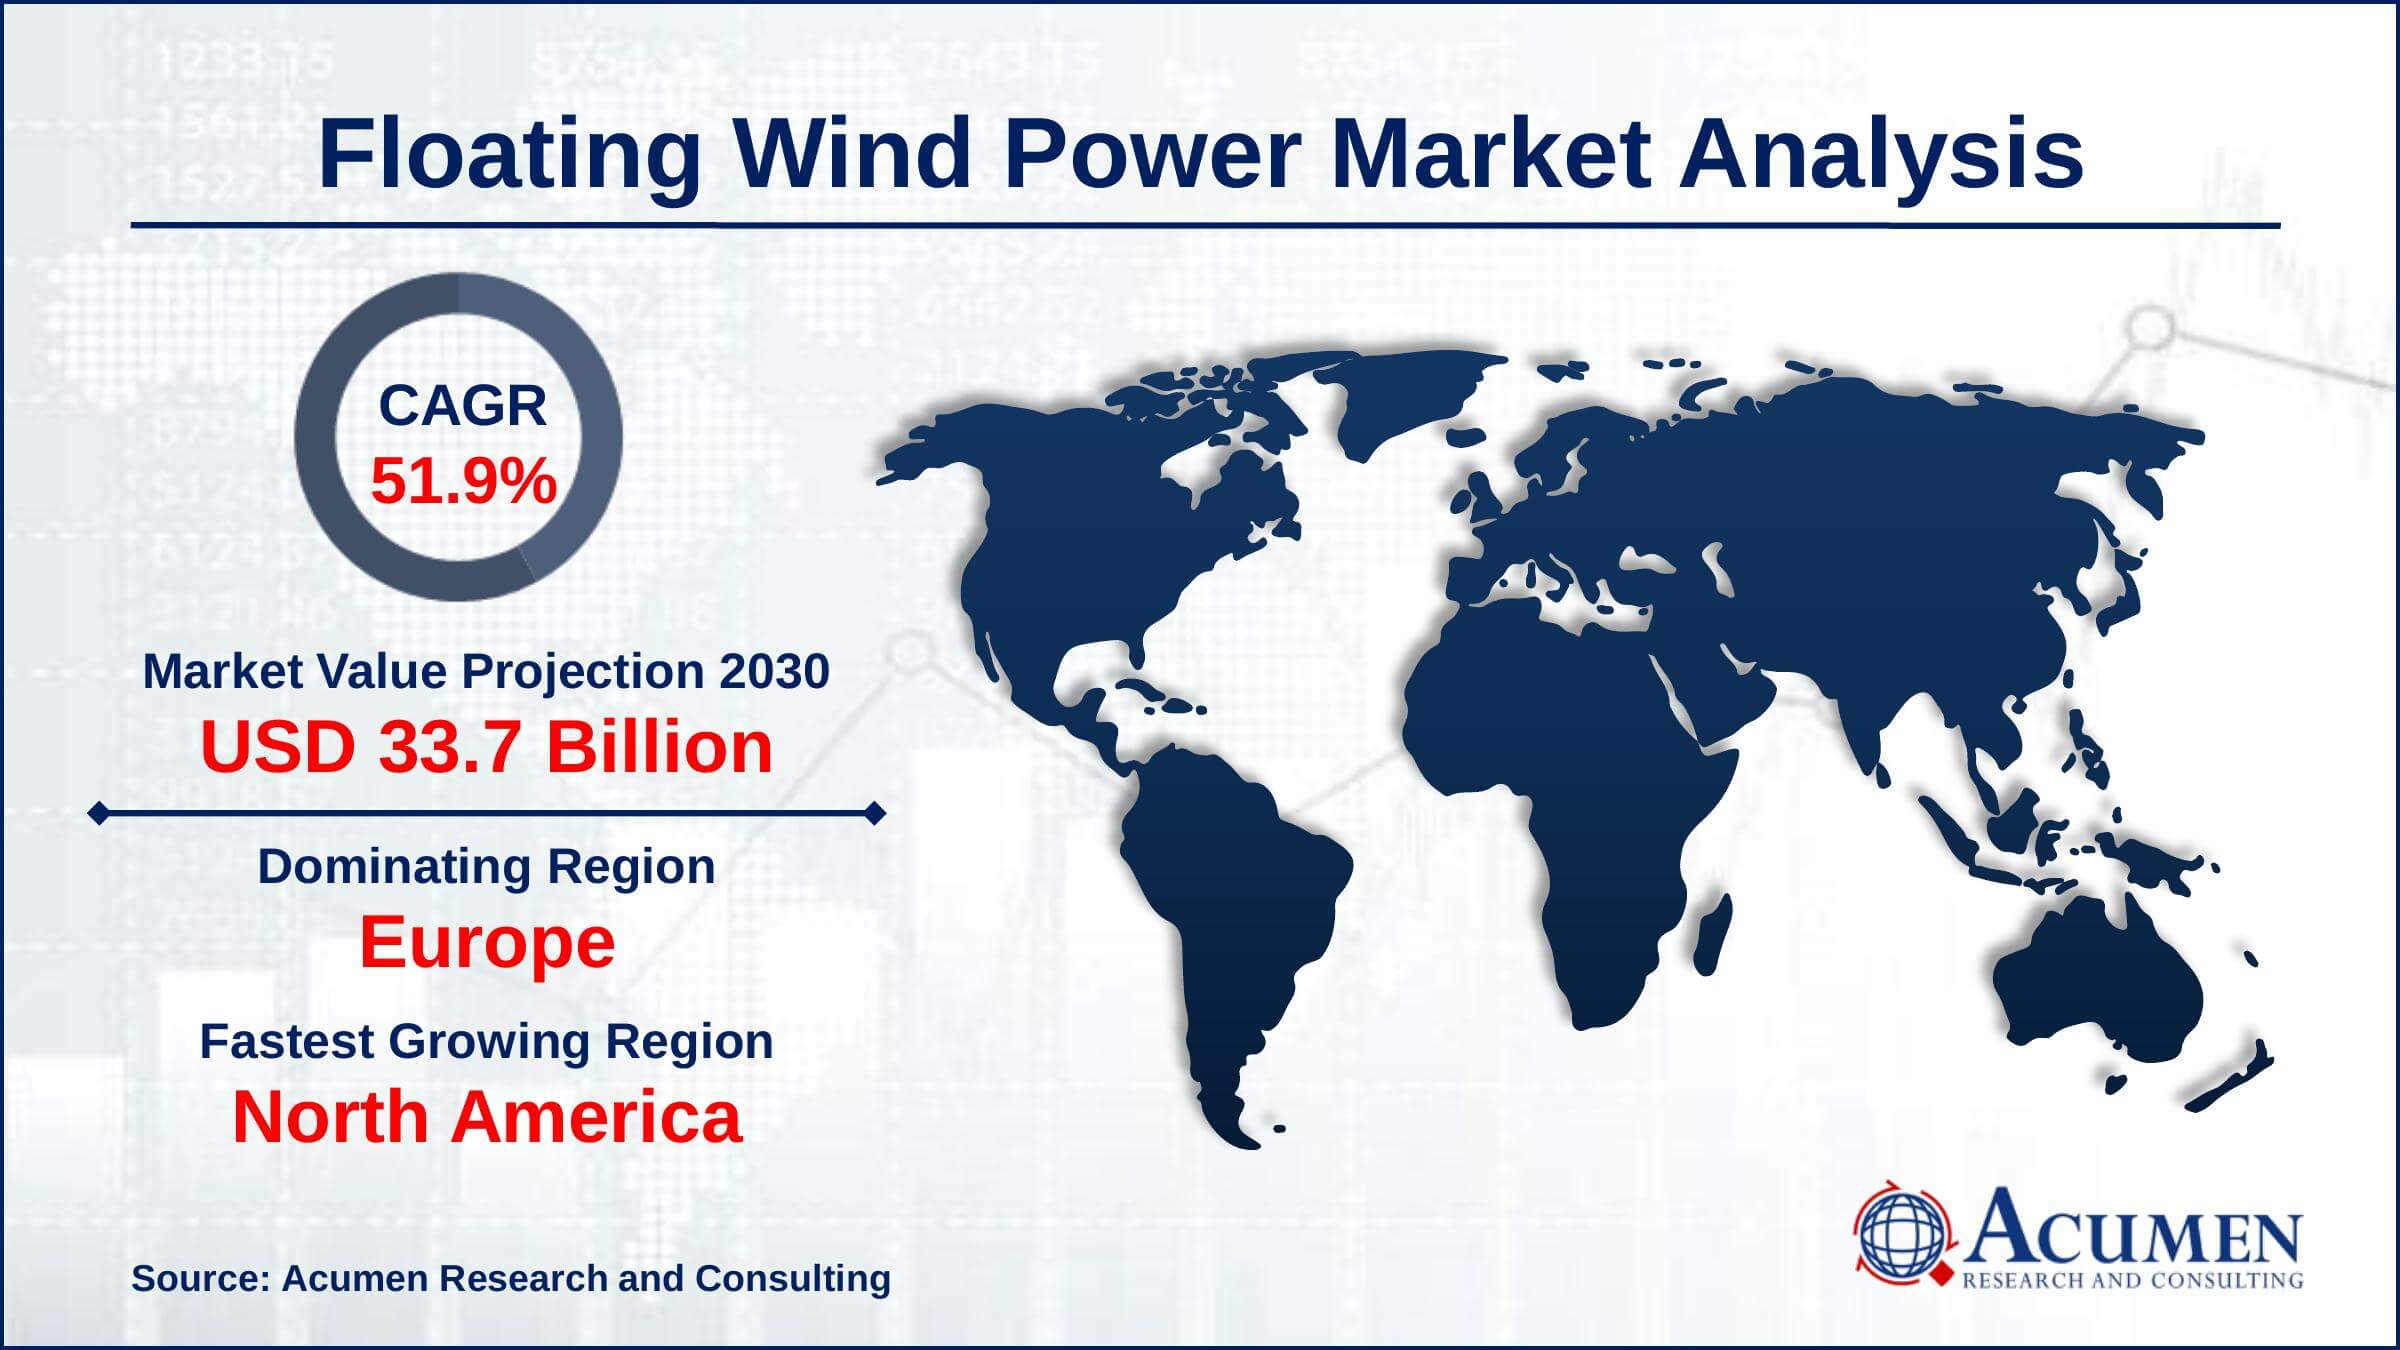
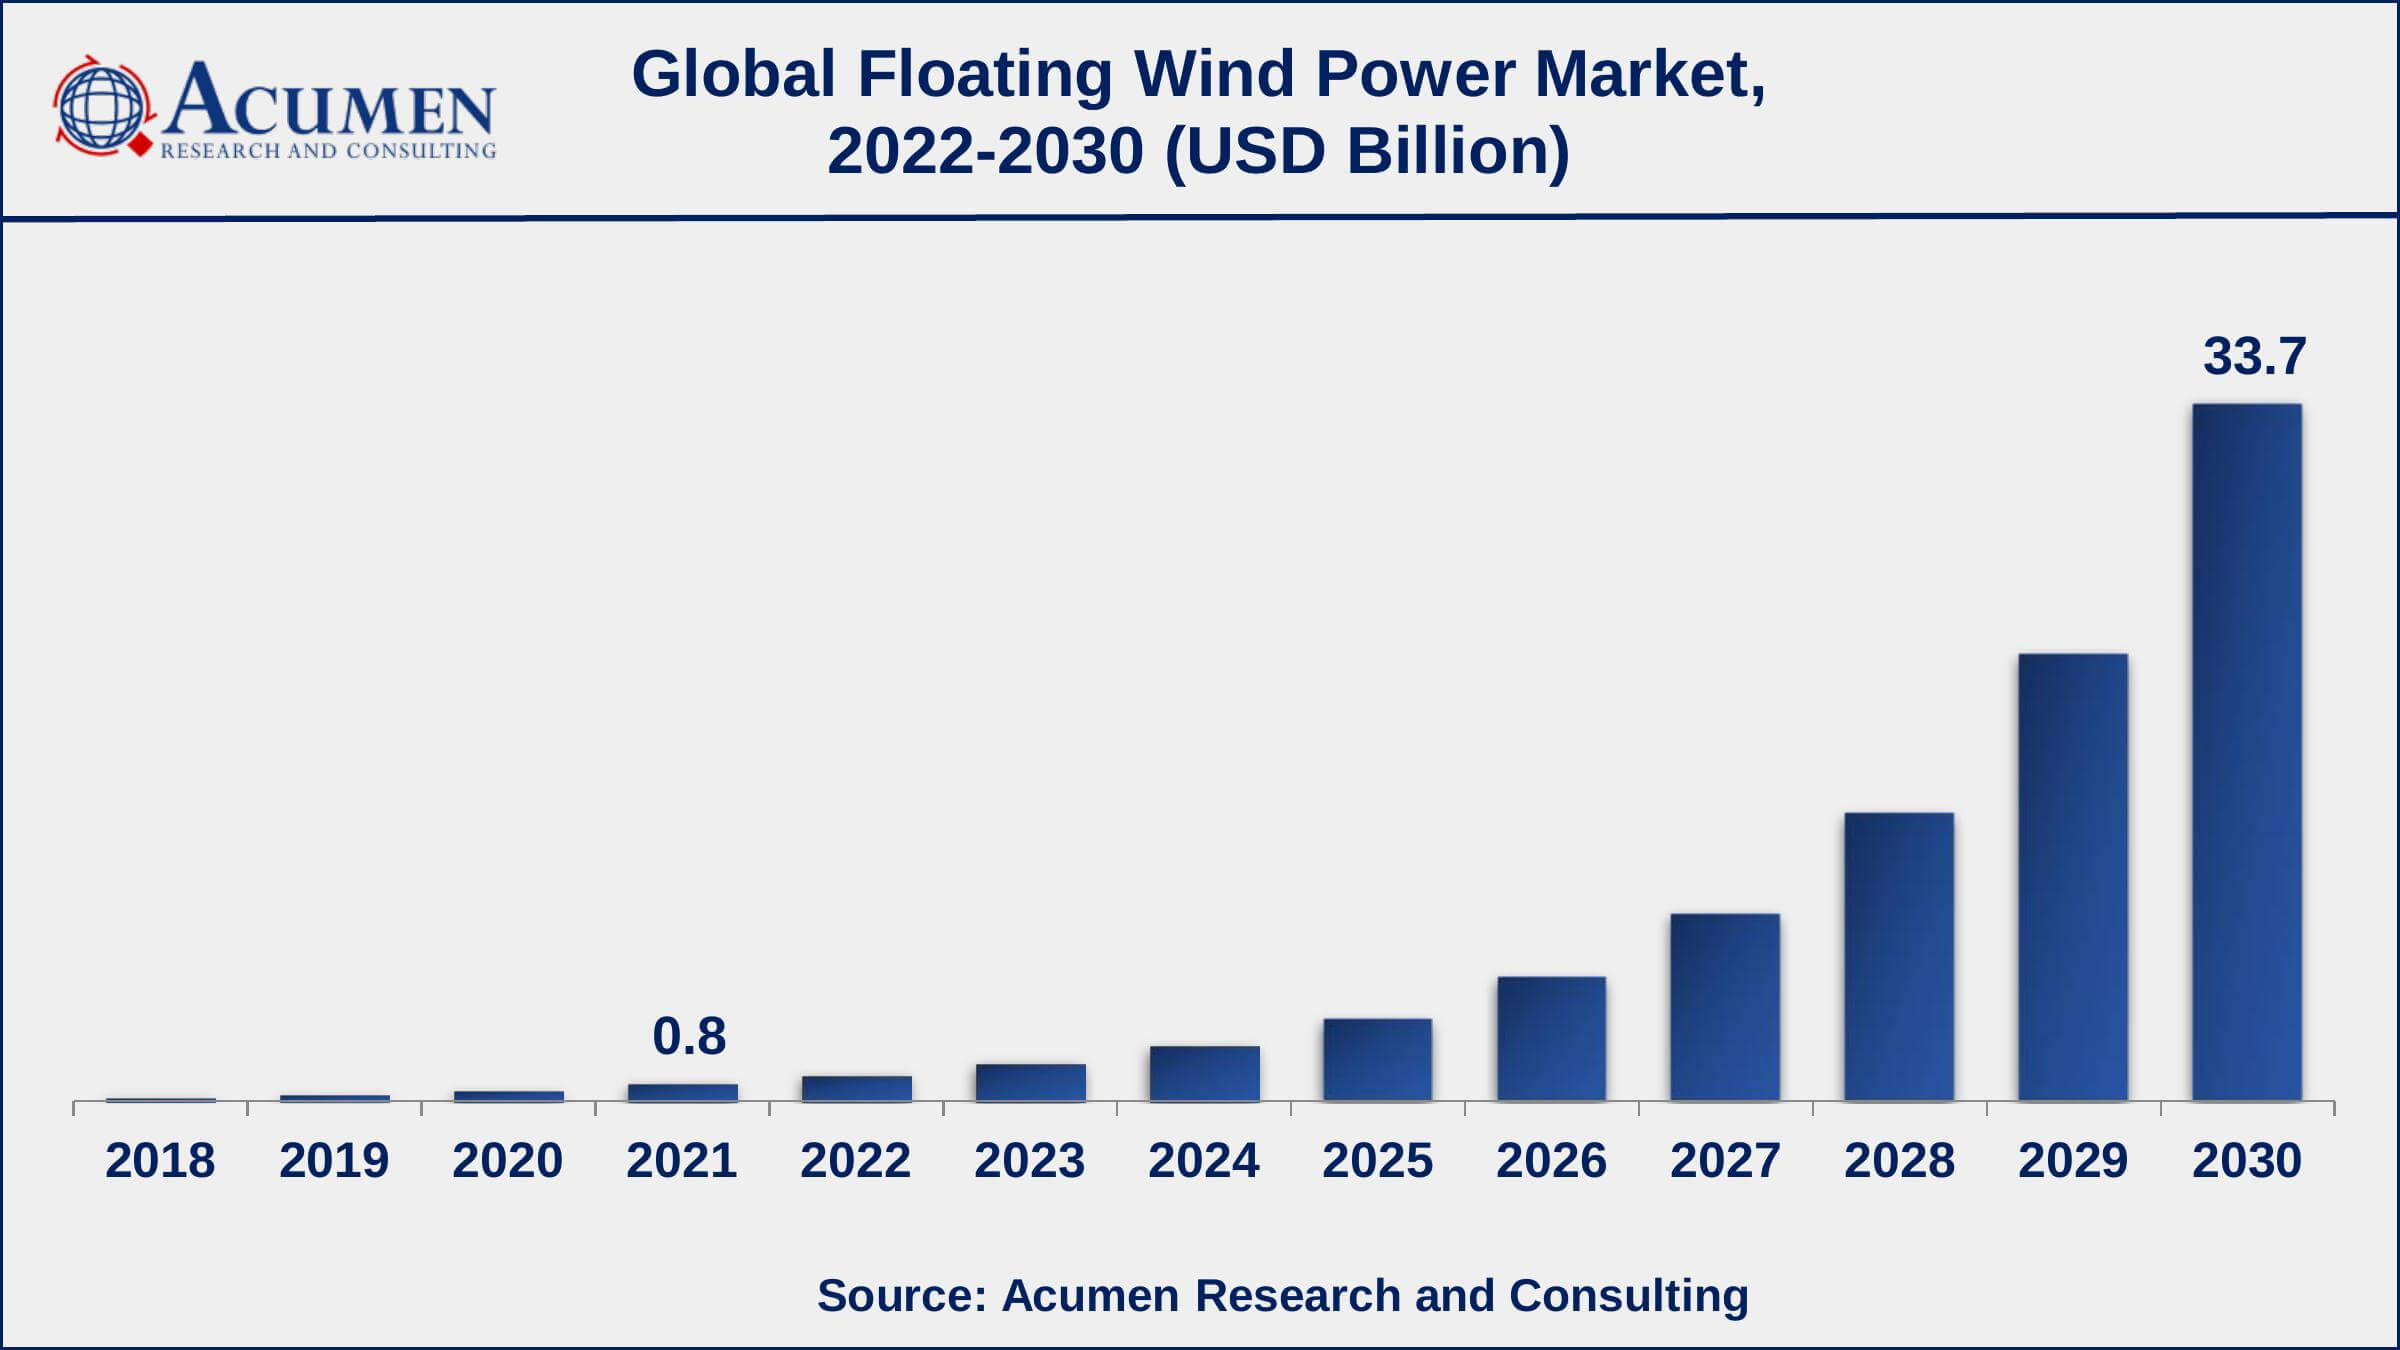
The Global Floating Wind Power Market Size accounted for USD 0.8 Billion in 2021 and is projected to occupy a market size of USD 33.7 Billion by 2030 growing at a CAGR of 51.9% from 2022 to 2030.
Floating wind power is the next big breakthrough in renewable energy generation. Floating offshore wind energy is a renewable and clean energy source that is generated by harnessing the power of the wind offshore. A floating offshore wind platform (FOWP) is a floating structure that allows wind turbines to be deployed in larger, deeper offshore areas with greater wind potential. When compared to other energy sources, floating wind power has a higher output. This is because offshore wind power can take advantage of strong winds blowing in deeper areas, increasing energy efficiency. The global goal of achieving net zero emissions will spur new investment in the floating wind power market.
Floating Wind Power Market Report Statistics
- Global floating wind power market revenue is projected to reach USD 33.7 Billion by 2030 with a CAGR of 51.9% from 2022 to 2030
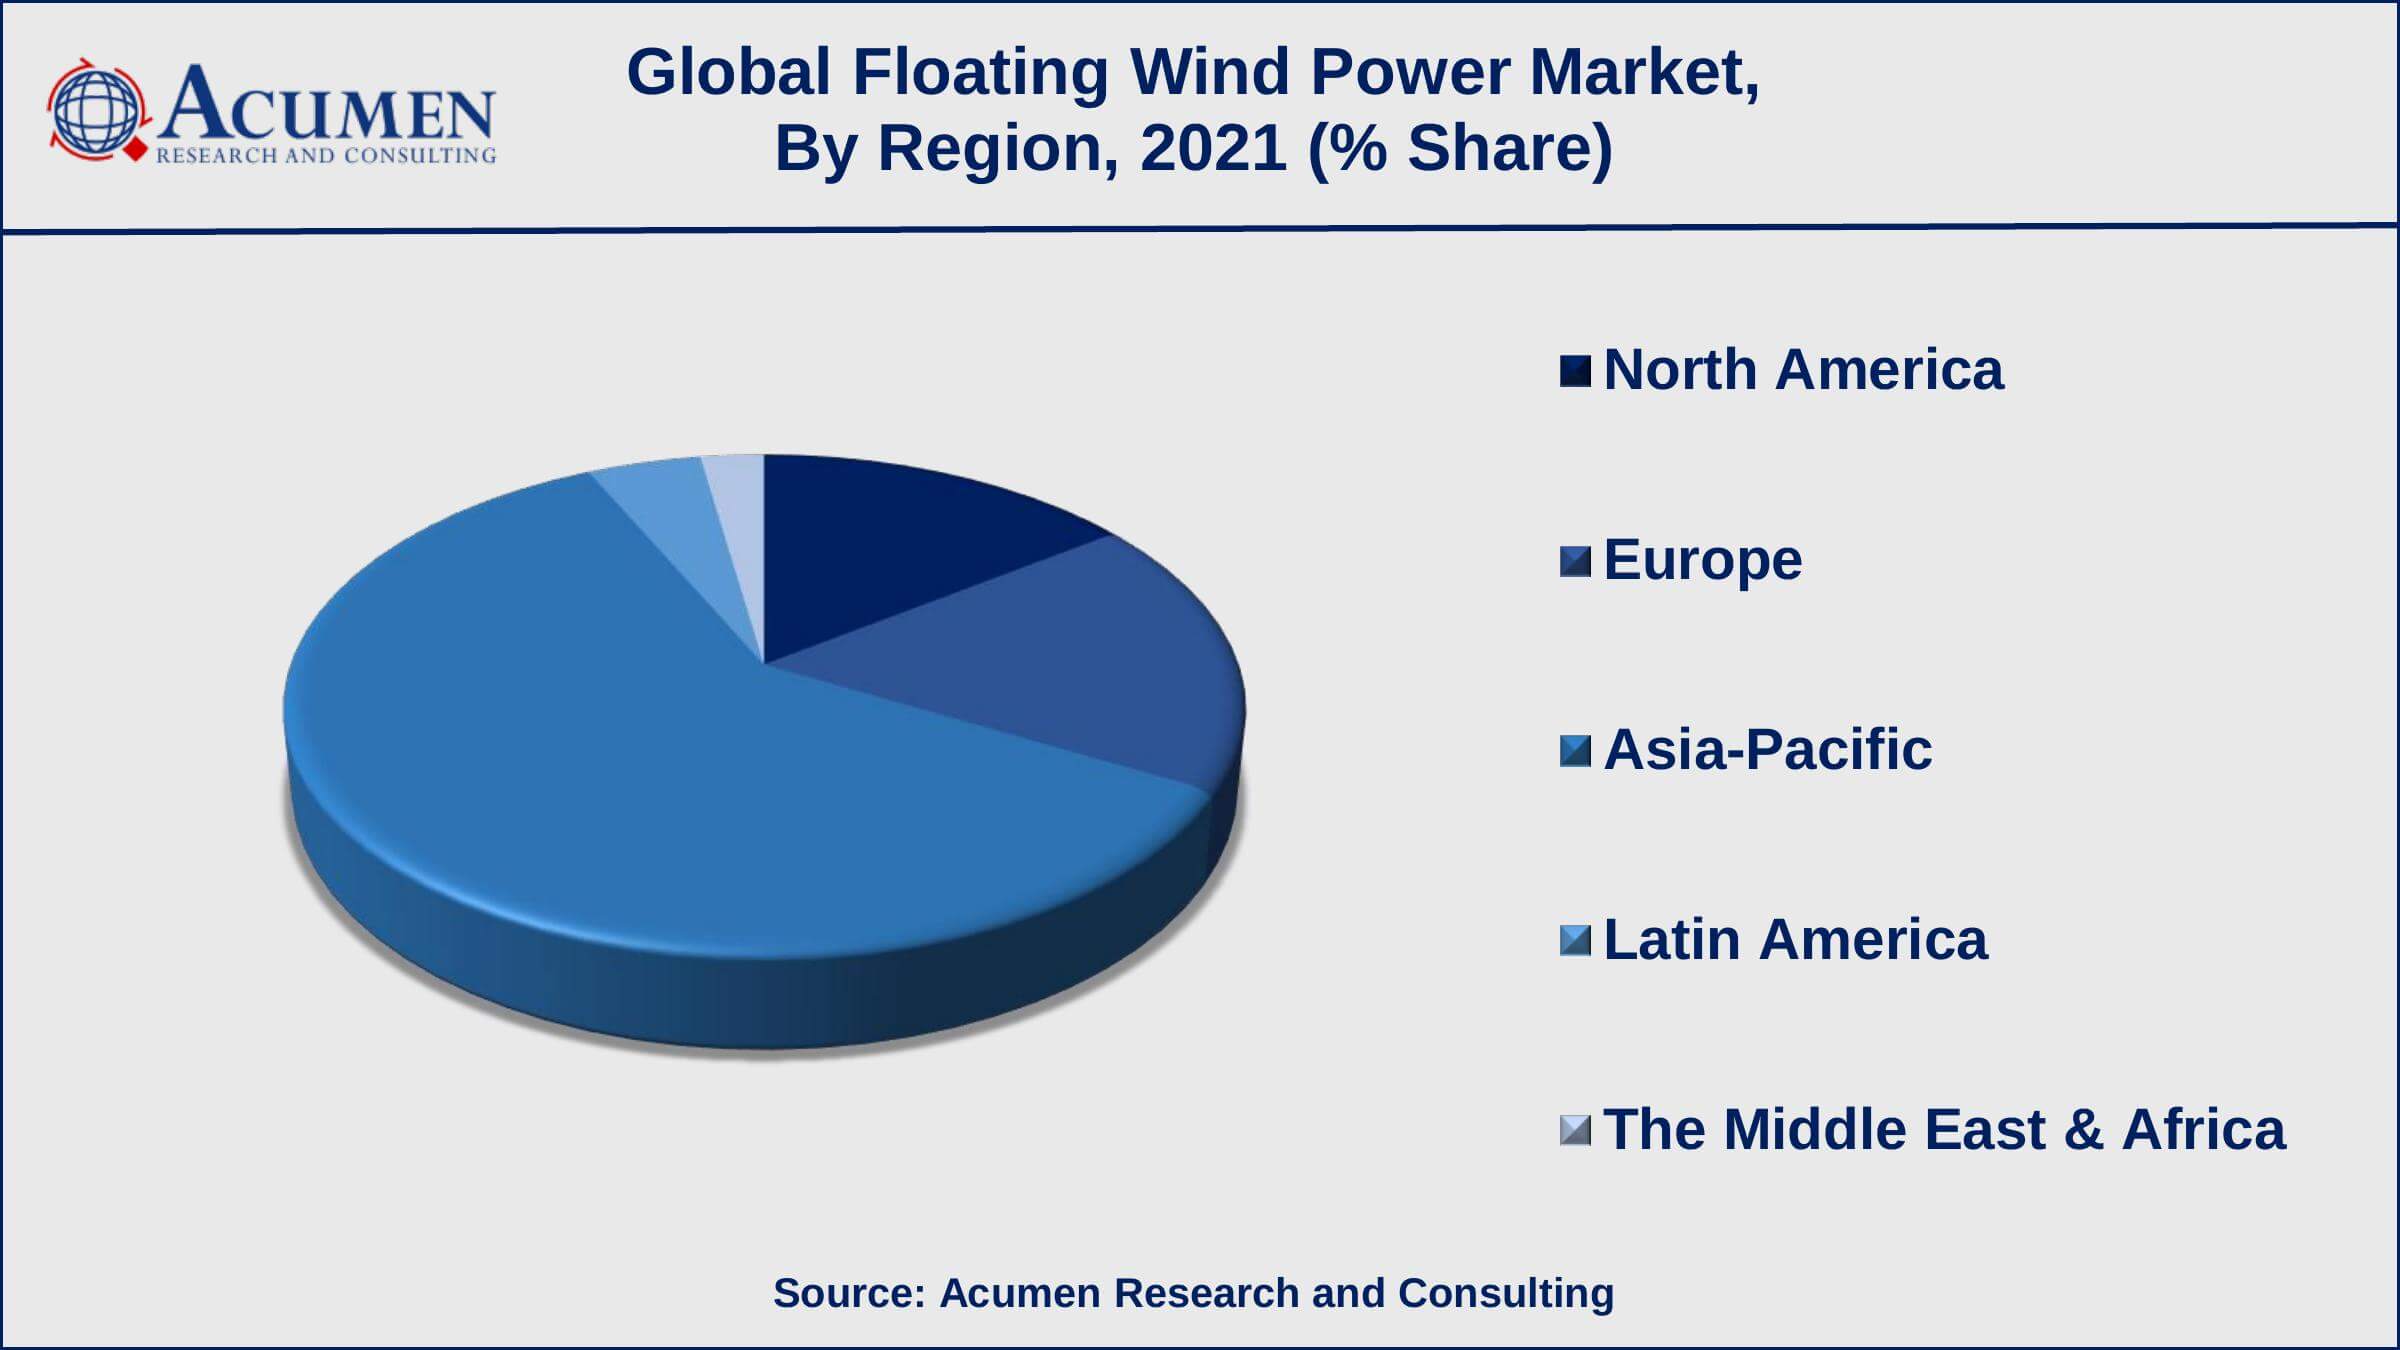
- Europe floating wind power market share generated over US$ 486 million revenue in 2021
- As per the European Government Statistics, the region set to target 450GW of offshore wind by 2050
- Asia-Pacific floating wind power market growth will record noteworthy CAGR from 2022 to 2030
- Based on water depth, the deep water sub-segment achieved USD 445.5 million revenue in 2021
- Among turbine capacity, the above 5MW sub-segment generated revenue of USD 688.5 million in 2021
- The increasing investment in floating offshore wind energy is a prominent floating wind power market trend that drives the industry demand
Global Floating Wind Power Market Dynamics
Market Drivers
- Growing focus on renewable source of energy
- Rising environmental concerns regarding carbon emission
- Higher output efficiency as compared to fixed offshore structures
Market Restraints
- High initial investments
- Trouble with maintenance and repairs
Market Opportunities
- Increasing investments in the offshore wind power projects
- Growing emphasis on deep water floating wind power projects
Floating Wind Power Market Report Coverage
| Market | Floating Wind Power Market |
| Floating Wind Power Market Size 2021 | USD 0.8 Billion |
| Floating Wind Power Market Forecast 2030 | USD 33.7 Billion |
| Floating Wind Power Market CAGR During 2022 - 2030 | 51.9% |
| Floating Wind Power Market Analysis Period | 2018 - 2030 |
| Floating Wind Power Market Base Year | 2021 |
| Floating Wind Power Market Forecast Data | 2022 - 2030 |
| Segments Covered | By Water Depth, By Turbine Capacity, And By Geography |
| Regional Scope | North America, Europe, Asia Pacific, Latin America, and Middle East & Africa |
| Key Companies Profiled | Doosan Heavy Industries and Construction, Equinor, General Electric, Goldwind, Hitachi, Nordex SE, Rockwell Automation, Schneider Electric, Shanghai Electric Wind Power Equipment Co., Siemens Gamesa, Suzlon Energy Limited, Taiyuan Heavy Industry Co, and Vestas. |
| Report Coverage |
Market Trends, Drivers, Restraints, Competitive Analysis, Player Profiling, Regulation Analysis |
Floating Wind Power Market Growth Factors
The growing number of floating offshore wind energy projects is a key factor boosting the global floating wind power market growth. For instance, according to the U.S. Department of Energy, the National Renewable Energy Laboratory declared the launch of the Floating Offshore Wind Array Design project, which will build a set of modeling tools to enhance designs for hovering offshore wind farm arrays. This project will also help in numerous benchmarks array designs for Americas floating off-shore wind farm locations. The above project is funded by the Bipartisan Infrastructure Law and will last three years.
The rising focus on reducing carbon emissions from the world is another factor that is propelling the floating wind power market share. As per the U.S. Environment Protection Agency (EPA), the total U.S. greenhouse gas emissions were equal to 5,981 Million Metric Tons of CO2 equivalent. This noteworthy generation was driven by the higher energy demand growing over the past couple of years. While emissions from all fossil fuels increased, nearly two-thirds of the increase was attributed to the power sector. Coal use in power generation alone exceeded 10 Gt CO2, primarily in Asia. The United States, China, and India accounted for 85% of the net increase in emissions. As a result, many governments have shifted their focus towards green and clean energy generation solutions, thereby driving the floating wind power market size.
However, the market is constrained by factors such as high installation cost and trouble with maintenance and repair of the floating offshore wind equipment. Furthermore, rising investments in the offshore wind power projects will significantly drive the market demand. Key players across the world have been collaborating with their respective government organizations and planning on starting new floating wind power projects. For example, a design methodology and solutions that can be used with floating wind concepts have been developed by Equinor, allowing for increased regional relevance and industry standardization.
Key Investments of Offshore Wind Power Projects
- China intends to break its record by building a new offshore wind farm capable of producing over 43.3 GW of power and powering over 13 million homes by 2025.
- Then again, the Indian government, for example, recently planned to invest up to USD 30 billion in an offshore wind energy project that will generate 25 gigatonnes (GW) of clean wind energy.
- The US Department of Energy's (DOE) Wind Energy Technologies Office (WETO) today announced a $28 million funding opportunity to reduce costs and address barriers to wind energy deployment in all applications—offshore, land-based, and distributed.

Floating Wind Power Market Segmentation
The global floating wind power market is segmented based on water depth, turbine capacity, and geography.
Floating Wind Power Market By Water Depth
- Deep Water
- Shallow Water
- Transitional Water
As per the floating wind power industry analysis, the deep water sub-segment gathered the maximum percentage of share in 2021 and is expected to do so in the coming years. Installing deep-water floating wind farms offers obstruction-free wind paths, gives maximum output, and gives less visual impact. Then again, the deep water floating wind platforms can generate more energy and offer the freedom to install much bigger turbines.
Floating Wind Power Market By Turbine Capacity
- Up to 3MW
- 3MW - 5 MW
- Above 5 MW
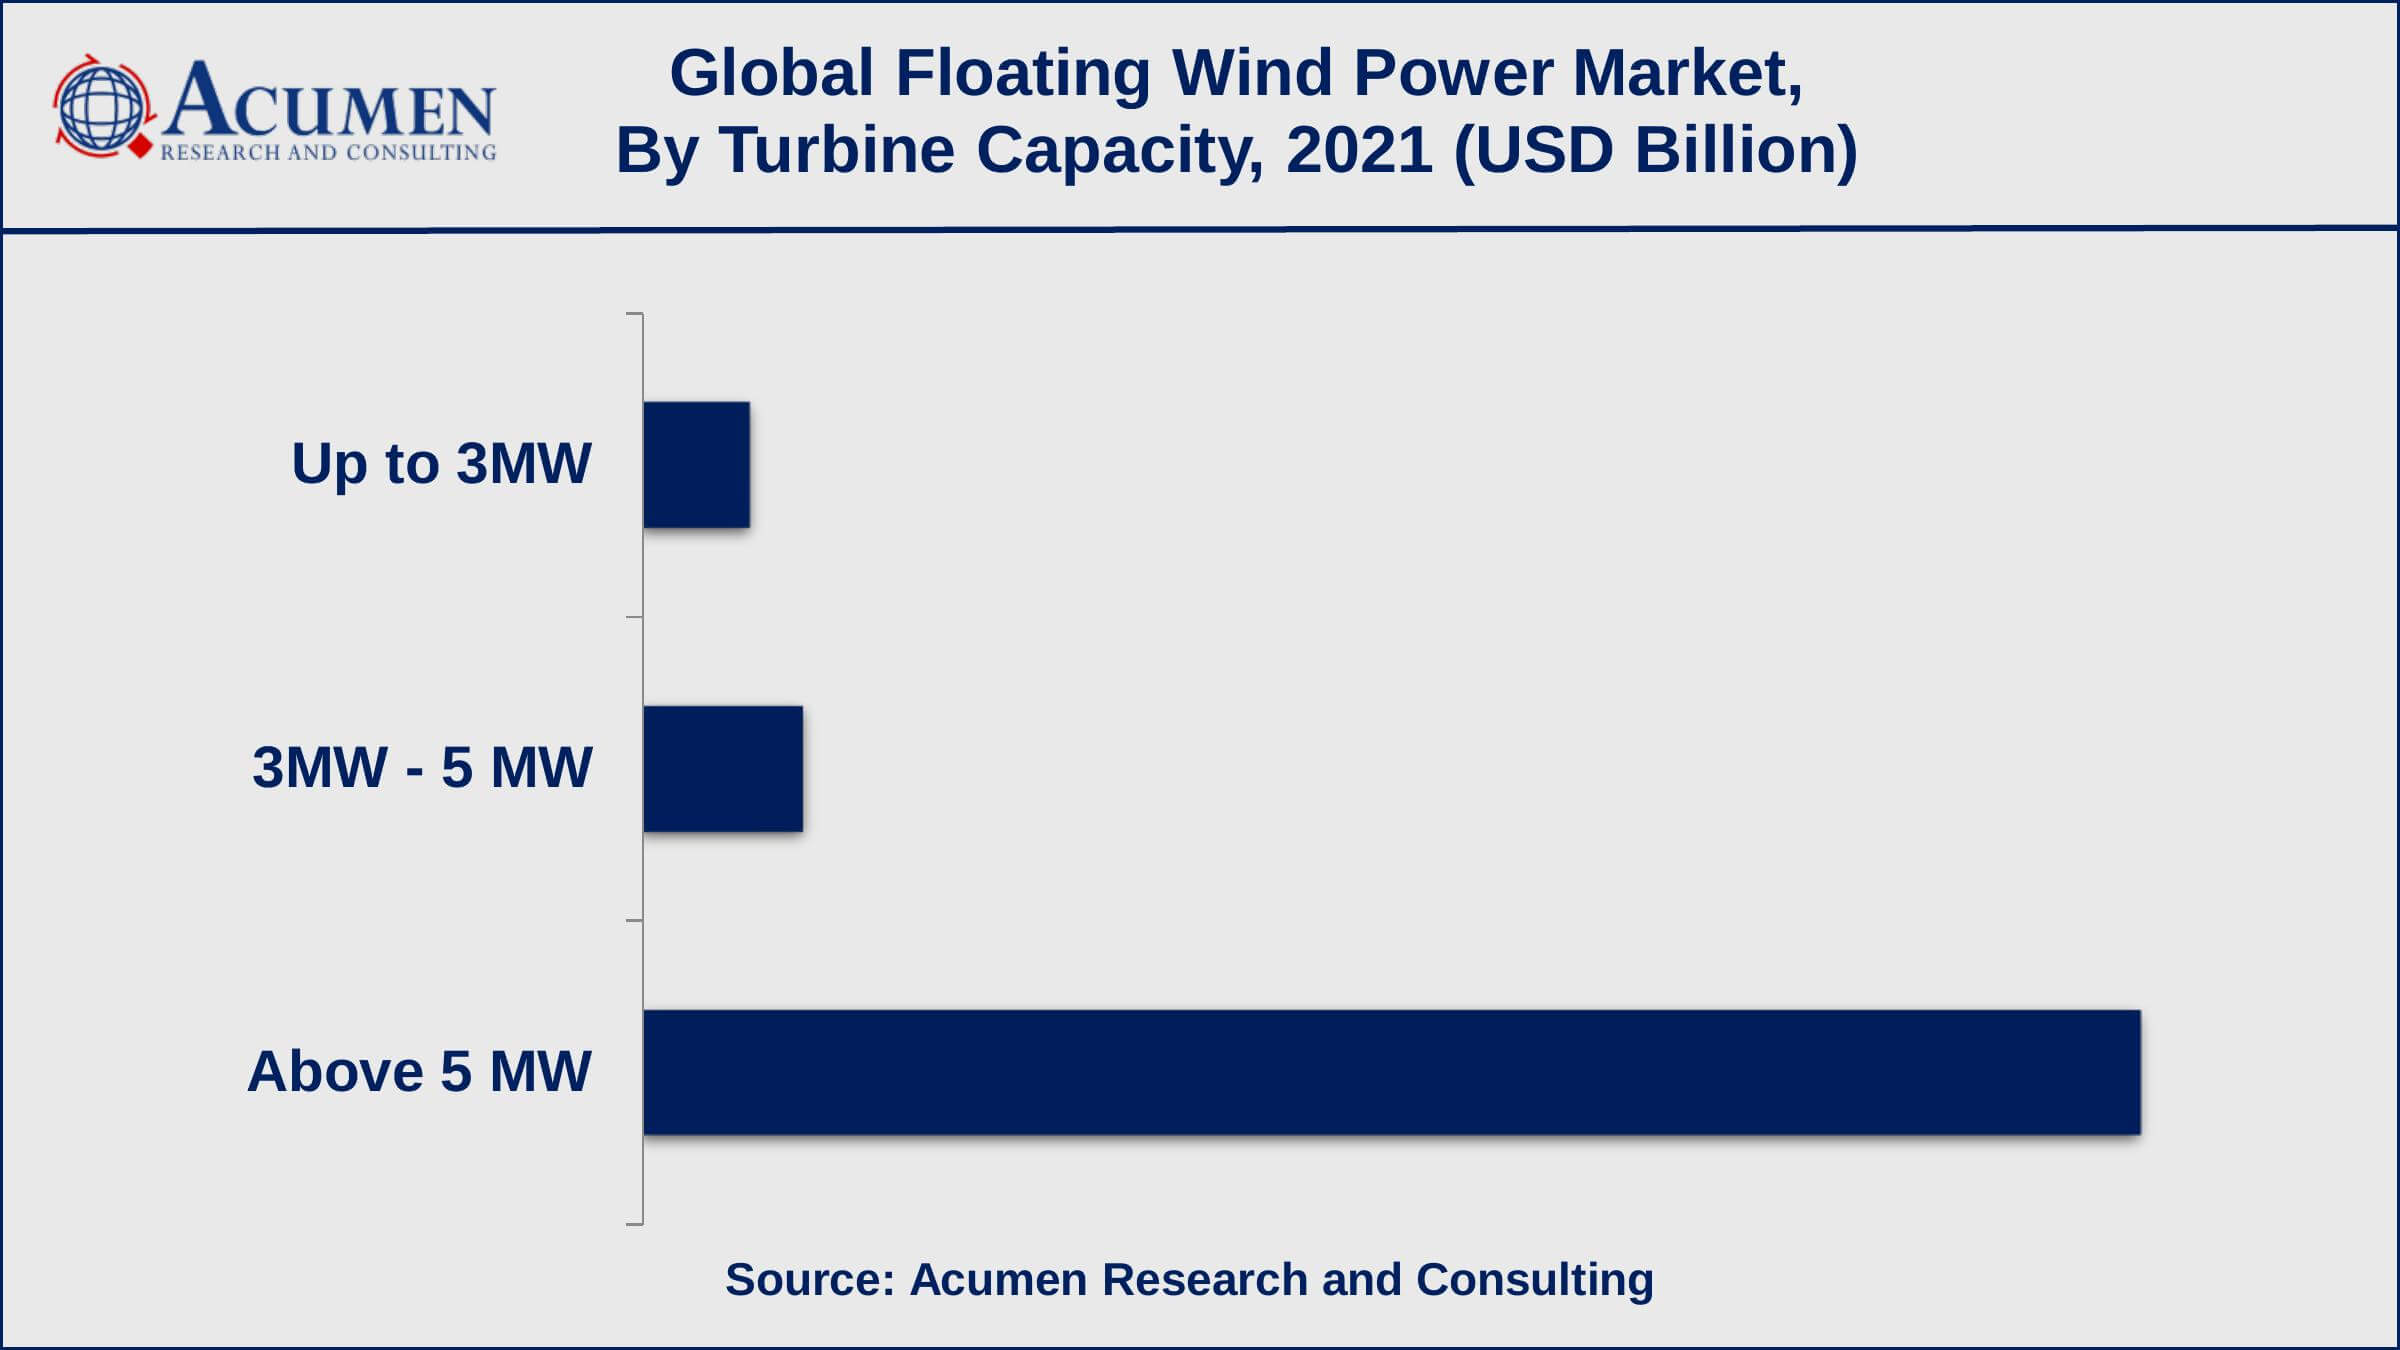
According to our floating wind power market forecast, the above 5W turbine capacity sub-segment is anticipated to record a significant market share from 2022 to 2030. The rising demand for energy, increasing urbanization and capitalization, and growing focus towards high yield of power are the key factors that have rose numerous investments in above 5 megawatts of turbine capacity.
Floating Wind Power Market Regional Outlook
North America
- U.S.
- Canada
Europe
- U.K.
- Germany
- France
- Spain
- Rest of Europe
Asia-Pacific
- India
- Japan
- China
- Australia
- South Korea
- Rest of Asia-Pacific
Latin America
- Brazil
- Mexico
- Rest of Latin America
The Middle East & Africa
- South Africa
- GCC Countries
- Rest of the Middle East & Africa (ME&A)
Floating Wind Power Market Regional Analysis
In 2021, Europe generated the largest revenue in the overall floating wind power market. The presence of strict regulations for carbon emission and rising investment in various offshore wind power projects across European countries are some of the factors that are fueling the European floating wind power market growth. On the other hand, Asia-Pacific region is likely to attain a significant growth rate (CAGR) during the forecasted timeframe from 2022 to 2030. The upcoming floating wind power projects in countries like China, India, Japan, South Korea etc will favor the Asia-Pacific market growth.
Floating Wind Power Market Players
Some of the leading floating wind power companies include Doosan Heavy Industries and Construction, Equinor, General Electric, Goldwind, Hitachi, Nordex SE, Rockwell Automation, Schneider Electric, Shanghai Electric Wind Power Equipment Co., Siemens Gamesa, Suzlon Energy Limited, Taiyuan Heavy Industry Co, and Vestas.
Frequently Asked Questions
What is the size of global floating wind power market in 2021?
The market size of floating wind power market in 2021 was accounted to be USD 0.8 Billion.
What is the CAGR of global floating wind power market during forecast period of 2022 to 2030?
The projected CAGR of floating wind power market during the analysis period of 2022 to 2030 is 51.9%.
Which are the key players operating in the market?
The prominent players of the global floating wind power market include Doosan Heavy Industries and Construction, Equinor, General Electric, Goldwind, Hitachi, Nordex SE, Rockwell Automation, Schneider Electric, Shanghai Electric Wind Power Equipment Co., Siemens Gamesa, Suzlon Energy Limited, Taiyuan Heavy Industry Co, and Vestas.
Which region held the dominating position in the global floating wind power market?
Europe held the dominating floating wind power during the analysis period of 2022 to 2030.
Which region registered the fastest growing CAGR for the forecast period of 2022 to 2030?
Asia-Pacific region exhibited fastest growing CAGR for floating wind power during the analysis period of 2022 to 2030.
What are the current trends and dynamics in the global floating wind power market?
Growing focus on renewable source of energy, rising environmental concerns regarding carbon emission, and higher output efficiency as compared to fixed offshore structures drives the growth of global floating wind power market.
Which water-depth held the maximum share in 2021?
Based on water-depth, deep water segment is expected to hold the maximum share of the floating wind power market.


