Engineered Stone Market Analysis - Global Industry Size, Share, Trends and Forecast 2022 - 2030
Published :
Report ID:
Pages :
Format :
Engineered Stone Market Analysis - Global Industry Size, Share, Trends and Forecast 2022 - 2030
Report Coverage
- Industry Dynamics
- Market Size and Forecast Data
- Segment Analysis
- Competitive Landscape
- Regional Analysis with a Niche Focus on Country-Level Data
- High Level Analysis - Porter's, PESTEL, Value Chain, etc.
- Company Profiles of Key Players
- Option to Customize the Report As Per Your Specific Need
Request Sample Report
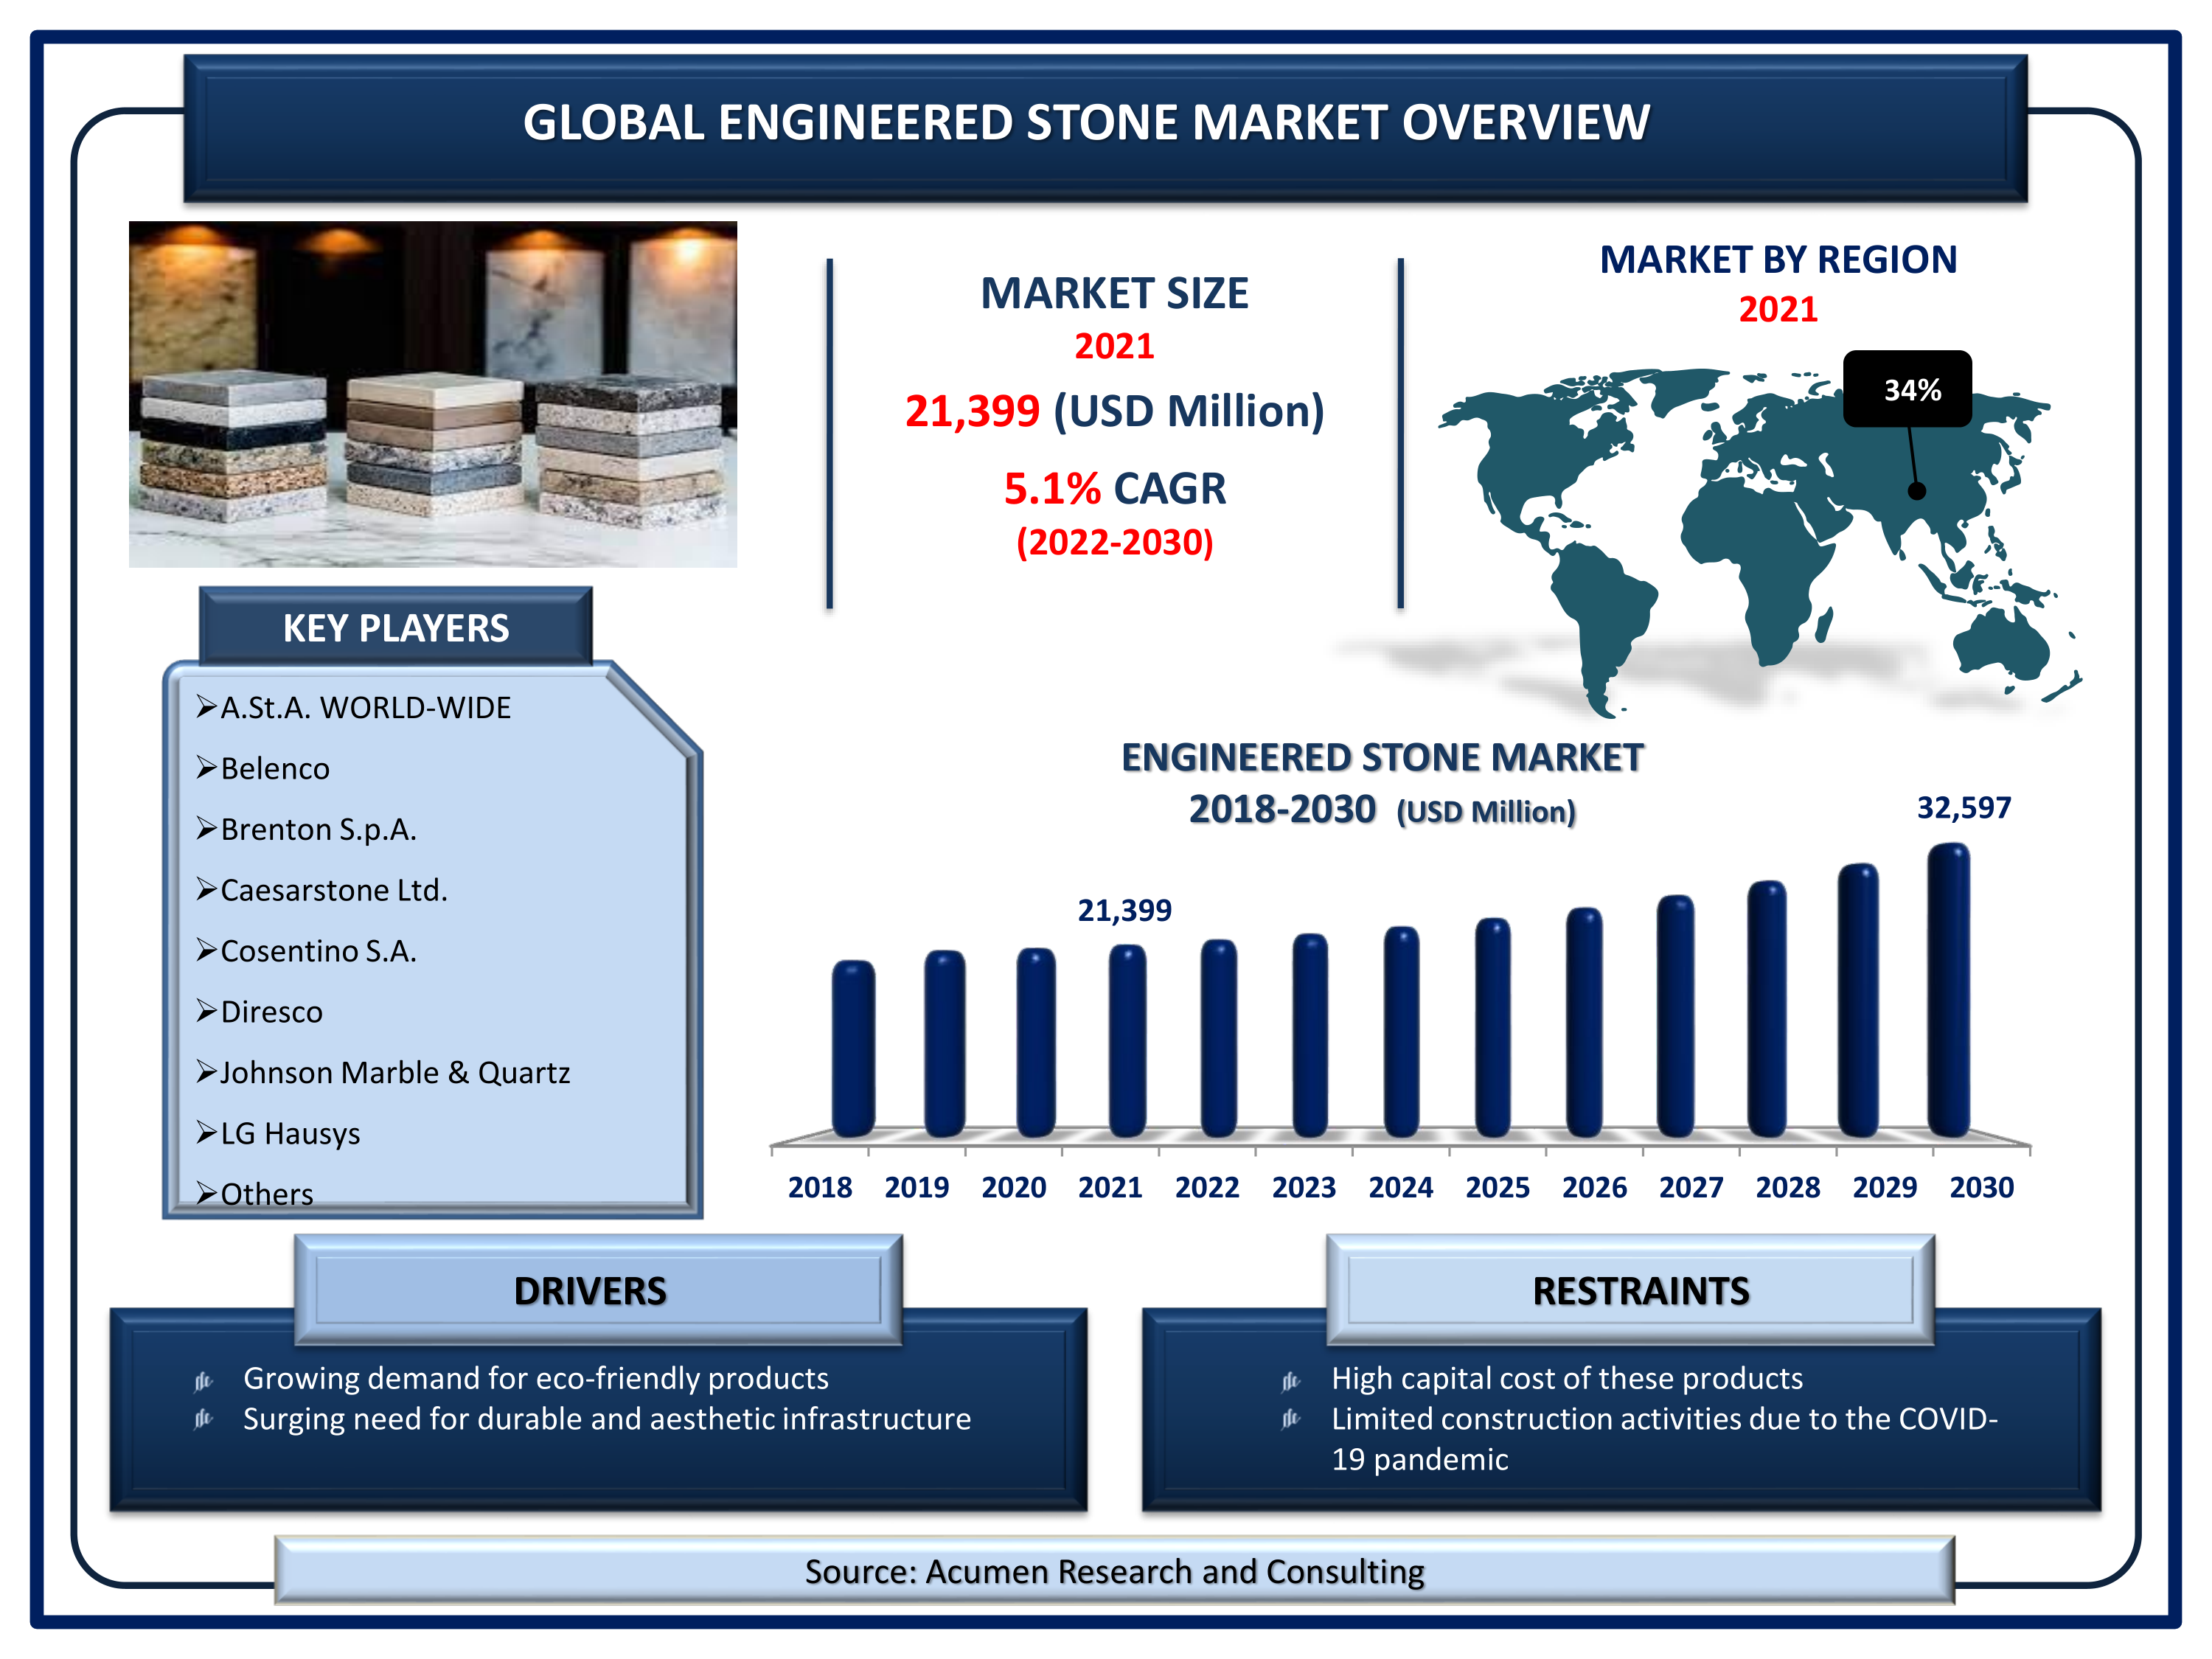
The Global Engineered Stone Market size accounted for USD 21,399 Mn in 2021 and is projected to reach USD 32,597 Mn by 2030, growing at a CAGR of 5.1%

According to our worldwide engineered stone industry analysis, the increased preference for aesthetic and attractive infrastructure is one of the top trends in the market. Another prominent trend in engineered stone market is the growing demand for fancy countertops that is fueling the industry demand. Engineered stone is a composite material composed of crushed stone held together by some type of adhesive. The appearance of engineered stone is similar to that of natural stone. The only distinction is that engineered stone has a more consistent pattern and color throughout. Engineered or a composite stone has numerous applications in a variety of industries. Slabs for kitchen countertops are made of quartz crystals that are bonded together with the support of a resin-binding material. The majority of quartz is made with a composition that is roughly 93% crushed stone and 7% pigment and resin. Because engineered marble or quartz is created artificially, each marble slab will have a nearly identical appearance.
Global Engineered Stone Market DRO’s:
Market Drivers:
- Growing demand for eco-friendly products
- Rapid urbanization and expansion of offices and workspaces
- Huge demand from the significantly growing residential sector
- Surging need for durable and aesthetic infrastructure
Market Restraints:
- Lack of awareness and high capital cost of these products
- Limited construction activities due to the COVID-19 pandemic
Market Opportunities:
- Continuous rise of the global building and construction sector
- Growing acceptance for recyclable engineered stones
Report Coverage
| Market | Engineered Stone Market |
| Market Size 2021 | USD 21,399 Mn |
| Market Forecast 2030 | USD 32,597 Mn |
| CAGR During 2022 - 2030 | 5.1% |
| Analysis Period | 2018 - 2030 |
| Base Year | 2021 |
| Forecast Data | 2022 - 2030 |
| Segments Covered | By Product, By Process, By Application, and By Geography |
| Regional Scope | North America, Europe, Asia Pacific, Latin America, and Middle East & Africa |
| Key Companies Profiled | A.St.A. WORLD-WIDE, Belenco, Brenton S.p.A., Caesarstone Ltd., Cosentino S.A., Diresco, Johnson Marble & Quartz, LG Hausys, Pokarna Limited, Quarella Group Limited, Quartzforms, Stone Italiana S.p.A., Technistonea.s., and VICOSTONE |
| Report Coverage |
Market Trends, Drivers, Restraints, Competitive Analysis, Player Profiling, Regulation Analysis |
| Customization Scope |
10 hrs of free customization and expert consultation |
Engineered Stone Market Dynamics
Cladding materials such as concrete blocks, clay bricks, vinyl siding, and natural and artificial stones make up the vast majority of the building-facing materials. Natural stone is the preferred building material among these for a variety of reasons, including accessibility, beauty, durability, hardness, strength, and sustainability. However, the difficulty in quarrying, transporting, and cutting natural stone has had an unfavorable impact on project schedules and costs. Thereby, the construction industry has created engineered stone to balance the aesthetic appeal of natural stone with the cost of a project.
The engineered stone market revenue is expanding on account of the rapid urbanization. This has caused the construction of widespread residential and commercial buildings. And due to the consumers increased interest in aesthetic and attractive infrastructure, engineered stones are widely used across all the construction sectors. Because these materials are man-made, they can be fabricated in large sizes, resulting in fewer joints and better aesthetics. Engineered stone market value is significantly growing due to the increasing demand for eco-friendly products. Consumers are increasingly concerned about the environmental impact of their construction and renovation projects. This could imply using reclaimed or recyclable materials as well as low-toxicity paints. Quartz is an engineered stone that has a lower impact on the environment than natural stones.
However, lack of awareness and high capital cost required would hamper the engineered stone market growth. In addition to that, the rapid spread of COVID-19 has also hampered market growth. The impact of COVID-19 on the engineered stone industry was extensively negative as most of the construction and renovation activities halted from mid-2020 to 2021. Furthermore, the growing acceptance of recyclable engineered stones is anticipated to drive the market further in the coming years. Then again, the continuous rise of the building and construction industry will create numerous growth opportunities for the market in the coming years.
Engineered Stone Market Segmentation
The worldwide engineered stone market is split based on product, process, application, and geography.
Market by Product
- Tiles
- Blocks and Slabs

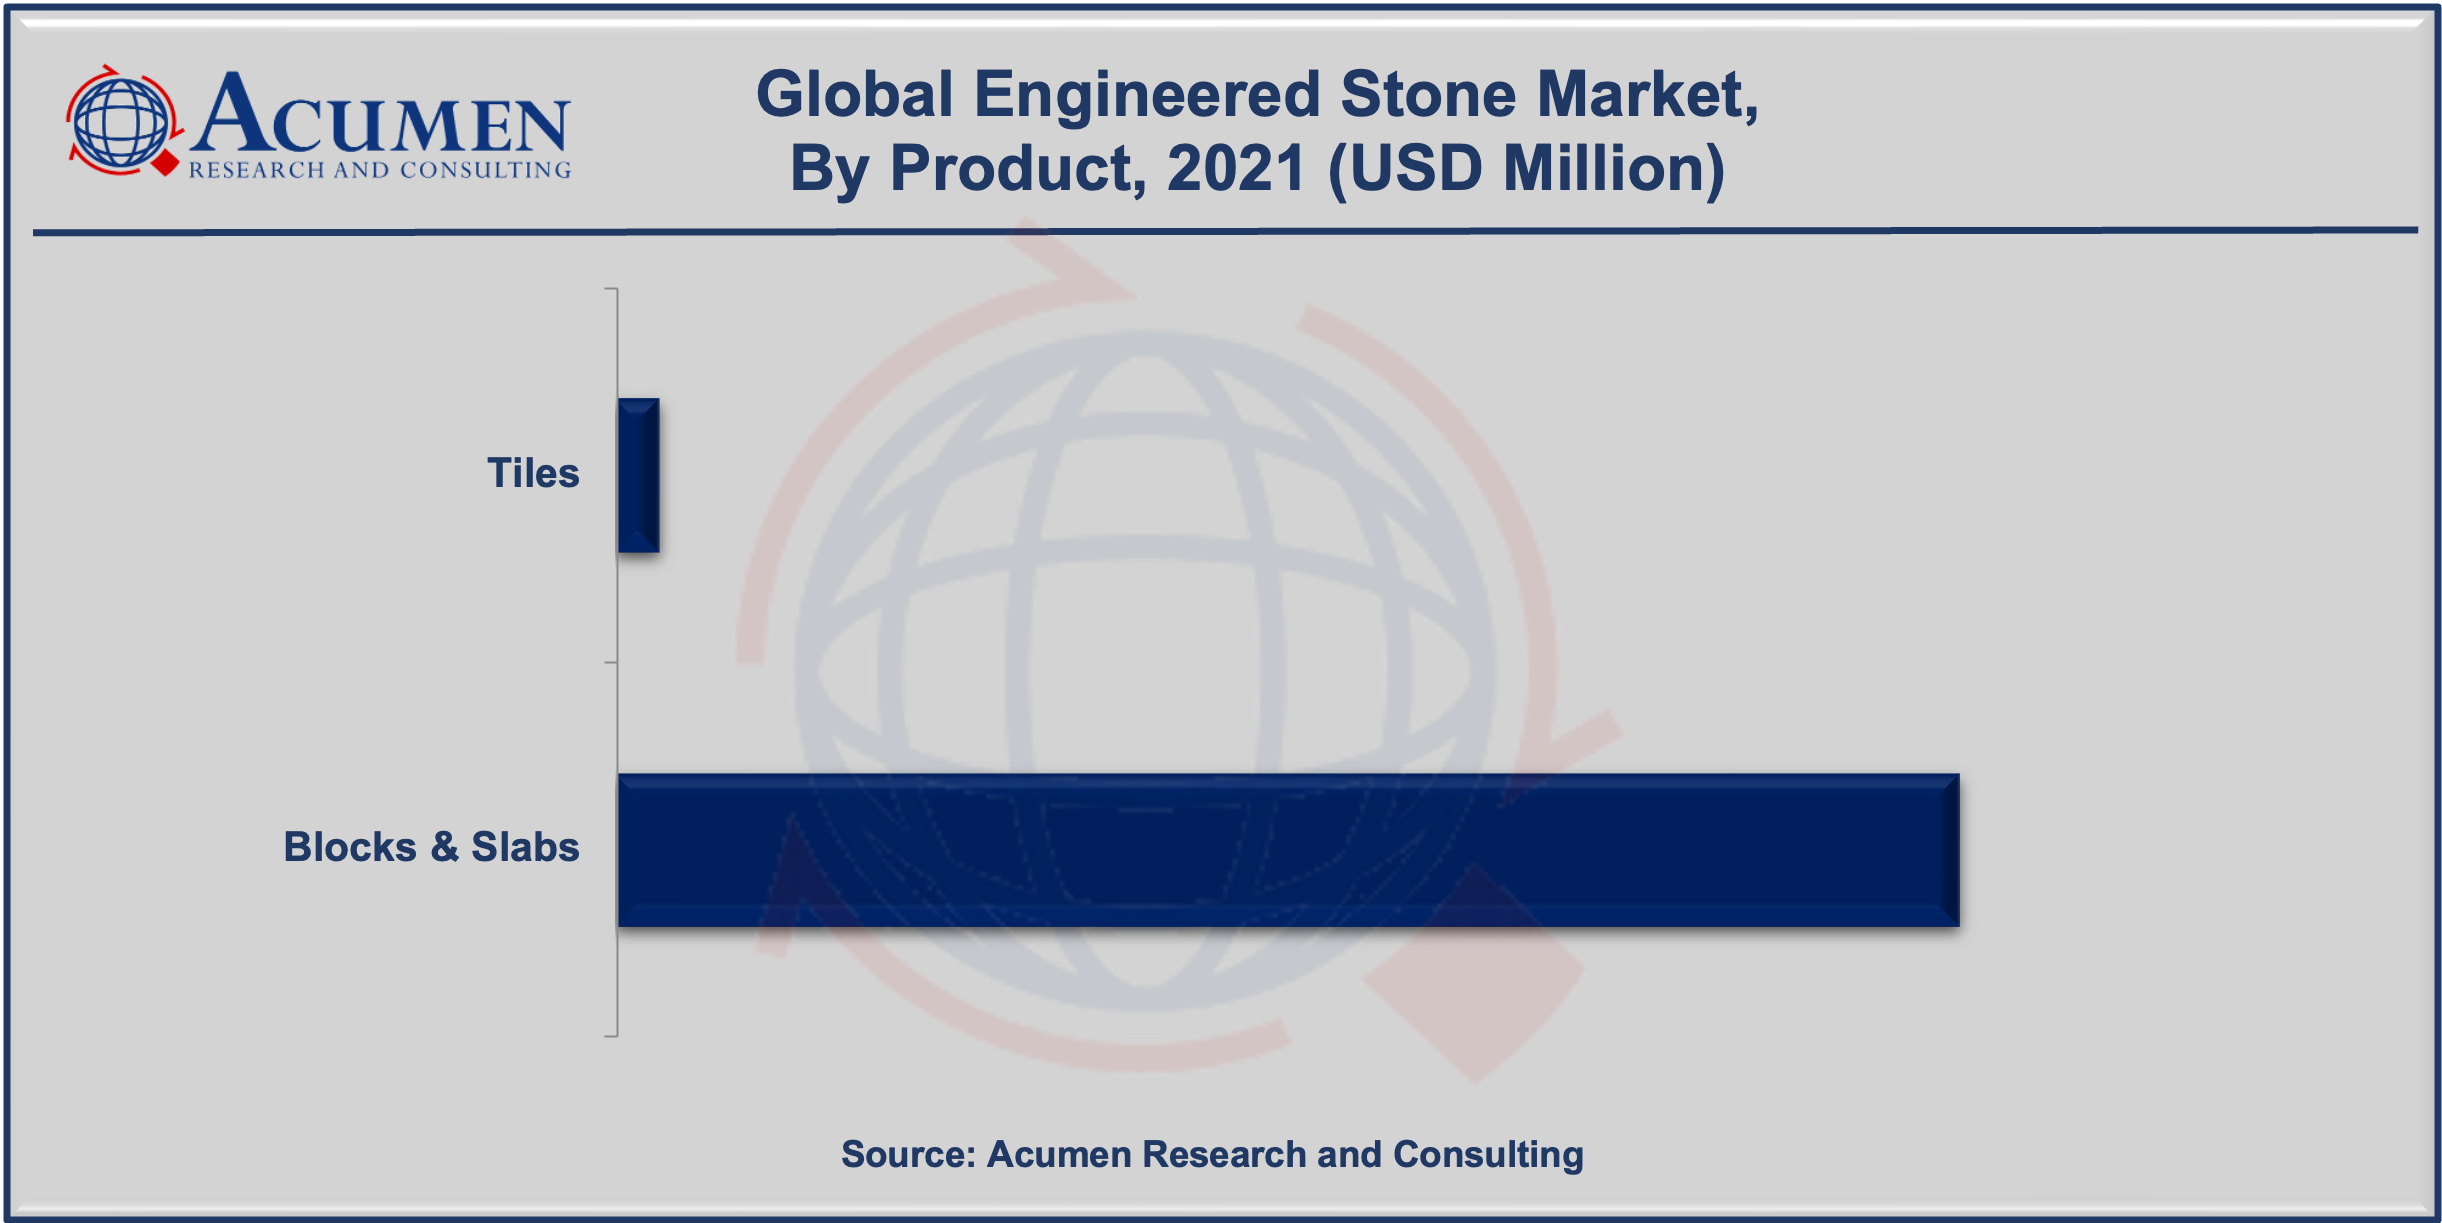
Based on our analysis, the blocks & slabs segment accumulated a prominent engineered stone market share in 2021. Stone blocks and slabs are commonly used to design and build flooring, countertops, bathrooms, fireplaces, kitchens, and walkways. Roofing and wall cladding are two other building and construction applications. Additional specifications to consider include fire, water, and temperature changes. The significant and rapid increase in the use of engineered stone on the global market as cladding for houses and offices, as well as high traffic areas such as airports, residential centers, shopping malls, supermarkets, places of worship, and so on, demonstrates the growing production of blocks & slabs.
Market by Process
- Hot Curing
- Cold Curing
Out of these, the hot curing segment witnessed a growing market share in the coming years. One of the participants Poliya creates engineered stones that can withstand high temperatures. Polipol 3858-L and Polipol 357 are two products that are carefully manufactured to withstand hot environments. Polipol 3858-L, for example, is suitable for facade applications requiring weather resistance due to its clear, light-colored, UV-resistant formulation. Furthermore, because of its low volumetric shrinkage, optimized hot cure condition properties, and minimal cracking during production, Polipol 357 is preferred for kitchen countertop production.
Market by Application
- Kitchen Countertops
- Flooring
- Facades
- Walls
- Bathroom Countertops
- Others
According to our engineered stone market forecast, the countertops segment will grow the fastest in the engineered stone market between 2022 and 2030. The product's popularity can be credited to its stain-resistant properties, lower cost than natural stone slabs, and greater variety in terms of shape, color, design, and texture. They are also non-porous and highly safe, as well as resilient, stain/scratch-proof, sturdy, and heat resistant, ensuring that the surface remains pristine and propelling segment growth.
Engineered Stone Market Regional Outlook
North America
- U.S.
- Canada
Europe
- U.K.
- Germany
- France
- Spain
- Rest of Europe
Latin America
- Mexico
- Brazil
- Rest of Latin America
Asia-Pacific
- India
- Japan
- China
- Australia
- South Korea
- Rest of Asia-Pacific
The Middle East & Africa (MEA)
- Gulf Cooperation Council (GCC)
- South Africa
- Rest of the Middle East & Africa
Presence of a High Number of Players in Asia-Pacific Fuels the Regional Market Growth
According to the engineered stone market regional analysis, Asia-Pacific was a dominating region in the historic period from 2018 to 2021 and is likely to hold the position in the forecasted years from 2022 to 2030. This could be attributed to the presence of a large number of engineered stone producers in countries like China and India. The expansion of the Chinese economy has drastically altered the market, as China now has by far the most producers and the largest total quantity produced. There are more than 100 engineered stone distributors in China alone, according to estimates. As of December 2012, India had approximately 40 slab manufacturing units. On the other hand, the North America region is anticipated to witness the fastest growth rate during the forecasted years. The high growth in the region is credited to the rising demand for energy-efficient construction solutions and rising restoration activities in the U.S. and Canada.
Engineered Stone Market Players
Some of the top engineered stone companies offered in the professional report include A.St.A. WORLD-WIDE, Brenton S.p.A., Johnson Marble & Quartz, Cosentino S.A., Caesarstone Ltd., Belenco, LG Hausys, Diresco, Quarella Group Limited, Technistonea.s., Quartzforms, Stone Italiana S.p.A., Pokarna Limited, and VICOSTONE.
Frequently Asked Questions
How much was the market size of global engineered stone market in 2021?
The estimated value of global engineered stone market in 2021 was accounted to be USD 21,399 Mn.
What will be the projected CAGR for global engineered stone market during forecast period of 2022 to 2030?
The projected CAGR engineered stone market during the analysis period of 2022 to 2030is 5.1%.
Which are the prominent competitors operating in the market?
The prominent players of the global engineered stone market are A.St.A. WORLD-WIDE, Belenco, Brenton S.p.A., Caesarstone Ltd., Cosentino S.A., Diresco, Johnson Marble & Quartz, LG Hausys, Pokarna Limited, Quarella Group Limited, Quartzforms, Stone Italiana S.p.A., Technistonea.s., and VICOSTONE.
Which region held the dominating position in the global engineered stone market?
Asia-Pacific held the dominating engineered stone during the analysis period of 2022 to 2030.
Which region exhibited the fastest growing CAGR for the forecast period of 2022 to 2030?
North America region exhibited fastest growing CAGR for engineered stone during the analysis period of 2022 to 2030.
What are the current trends and dynamics in the global engineered stone market?
Growing demand for eco-friendly products, rapid urbanization and expansion of offices and workspaces, and surging need for durable and aesthetic infrastructure drives the growth of global engineered stone market.
By segment product, which sub-segment held the maximum share?
Based on product, blocks & slabs segment held the maximum share engineered stone market in 2021.


