Elastography Imaging Market Size - Global Industry, Share, Analysis, Trends and Forecast 2024 - 2032
Published :
Report ID:
Pages :
Format :
Elastography Imaging Market Size - Global Industry, Share, Analysis, Trends and Forecast 2024 - 2032
Report Coverage
- Industry Dynamics
- Market Size and Forecast Data
- Segment Analysis
- Competitive Landscape
- Regional Analysis with a Niche Focus on Country-Level Data
- High Level Analysis - Porter's, PESTEL, Value Chain, etc.
- Company Profiles of Key Players
- Option to Customize the Report As Per Your Specific Need
Request Sample Report
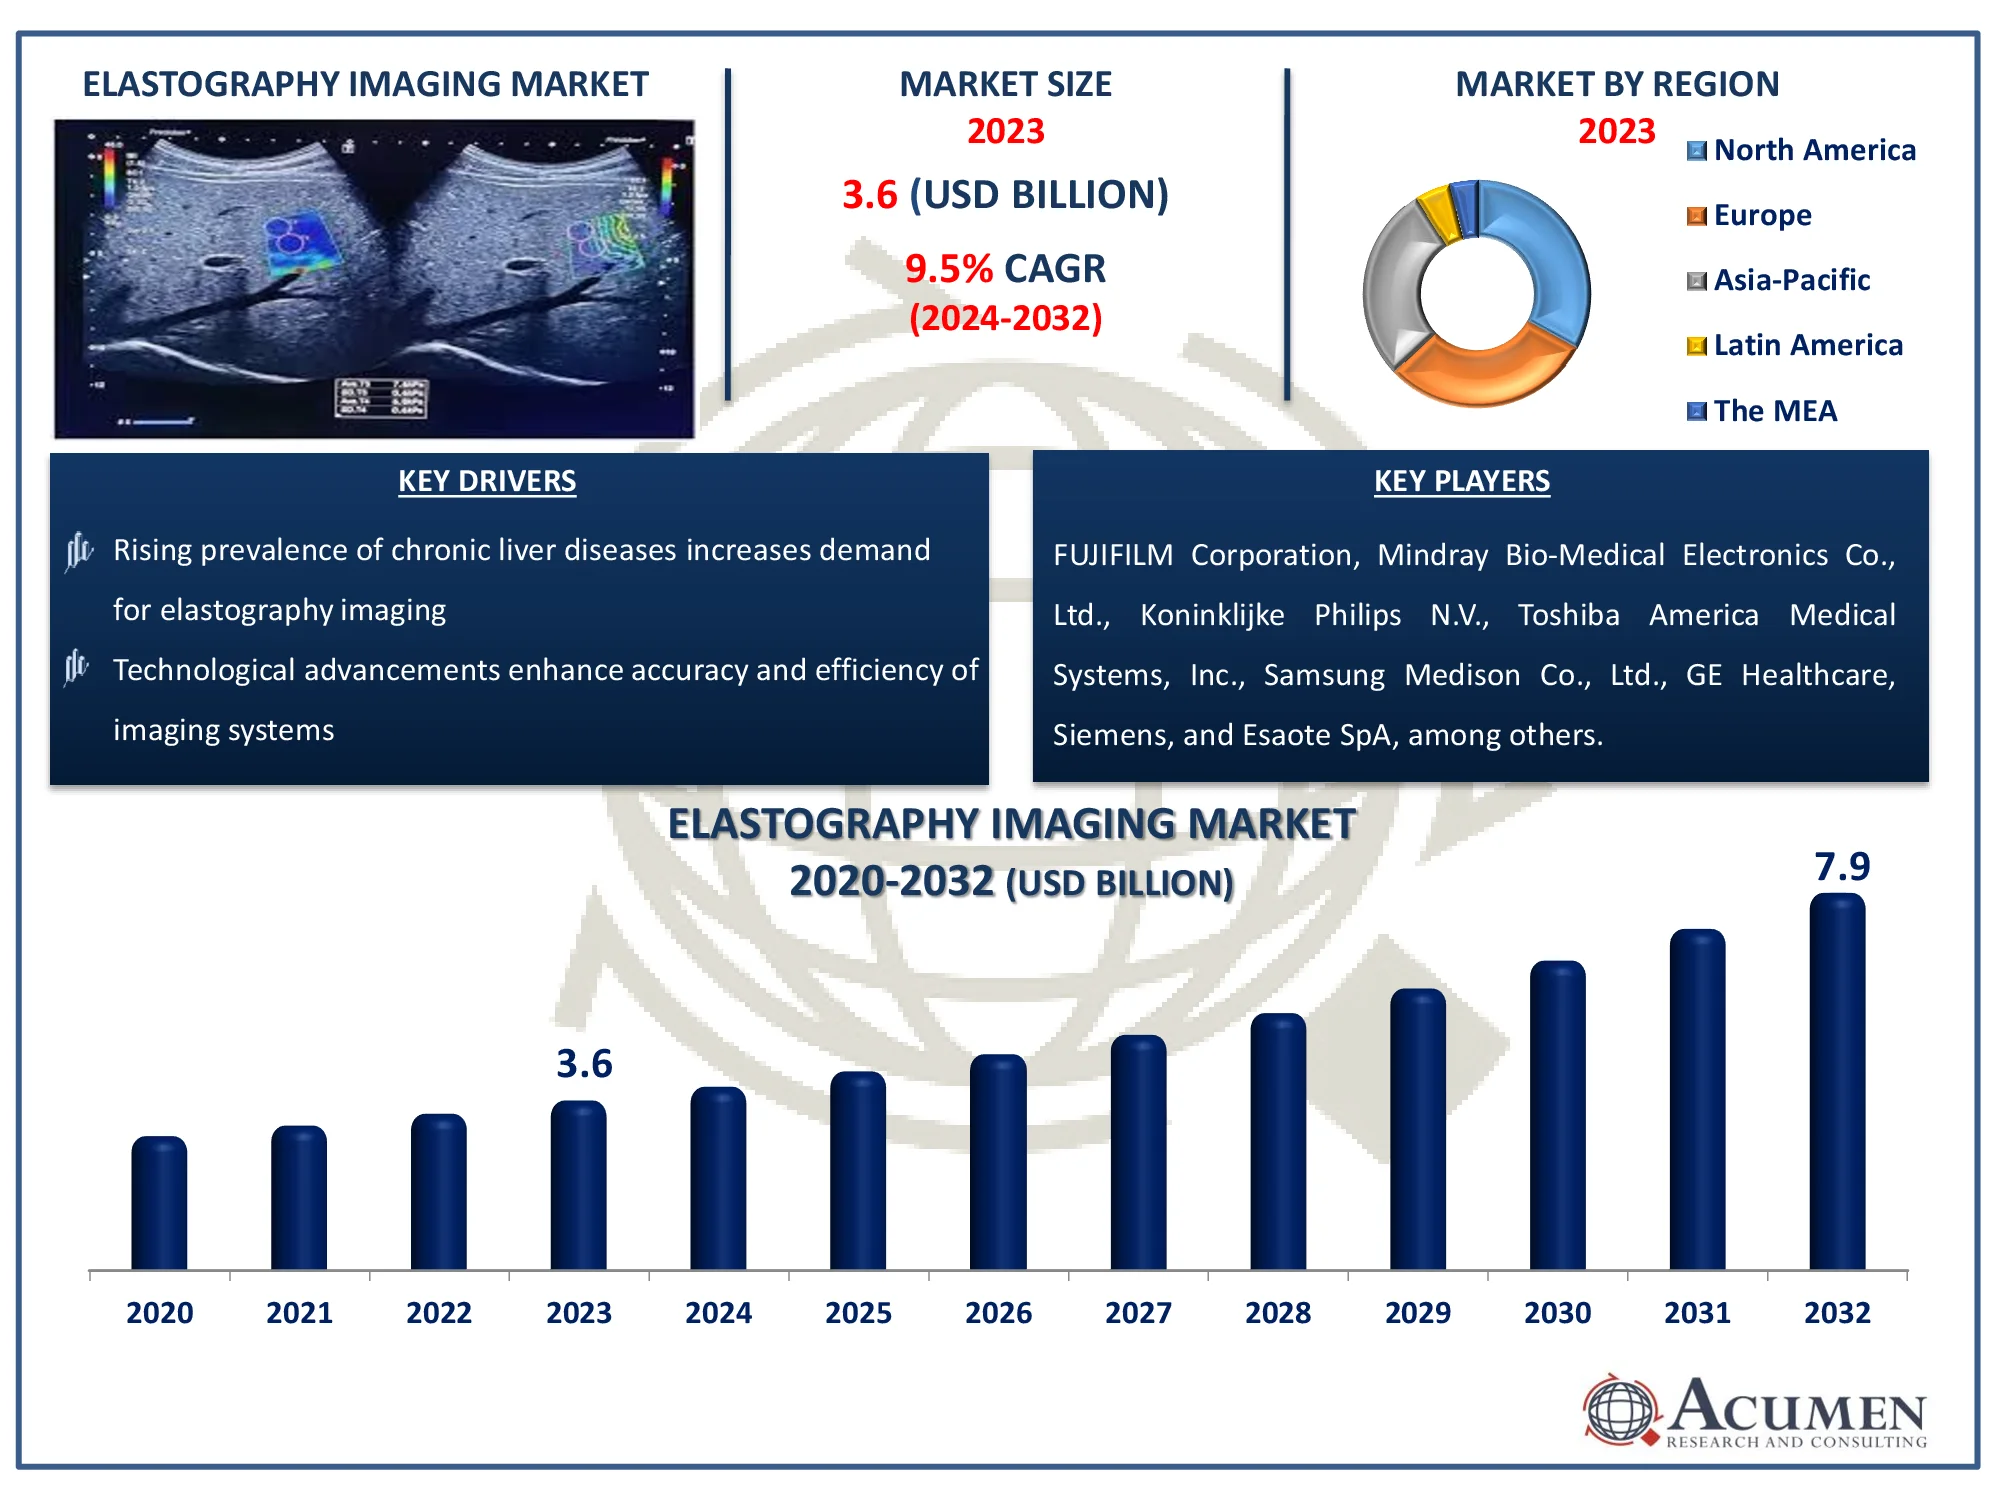
The Global Elastography Imaging Market Size accounted for USD 3.6 Billion in 2023 and is estimated to achieve a market size of USD 7.9 Billion by 2032 growing at a CAGR of 9.5% from 2024 to 2032.
Elastography Imaging Market Highlights
- Global elastography imaging market revenue is poised to garner USD 7.9 billion by 2032 with a CAGR of 9.5% from 2024 to 2032
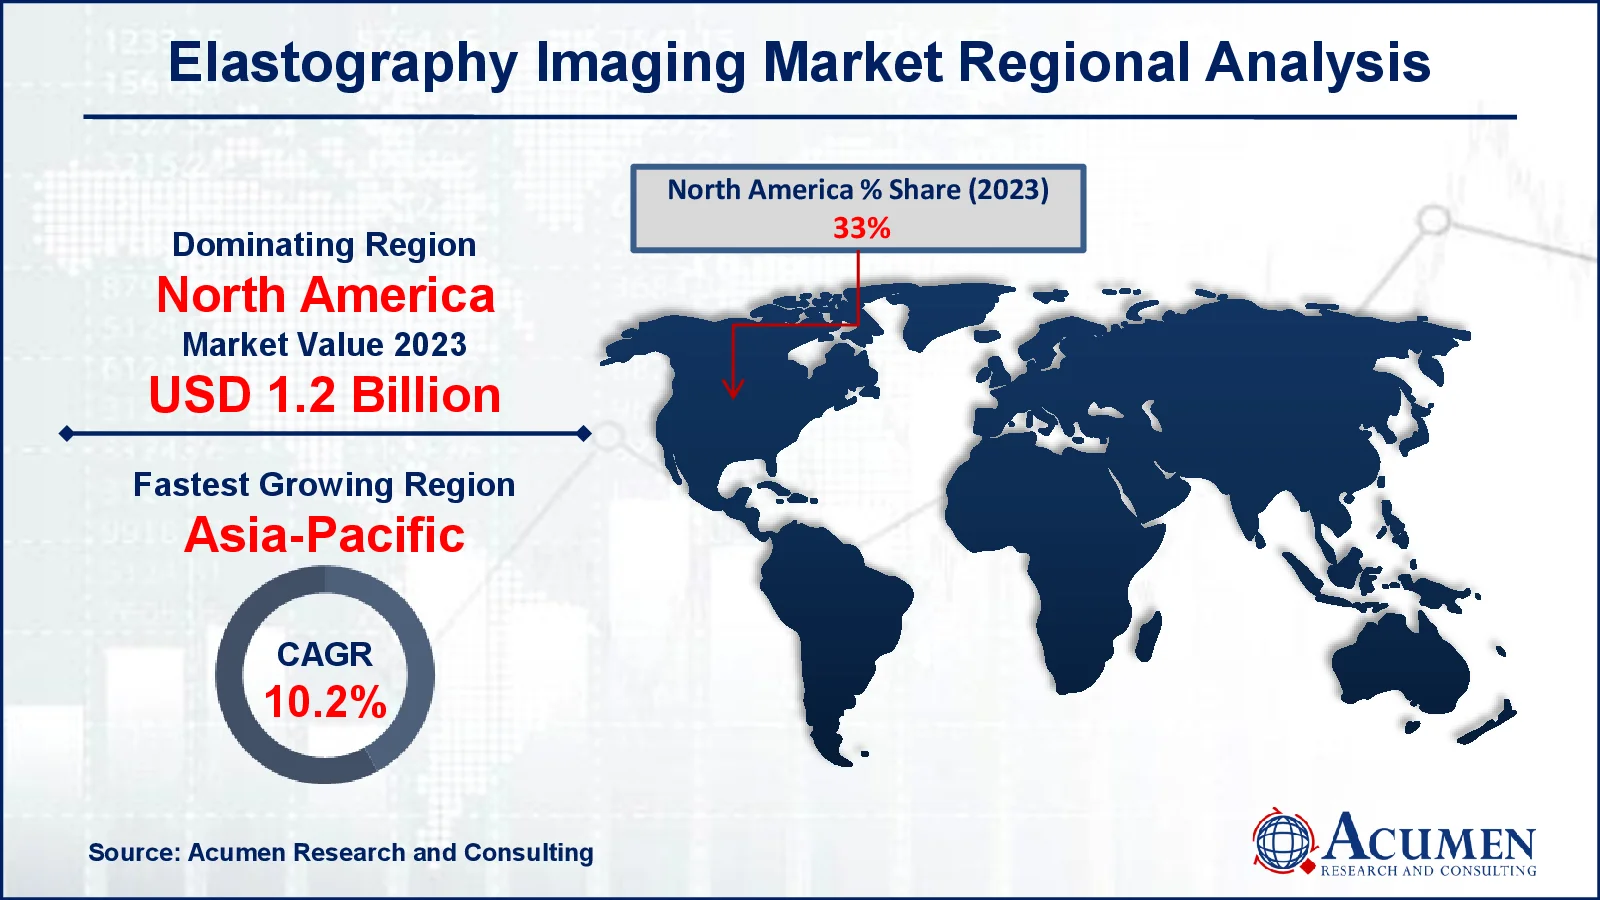
- North America elastography imaging market value occupied around USD 1.2 billion in 2023
- Asia-Pacific elastography imaging market CAGR will record a CAGR of 10.2% from 2024 to 2032
- Among modality, the ultrasound sub-segment generated more than USD 2.4 billion revenue in 2023
- Based on end use, the hospitals sub-segment generated around 40% elastography imaging market share in 2023
- Growing demand for portable and handheld elastography devices is a popular elastography imaging market trend that fuels the industry demand

Elastography is a type of medical imaging that measures elastic and soft tissue stiffness. The most common way of elastography for the stealth map is the detection of various disorders in the body using ultrasound and magnetic resonance imaging. Biopsy is performed as a completely non-invasive procedure in elastography. Elastographic imaging is used to diagnose malignancies of the breast, thyroid, and prostate. The major method for diagnosing liver disease is elastography imaging. For musculoskeletal imaging, a special type of elastography is utilized to determine the mechanical properties and condition of muscles and tendons. A method for magnetic resonance elastography that can measure brain stiffness.
Global Elastography Imaging Market Dynamics
Market Drivers
- Rising prevalence of chronic liver diseases increases demand for elastography imaging
- Technological advancements enhance accuracy and efficiency of imaging systems
- Growing adoption of non-invasive diagnostic techniques
- Increasing awareness and early diagnosis of cancer and liver conditions
Market Restraints
- High cost of elastography imaging equipment limits adoption
- Lack of skilled professionals to operate advanced imaging systems
- Limited availability in developing regions hinders market growth
Market Opportunities
- Expanding healthcare infrastructure in emerging markets
- Integration of AI and machine learning for improved diagnostics
- Increasing research and development for new applications in elastography imaging
Elastography Imaging Market Report Coverage
| Market | Elastography Imaging Market |
| Elastography Imaging Market Size 2022 |
USD 3.6 Billion |
| Elastography Imaging Market Forecast 2032 | USD 7.9 Billion |
| Elastography Imaging Market CAGR During 2023 - 2032 | 9.5% |
| Elastography Imaging Market Analysis Period | 2020 - 2032 |
| Elastography Imaging Market Base Year |
2022 |
| Elastography Imaging Market Forecast Data | 2023 - 2032 |
| Segments Covered | By Modality, By Application, By End Use, And By Geography |
| Regional Scope | North America, Europe, Asia Pacific, Latin America, and Middle East & Africa |
| Key Companies Profiled | FUJIFILM Corporation, Mindray Bio-Medical Electronics Co., Ltd., Koninklijke Philips N.V., Toshiba America Medical Systems, Inc., Samsung Medison Co., Ltd., GE Healthcare, Canon Medical Systems Corporation, Hitachi, Ltd., Siemens, and Esaote SpA. |
| Report Coverage |
Market Trends, Drivers, Restraints, Competitive Analysis, Player Profiling, Covid-19 Analysis, Regulation Analysis |
Elastography Imaging Market Insights
One of the key market drivers is the increased incidence of chronic liver and breast cancer and the growing request for sophisticated diagnostic methods. The elastography imaging market is also anticipated to be fueling during the prediction era with high preferences for minimum or non-invasive operations. Patients and physicians, especially as a consequence of its non-invasive nature, and the exact evaluation of tissue mechanical characteristics, gain popularity and acceptance in elastography. Advanced systems of elastography offer both quantitative and qualitative details.
The increased demand in emerging nations for sophisticated diagnostic methods is anticipated to replace traditional ultrasound with elastography, which will provide a significant boost to the industry. Wave shear elastography offers many benefits over other methods of diagnosis. The method helps to decrease biopsy requirements under different breast circumstances. It is commonly used to evaluate hepatic circumstances before and after the transplant and to track liver cirrhosis. The increasing occurrence of diseases in the breast and liver will increase the demand for elastographic devices.
Possible apps for early tumor detection are elastography. It can be used to identify small nodules in the glands correctly. The use of elastography in preventive healthcare is anticipated to boost. An increasing amount of continuing research are anticipated to boost the elastography imaging market during the prediction era to evaluate the prospective applications of elastography. Many of these research include ophthalmic applications, such as oculomotor-muscle analysis and corneal mechanical characteristics.
Elastography Imaging Market Segmentation
The worldwide market for elastography imaging is split based on modality, application, end use, and geography.
Elastography Imaging Market By Modality
- Magnetic Resonance
- Ultrasound
According to elastography imaging industry analysis, due to advantages such as affordability, brief turnaround times and ready access, the ultrasound sector maintains the dominant share. Gradually, ultrasound elastography replaces standard equipment used for organ evaluation and biopsy. Due to its non-invasive nature, the magnetic resonance segment is anticipated to develop most rapidly between 2024 and 2032. This is the most popular method for the diagnosis of hepatic illnesses. An increasing use of magnetic resonance elastography is contributing to the development of this section owing to precise outcomes and painless process. The elastography of magnetic resonance is an efficient diagnostic instrument for advanced liver fibrosis. MRE thus helps measure the seriousness and the course of the therapy of liver diseases.
Elastography Imaging Market By Application
- Urology
- Radiology
- Obstetrics
- Orthopedic and Musculoskeletal
- Cardiology
- Vascular
- Others
The radiology segment is likely to lead the elastography imaging business in the next years as elastography is increasingly used in ultrasonic radiography and image-guided radiation treatment. Cancer diagnosis and/or therapy, gastrointestinal disorders, and soft tissue wounds are all examples of applications for general imaging in radiology.
Easy worldwide availability of elastographic systems is anticipated to increase demand for these systems. In addition, the demand for radiology is anticipated to increase during the forecast period for various kinds of cancer, particularly breast cancer.
The incidence of cardiac disorders on a worldwide basis is anticipated to increase also significantly in the forecast period. In addition, the development of the segment will be expected to increase consumers ' disposable incomes and improve healthcare infrastructure in developing markets.
The segment of obstetrics is anticipated to show low development owing to stringent public requirements for the use of obstetric ultrasound machines. The market growth might be threatened. However, the market in urology and vascular profitable possibilities for development are anticipated to offer increased incidences of prostate cancer and increasing cases of vascular illnesses.
Elastography Imaging Market By End Use
- Ambulatory Surgery Centers
- Hospitals
- Others
In the elastography imaging market, hospitals are the largest segment, earning the most revenue. This supremacy is fueled by hospitals' ability to handle large numbers of patients and their modern infrastructure, which allows for the integration of cutting-edge technology such as ultrasound and MRI-based elastography devices. Hospitals use experienced healthcare workers who use non-invasive diagnostic tools to improve patient outcomes, particularly in the detection of liver problems and malignancies. The increased number of imaging-based surgeries and diagnostic procedures conducted in hospitals drives up demand. Furthermore, hospitals usually make larger investments in medical equipment, boosting the adoption of automated elastography devices and strengthening their market position over ambulatory surgery centers and other institutions.
Elastography Imaging Market Regional Outlook
North America
- U.S.
- Canada
Europe
- U.K.
- Germany
- France
- Spain
- Rest of Europe
Asia-Pacific
- India
- Japan
- China
- Australia
- South Korea
- Rest of Asia-Pacific
Latin America
- Brazil
- Mexico
- Rest of Latin America
The Middle East & Africa
- South Africa
- GCC Countries
- Rest of the Middle East & Africa (ME&A)

Elastography Imaging Market Regional Analysis
North America will have the largest share of the industry during the elastography imaging market forecast period due to the large number of global players. In addition, the national market is being driven by increased attempts by producers to market these technologies, and increasing significance for their use among end-users. In most developed countries of Europe, high healthcare spending drives the market.
In addition, increasing public cancer screening projects, including the use of elastography ultrasound machines, contribute to market growth. The development in Asia Pacific over the forecast period is also anticipated to continue. The regional market is anticipated to be driven by increased geriatric populations, improvement of health facilities and fast economic growth. Economies like India, Japan and China, owing to rapid development of healthcare services, contribute significantly to growth in Asia-Pacific. Moreover, the regional market is contributing to increase government understanding of the therapeutic potential of ultrasound technology and the precise and rapid outcomes produced by the machines.
Elastography Imaging Market Players
Some of the top elastography imaging companies offered in our report includes FUJIFILM Corporation, Mindray Bio-Medical Electronics Co., Ltd., Koninklijke Philips N.V., Toshiba America Medical Systems, Inc., Samsung Medison Co., Ltd., GE Healthcare, Canon Medical Systems Corporation, Hitachi, Ltd., Siemens, and Esaote SpA.
Frequently Asked Questions
How big is the elastography imaging market?
The elastography imaging market size was valued at USD 3.6 billion in 2023.
What is the CAGR of the global elastography imaging market from 2024 to 2032?
The CAGR of elastography imaging is 9.5% during the analysis period of 2024 to 2032.
Which are the key players in the elastography imaging market?
The key players operating in the global market are including FUJIFILM Corporation, Mindray Bio-Medical Electronics Co., Ltd., Koninklijke Philips N.V., Toshiba America Medical Systems, Inc., Samsung Medison Co., Ltd., GE Healthcare, Canon Medical Systems Corporation, Hitachi, Ltd., Siemens, and Esaote SpA.
Which region dominated the global elastography imaging market share?
North America held the dominating position in elastography imaging industry during the analysis period of 2024 to 2032.
Which region registered fastest CAGR from 2024 to 2032?
Asia-Pacific region exhibited fastest growing CAGR for market of elastography imaging during the analysis period of 2024 to 2032.
What are the current trends and dynamics in the global elastography imaging industry?
The current trends and dynamics in the elastography imaging industry include rising prevalence of chronic liver diseases increases demand for elastography imaging, technological advancements enhance accuracy and efficiency of imaging systems, growing adoption of non-invasive diagnostic techniques, and increasing awareness and early diagnosis of cancer and liver conditions.
Which end use held the maximum share in 2023?
The hospitals end use held the maximum share of the elastography imaging industry.


