Direct Attach Cable Market Size - Global Industry, Share, Analysis, Trends and Forecast 2023 - 2032
Published :
Report ID:
Pages :
Format :
Direct Attach Cable Market Size - Global Industry, Share, Analysis, Trends and Forecast 2023 - 2032
Report Coverage
- Industry Dynamics
- Market Size and Forecast Data
- Segment Analysis
- Competitive Landscape
- Regional Analysis with a Niche Focus on Country-Level Data
- High Level Analysis - Porter's, PESTEL, Value Chain, etc.
- Company Profiles of Key Players
- Option to Customize the Report As Per Your Specific Need
Request Sample Report
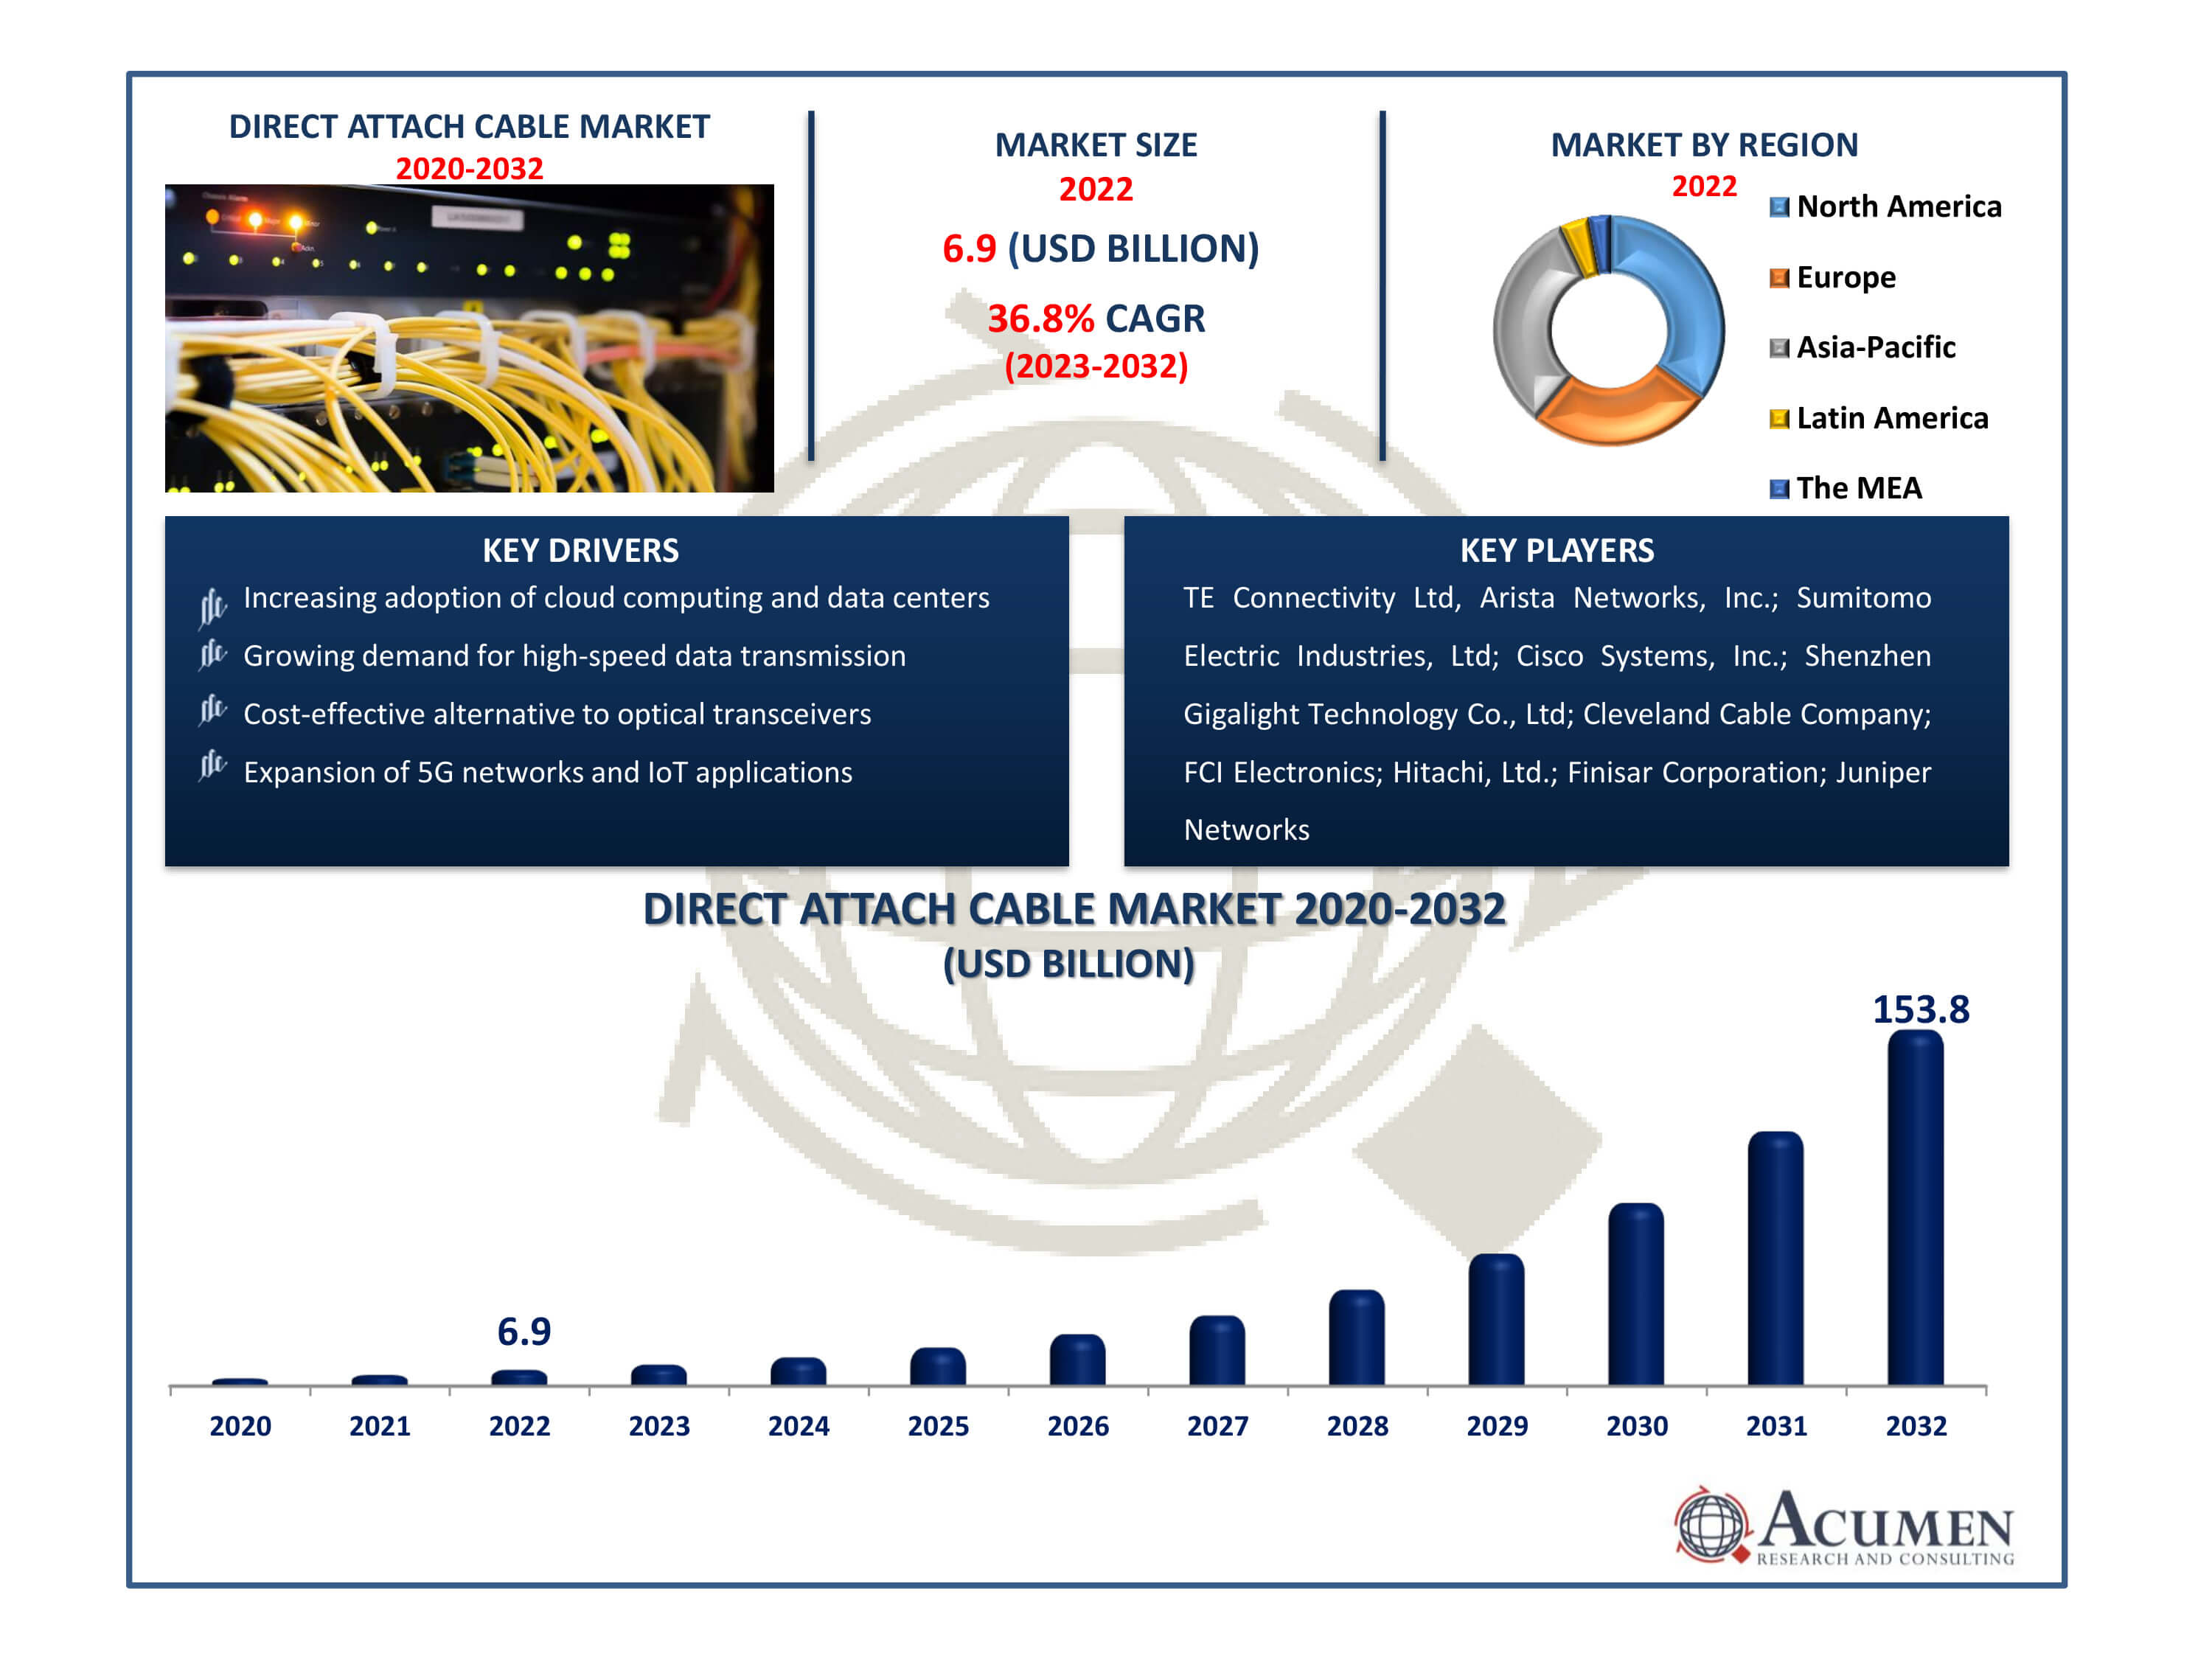
The Direct Attach Cable Market Size accounted for USD 6.9 Billion in 2022 and is estimated to achieve a market size of USD 153.8 Billion by 2032 growing at a CAGR of 36.8% from 2023 to 2032.
Direct Attach Cable Market Highlights
- Global direct attach cable market revenue is poised to garner USD 153.8 billion by 2032 with a CAGR of 36.8% from 2023 to 2032
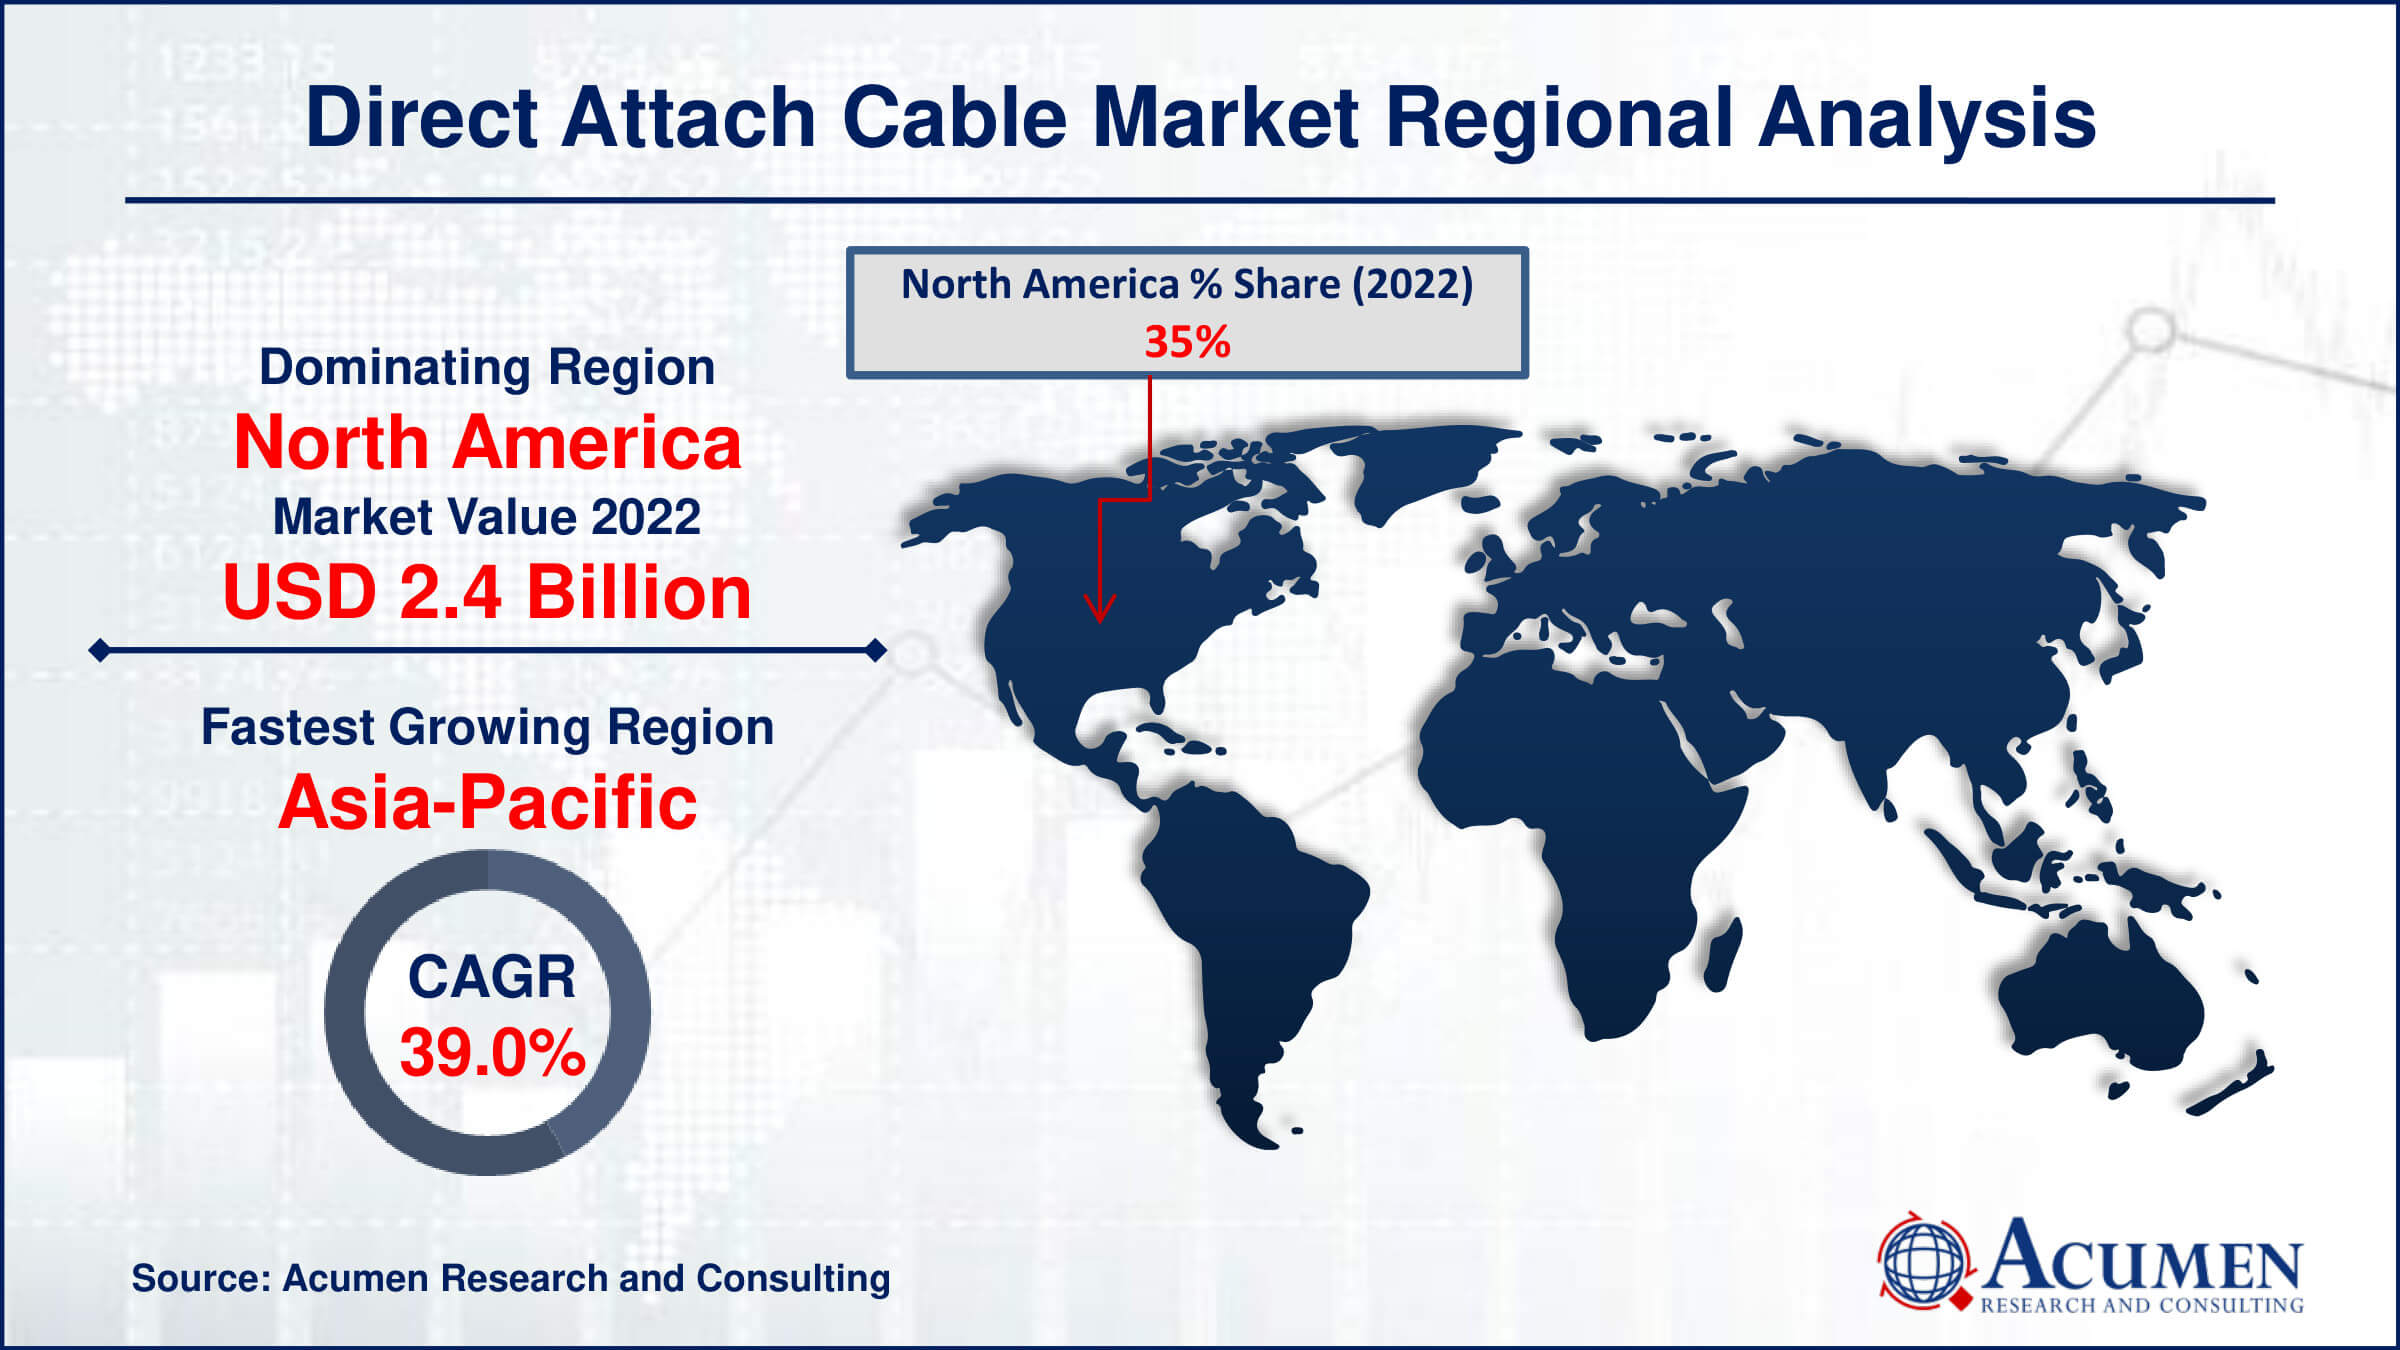
- North America direct attach cable market value occupied around USD 2.4 billion in 2022
- Asia-Pacific direct attach cable market growth will record a CAGR of more than 39% from 2023 to 2032
- Among product type, the active optical cables sub-segment generated over US$ 3.8 billion revenue in 2022
- Based on end-user, the telecommunications sub-segment generated around 38% share in 2022
- The development of higher-speed and longer-distance DACs is a popular direct attach cable market trend that fuels the industry demand

The direct attach cable (DAC) market is a subset of the technology industry that manufactures and distributes high-speed data connections. DACs are used in data centers and other IT environments to provide fast and reliable connections between networking equipment such as switches, routers, and servers. These cables are popular due to their low cost, energy efficiency, and low latency, making them an important component in modern data transfer. DACs are widely used for high-performance computing and data transmission and are available in a variety of formats, including copper and optical connections. This market has expanded because to the increasing demand for rapid, efficient data transfer in the digital age, which has aided the growth of cloud computing, big data, and high-speed internet connectivity.
Global Direct Attach Cable Market Dynamics
Market Drivers
- Growing demand for high-speed data transmission
- Increasing adoption of cloud computing and data centers
- Cost-effective alternative to optical transceivers
- Expansion of 5G networks and IoT applications
Market Restraints
- Limited transmission distance compared to optical solutions
- Compatibility issues with different equipment manufacturers
- Vulnerability to physical damage and bending
Market Opportunities
- Advancements in data center technology and infrastructure
- Rising demand for faster and more reliable connectivity
- Expansion of telemedicine and remote work
Direct Attach Cable Market Report Coverage
| Market | Direct Attach Cable Market |
| Direct Attach Cable Market Size 2022 | USD 6.9 Billion |
| Direct Attach Cable Market Forecast 2032 | USD 153.8 Billion |
| Direct Attach Cable Market CAGR During 2023 - 2032 | 36.8% |
| Direct Attach Cable Market Analysis Period | 2020 - 2032 |
| Direct Attach Cable Market Base Year |
2022 |
| Direct Attach Cable Market Forecast Data | 2023 - 2032 |
| Segments Covered | By Product Type, By Form Factor, By Signal Rate Per Channel, By End-User, And By Geography |
| Regional Scope | North America, Europe, Asia Pacific, Latin America, and Middle East & Africa |
| Key Companies Profiled | TE Connectivity Ltd, Arista Networks, Inc.; Sumitomo Electric Industries, Ltd; Cisco Systems, Inc.; Shenzhen Gigalight Technology Co., Ltd; Cleveland Cable Company; FCI Electronics; Hitachi, Ltd.; Finisar Corporation; Juniper Networks; Emcore Corporation; Methode Electronics; Avago Technologies Ltd; Molex, LLC; Solid Optics; Nexans; ProLabs Ltd; Panduit; The Siemon Company; and 3M. |
| Report Coverage |
Market Trends, Drivers, Restraints, Competitive Analysis, Player Profiling, Covid-19 Analysis, Regulation Analysis |
Direct Attach Cable Market Insights
The increasing adoption of direct attach cables for data storage is expected to drive market growth. The data center landscape is evolving rapidly due to the rising use of direct attach cables for data storage. Manufacturers are making substantial investments in high-speed pluggable products, fueling demand for active optical cables and direct attach cables. These cables are essential to meet the requirements of high-density, high-bandwidth applications while maintaining low power consumption. Additionally, active optical cables serve as the primary transmission medium in data centers and High-Performance Computing (HPC) to ensure data transmission flexibility and reliability. They are used for short-distance data communication and interconnect applications.
The increasing global internet penetration is prompting manufacturers and suppliers to invest in research and development to enhance data transmission products. Given that the production of dynamic optical cables is complex and costly, experts are increasingly focused on improving reliable high-speed pluggable products while keeping the final product cost-effective.
The possibility of compatibility concerns is a significant limitation in the direct attach cable (DAC) business. Because different vendors may employ proprietary standards for DAC connectors and protocols, ensuring flawless interoperability between varied networking equipment can be difficult. This can limit client options and raise the complexity of system integration, impeding DAC adoption. To remove this constraint and encourage more interoperability among DAC solutions, standardization efforts, and industry collaboration are required.
Direct Attach Cable Market Segmentation
The worldwide market for direct attach cable is split based on product type, form factor, signal rate per channel, end-user, and geography.
Direct Attach Cable Product Types
- Direct Attach Copper Cables
- Passive
- Active
- Active Optical Cables
According to the direct attach cable (DAC) industry analysis, active optical cables (AOCs) dominate the market due to their numerous benefits. The market analysis reveals that, when compared to direct attach copper cables, AOCs offer faster data transfer rates, greater transmission lengths, and lower power usage. Their lightweight and adaptable architecture make them easy to deploy and manage in data center environments. Market analysis indicates that active optical cables are the favored choice for meeting the increasing demand for faster and more efficient data transfer, driving their market domination.
Direct Attach Cable Form Factors
- QSFP
- SFP
- CXP
- Cx4
- CFP
- CDFP
According to direct attach cable market forecast, the QSFP (quad small form-factor pluggable) sector is expected to be the largest throughout 2023 to 2032. This projection is based on its scalability and wide range of applications. QSFP connections are popular in data centers and telecommunications because they offer high data transfer speeds and can be used in a variety of networking equipment. Their connectivity with many devices and ability to handle high bandwidth requirements lead to their projected market domination.
Direct Attach Cable Signal Rate Per Channels
- 10 Gbps
- 25 Gbps
- 56G PAM4
- 112G PAM4
- 224 Gbps
The 10 Gbps sector is the most significant in the DAC market, due to its extensive use in many networking applications. It is a well-known and cost-effective option for a wide range of data transfer requirements. While higher signal rate solutions such as 112G PAM4 and 224 Gbps provide faster speeds, the 10 Gbps segment remains dominant because it fits the needs of a wide range of customers without the increased complexity and cost associated with the higher-rate alternatives.
Direct Attach Cable End-Users
- Networking
- Telecommunications
- Data Storage
- High-Performance Computing (HPC) Centers
- Others
The telecoms industry is expected to remain the largest segment in the direct attach cable (DAC) market. This is attributed to the growing demand for high-speed data transmission. As more people use mobile devices to access the internet and watch videos, there is an increasing need for reliable data connectivity. DACs play a critical role in facilitating this quick data transfer, making the telecommunications sector the largest market segment, aligning with market forecasts as it caters to the rising communication needs of a global audience.
Direct Attach Cable Market Regional Outlook
North America
- U.S.
- Canada
Europe
- U.K.
- Germany
- France
- Spain
- Rest of Europe
Asia-Pacific
- India
- Japan
- China
- Australia
- South Korea
- Rest of Asia-Pacific
Latin America
- Brazil
- Mexico
- Rest of Latin America
The Middle East & Africa
- South Africa
- GCC Countries
- Rest of the Middle East & Africa (ME&A)

Direct Attach Cable Market Regional Analysis
North America dominates the direct attach cable (DAC) industry for numerous reasons. For starters, the region is home to multiple tech behemoths, data centers, and telecommunications corporations, all of which rely heavily on DACs for high-speed data transmission. The United States, in particular, has a high concentration of data centers in tech hubs such as Silicon Valley and across numerous metropolitan areas. These data centers rely on DACs for networking and interconnection, which contributes to the region's market supremacy. Furthermore, North America has a well-established IT infrastructure, strong internet penetration, and significant expenditures in 5G technology, which drives demand for DACs even further.
In addition, the North American market is distinguished by the early adoption of innovative technology and products, like DACs. The region's high emphasis on innovation and R&D activities further drives market expansion, as businesses seek quicker and more efficient data transfer options.
Asia-Pacific, on the other hand, is the fastest-growing region in the DAC market, owing to rapid industrialization, urbanization, and rising digital infrastructure. Countries such as China, India, and South Korea have seen rapid expansion in the IT sector, cloud computing, and e-commerce. As a result, the demand for DACs to serve high-bandwidth applications, data centers, and the proliferation of mobile devices has skyrocketed. Furthermore, the Asia-Pacific region's growing need for 5G networks and the growth of smart cities have generated significant prospects for DAC adoption.
Direct Attach Cable Market Players
Some of the top direct attach cable companies offered in our report includes TE Connectivity Ltd, Arista Networks, Inc.; Sumitomo Electric Industries, Ltd; Cisco Systems, Inc.; Shenzhen Gigalight Technology Co., Ltd; Cleveland Cable Company; FCI Electronics; Hitachi, Ltd.; Finisar Corporation; Juniper Networks; Emcore Corporation; Methode Electronics; Avago Technologies Ltd; Molex, LLC; Solid Optics; Nexans; ProLabs Ltd; Panduit; The Siemon Company; and 3M.
Frequently Asked Questions
How big is the direct attach cable market?
The direct attach cable market size was USD 6.9 billion in 2022.
What is the CAGR of the global direct attach cable market from 2023 to 2032?
The CAGR of direct attach cable is 36.8% during the analysis period of 2023 to 2032.
Which are the key players in the direct attach cable market?
The key players operating in the global market are including TE Connectivity Ltd, Arista Networks, Inc.; Sumitomo Electric Industries, Ltd; Cisco Systems, Inc.; Shenzhen Gigalight Technology Co., Ltd; Cleveland Cable Company; FCI Electronics; Hitachi, Ltd.; Finisar Corporation; Juniper Networks; Emcore Corporation; Methode Electronics; Avago Technologies Ltd; Molex, LLC; Solid Optics; Nexans; ProLabs Ltd; Panduit; The Siemon Company; and 3M.
Which region dominated the global direct attach cable market share?
North America held the dominating position in direct attach cable industry during the analysis period of 2023 to 2032.
Which region registered fastest CAGR from 2023 to 2032?
Asia-Pacific region exhibited fastest growing CAGR for market of direct attach cable during the analysis period of 2023 to 2032.
What are the current trends and dynamics in the global direct attach cable industry?
The current trends and dynamics in the direct attach cable industry include growing demand for high-speed data transmission, increasing adoption of cloud computing and data centers, cost-effective alternative to optical transceivers, and expansion of 5G networks and IoT applications.
Which product type held the maximum share in 2022?
The active optical cables product type held the maximum share of the direct attach cable industry.


