DevOps Market Size - Global Industry, Share, Analysis, Trends and Forecast 2024 - 2032
Published :
Report ID:
Pages :
Format :
DevOps Market Size - Global Industry, Share, Analysis, Trends and Forecast 2024 - 2032
Report Coverage
- Industry Dynamics
- Market Size and Forecast Data
- Segment Analysis
- Competitive Landscape
- Regional Analysis with a Niche Focus on Country-Level Data
- High Level Analysis - Porter's, PESTEL, Value Chain, etc.
- Company Profiles of Key Players
- Option to Customize the Report As Per Your Specific Need
Request Sample Report
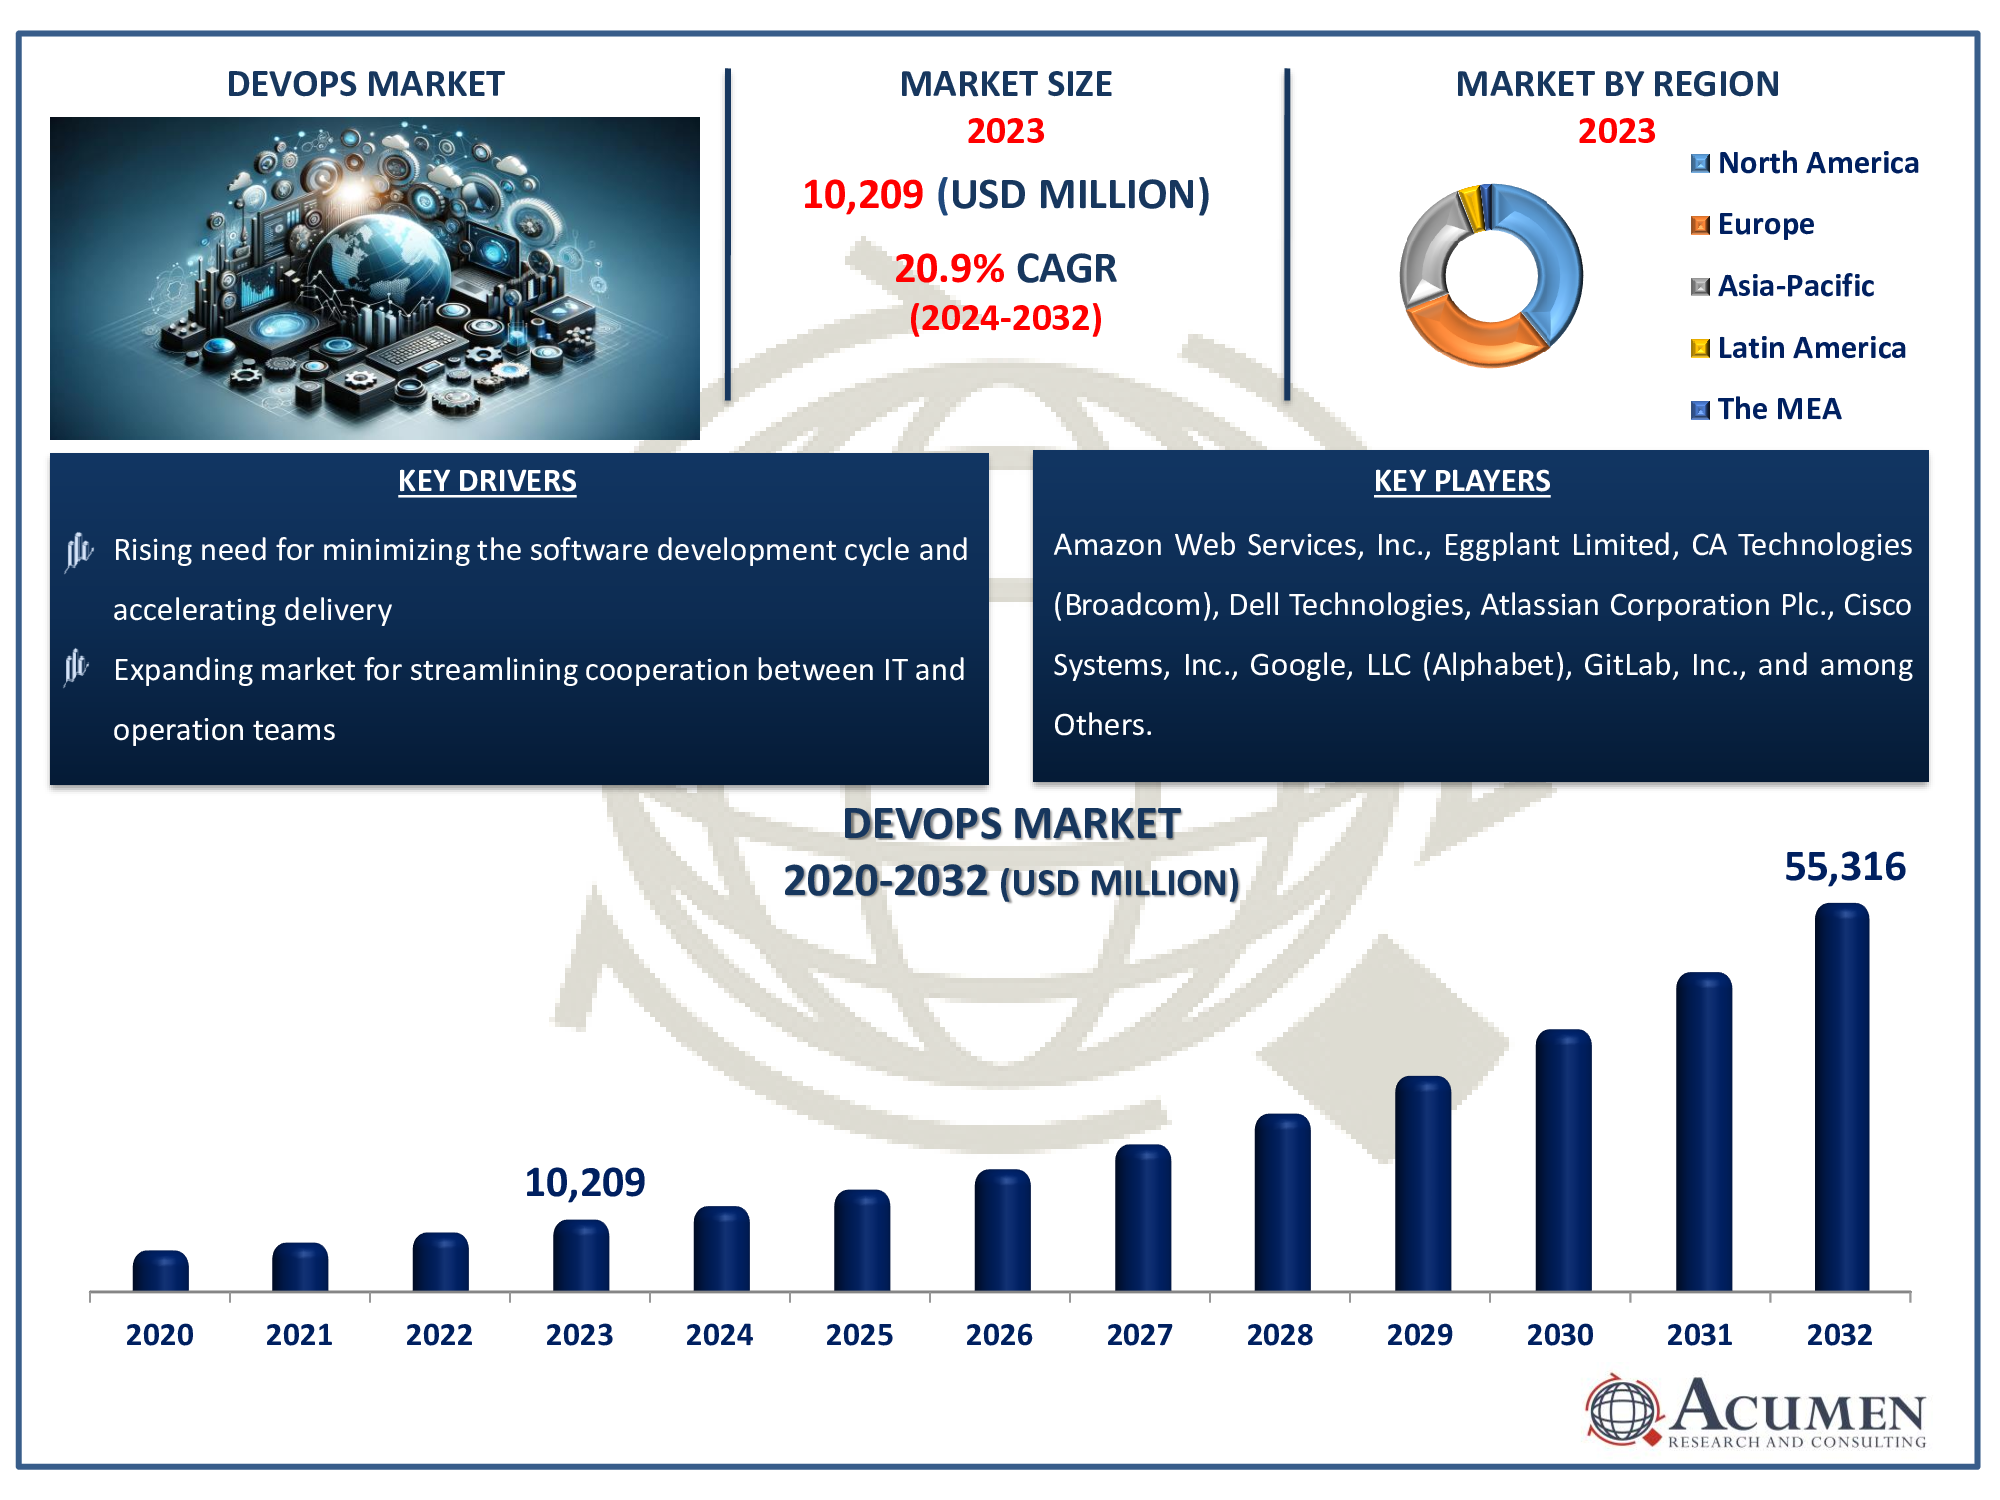
The DevOps Market Size accounted for USD 10,209 Million in 2023 and is estimated to achieve a market size of USD 55,316 Million by 2032 growing at a CAGR of 20.9% from 2024 to 2032.
DevOps Market Highlights
- Global DevOps market revenue is poised to garner USD 55,316 million by 2032 with a CAGR of 20.9% from 2024 to 2032
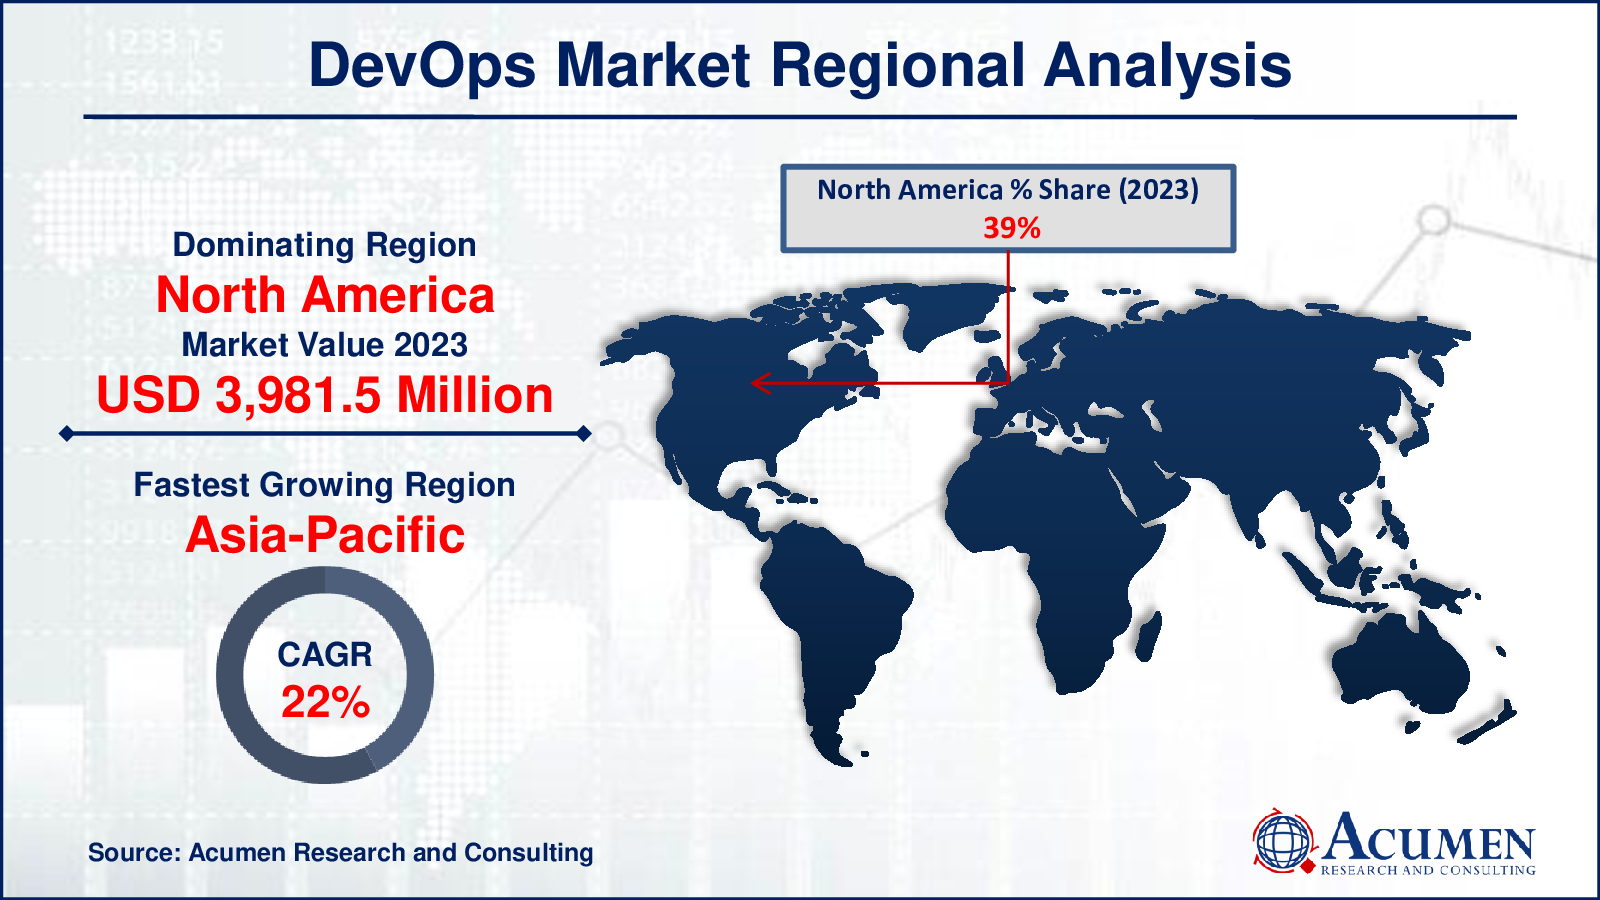
- North America DevOps market value occupied around USD 3,981.5 million in 2023
- Asia-Pacific DevOps market growth will record a CAGR of more than 22% from 2024 to 2032
- Among component, the solutions sub-segment generated more than USD 6,023.3 million revenue in 2023
- Based on enterprise size, the large enterprises sub-segment generated around 56% DevOps market share in 2023
- Expansion of edge computing and IoT integration is a popular DevOps market trend that fuels the industry demand

Development to Operations (DevOps) is a combination of cultural concepts, processes, and technologies that improve an organization's capacity to provide high-velocity services and applications, upgrading and improving new technologies at a faster speed than traditional software development and infrastructure management methodologies. This feature enables businesses to provide better service to their customers and compete in the global market. DevOps is the intersection of IT Development and IT Operations, emphasizing the need for the two departments to work closely together to achieve comparable goals. Increased cloud computing adoption, breakthroughs in machine learning, continuous integration development, and software standardization are expected to propel the DevOps market forward.
Global DevOps Market Dynamics
Market Drivers
- Rising need for minimizing the software development cycle and accelerating delivery
- Expanding market for streamlining cooperation between IT and operation teams
- Enterprises are increasingly focusing on reducing IT capital expenditure
- The rapid adoption of microservices and service virtualization
Market Restraints
- Limitation of standardized DevOps tools and solutions
- Difficulties in deploying the DevOps methods
- Security and compliance concerns
Market Opportunities
- Increasing adoption of automated processes in developing software
- The continuous transition to a hybrid cloud and increased operational efficiency
- Growing demand for AI and machine learning in DevOps
DevOps Market Report Coverage
| Market | DevOps Market |
| DevOps Market Size 2022 | USD 10,209 Million |
| DevOps Market Forecast 2032 | USD 55,316 Million |
| DevOps Market CAGR During 2023 - 2032 | 20.9% |
| DevOps Market Analysis Period | 2020 - 2032 |
| DevOps Market Base Year |
2022 |
| DevOps Market Forecast Data | 2023 - 2032 |
| Segments Covered | By Component, By Deployment, By Enterprise Size, By End-Use, And By Geography |
| Regional Scope | North America, Europe, Asia Pacific, Latin America, and Middle East & Africa |
| Key Companies Profiled | Amazon Web Services, Inc., Eggplant Limited, CA Technologies (Broadcom), Google, LLC (Alphabet), Dell Technologies, Atlassian Corporation Plc., Cisco Systems, Inc., GitLab, Inc., Microsoft Corporation, Micro Focus International plc, IBM Corporation, and Oracle Corporation. |
| Report Coverage |
Market Trends, Drivers, Restraints, Competitive Analysis, Player Profiling, Covid-19 Analysis, Regulation Analysis |
DevOps Market Insights
Various sectors of the economy, ranging from retailing to entertainment to finance, are shifting toward the deployment of automation tools, which are more precise, cost-effective, and require less maintenance than traditional ways. In addition, emerging technologies such as artificial intelligence (AI) and deep learning (DL) are increasing the DevOps market size. Machine learning and artificial intelligence evaluate huge amounts of data and help with menial tasks, allowing IT experts to focus on more specific roles and discovering patterns, anticipating issues, and recommending solutions. Furthermore, the rising adoptions of agile techniques and cloud-based services, as well as corporate modernization to automate business activities, are significant factors driving global DevOps market revenue.
Furthermore, as the internet of things (IoT) has increased in popularity, DevOps has gained favor due to the infrastructure and integrated applications running on it being interdependent. Aside from that, DevOps faces several challenges in the implementation such as a lack of common categorization, a lack of a coherent framework of development and operations acceptability, and the need for customization for each deployment.
DevOps Market Segmentation
The worldwide market for DevOps is split based on component, deployment, enterprise size, end-use, and geography.
DevOps Market By Components
- Solutions
- Management DevOps
- Continuous Business Planning
- Testing and Development
- DevOps Analytics
- Operations DevOps
- Continuous Deployment
- Monitoring & Performance Management
- Delivery DevOps
- Continuous Integration
- Software Delivery Management
- Management DevOps
- Services
- Professional Services
- Managed Services
According to DevOps industry analysis, based on the components, the solution segment accounted for the biggest market share in 2023, owing to its rapid development pace, adaptability, and agility functionality. The solution category is divided into three subcategories: management DevOps, operations DevOps, and delivery DevOps. Demand for DevOps management solutions has expanded as the use of automation developing and testing tools has grown. Organizations are increasingly turning to analytics to improve software delivery workflows and gain valuable insight into automated testing data, and development and operations data analysis is gaining acceptance throughout the industry.
DevOps Market By Deployments
- On-premise
- Cloud
Based on deployment type, the cloud segment is likely to dominate the forecasting market. The cloud-based solution allows for the global sourcing of IT tasks in order to increase job productivity. Cloud computing is further classified into three types: private cloud, public cloud, and hybrid cloud. The public cloud offers remote access, ease of access, faster installation, and a variety of other organizational benefits such as flexibility and scalability, all of which contribute to its growing popularity. Cloud computing provides real-time, on-demand computer technology, machine learning, big data and analytics, information assurance, software development, and DevOps operations, as well as procedures. This centralized approach enables its customers to receive IT services that are agile, dynamic, and cost-effective.
DevOps Market By Enterprise Sizes
- Large Enterprises
- Small & Medium Enterprises
Based on the enterprise size, the large organization's segment is projected to hold the largest market share due to the high capital expenditure supporting the installation of DevOps systems and the increasing demand for good cooperation between computer programmers and IT departments. Cloud service providers and large IT organizations are encouraged to raise more in the development of operational processes and work to manage the software development process as part of their overall strategy. Large organizations were the first to encourage DevOps to increase performance and efficiency, shorten time to market, streamline operations, and minimize costs associated with IT activities such as application development, implementation, and maintenance.
DevOps Market By End-Uses
- Manufacturing
- Retail
- BFSI
- Government
- IT & Telecommunication
- Healthcare
- Others (Food & Beverages, Education, and Aerospace & Defense)
Based on application, the IT segment is predicted to grow at the fastest rate in the market over the devOps industry forecast period. The IT industry faces a number of challenges, including release timelines, quality control, and application downtime. DevOps technology and solutions are intended to boost company efficiency while also adapting to changing business requirements. As a result, they can successfully solve the challenges confronting the IT industry. In particular, the IT sector is adopting DevOps technology to automate application development, testing, and operations processes, thereby improving software quality, reducing delivery time, and improving user experience.
DevOps Market Regional Outlook
North America
- U.S.
- Canada
Europe
- U.K.
- Germany
- France
- Spain
- Rest of Europe
Asia-Pacific
- India
- Japan
- China
- Australia
- South Korea
- Rest of Asia-Pacific
Latin America
- Brazil
- Mexico
- Rest of Latin America
The Middle East & Africa
- South Africa
- GCC Countries
- Rest of the Middle East & Africa (ME&A)

DevOps Market Regional Analysis
In terms of DevOps market analysis, North America held the highest share of the global industry in 2023, owing to increased market acceptance of software automation tools used to generate successful outcomes across the financial services to retail industries, which spurred regional market expansion. Due to the increased demand for overall security, while operating physical, virtual, or cloud systems, the region's DevOps market has been growing. The presence of technologically advanced industrialized countries such as the United States and Canada, as well as the United States’ role as a prominent innovation hub for new technologies, is leading many organizations to use DevOps technology.
Furthermore, there is a high level of competition in this region, and the United States has major reference points in software and application development, which stimulates the implementation of DevOps technologies, which is expected to fuel market expansion in the devOps market forecast period.
DevOps Market Players
Some of the top DevOps companies offered in our report includes Amazon Web Services, Inc., Eggplant Limited, CA Technologies (Broadcom), Google, LLC (Alphabet), Dell Technologies, Atlassian Corporation Plc., Cisco Systems, Inc., GitLab, Inc., Microsoft Corporation, Micro Focus International plc, IBM Corporation, and Oracle Corporation.
Frequently Asked Questions
How big is the DevOps market?
The DevOps market size was valued at USD 10,209 million in 2023.
What is the CAGR of the global DevOps market from 2024 to 2032?
The CAGR of DevOps is 20.9% during the analysis period of 2024 to 2032.
Which are the key players in the DevOps market?
The key players operating in the global market are including ABB Group, Ametek Inc., ARC Systems, Inc., Asmo Co., Ltd., Baldor Electric Company, Inc., Brook Crompton UK Ltd., Dr. Fritz Faulhaber GmbH, Emerson Electric, Franklin Electric Co., Inc., Maxon Motors AG, Regal Beloit Corporation, Rockwell Automation, Inc., and Siemens AG.
Which region dominated the global DevOps market share?
North America held the dominating position in DevOps industry during the analysis period of 2024 to 2032.
Which region registered fastest CAGR from 2024 to 2032?
Asia-Pacific region exhibited fastest growing CAGR for market of DevOps during the analysis period of 2024 to 2032.
What are the current trends and dynamics in the global DevOps industry?
The current trends and dynamics in the DevOps industry include rising need for minimizing the software development cycle and accelerating delivery, expanding market for streamlining cooperation between IT and operation teams, enterprises are increasingly focusing on reducing IT capital expenditure, and the rapid adoption of microservices and service virtualization.
Which component held the maximum share in 2023?
The solutions component held the maximum share of the devOps industry.


