Defoamers Market | Acumen Research and Consulting
Defoamers Market Size - Global Industry, Share, Analysis, Trends and Forecast 2024 - 2032
Published :
Report ID:
Pages :
Format :
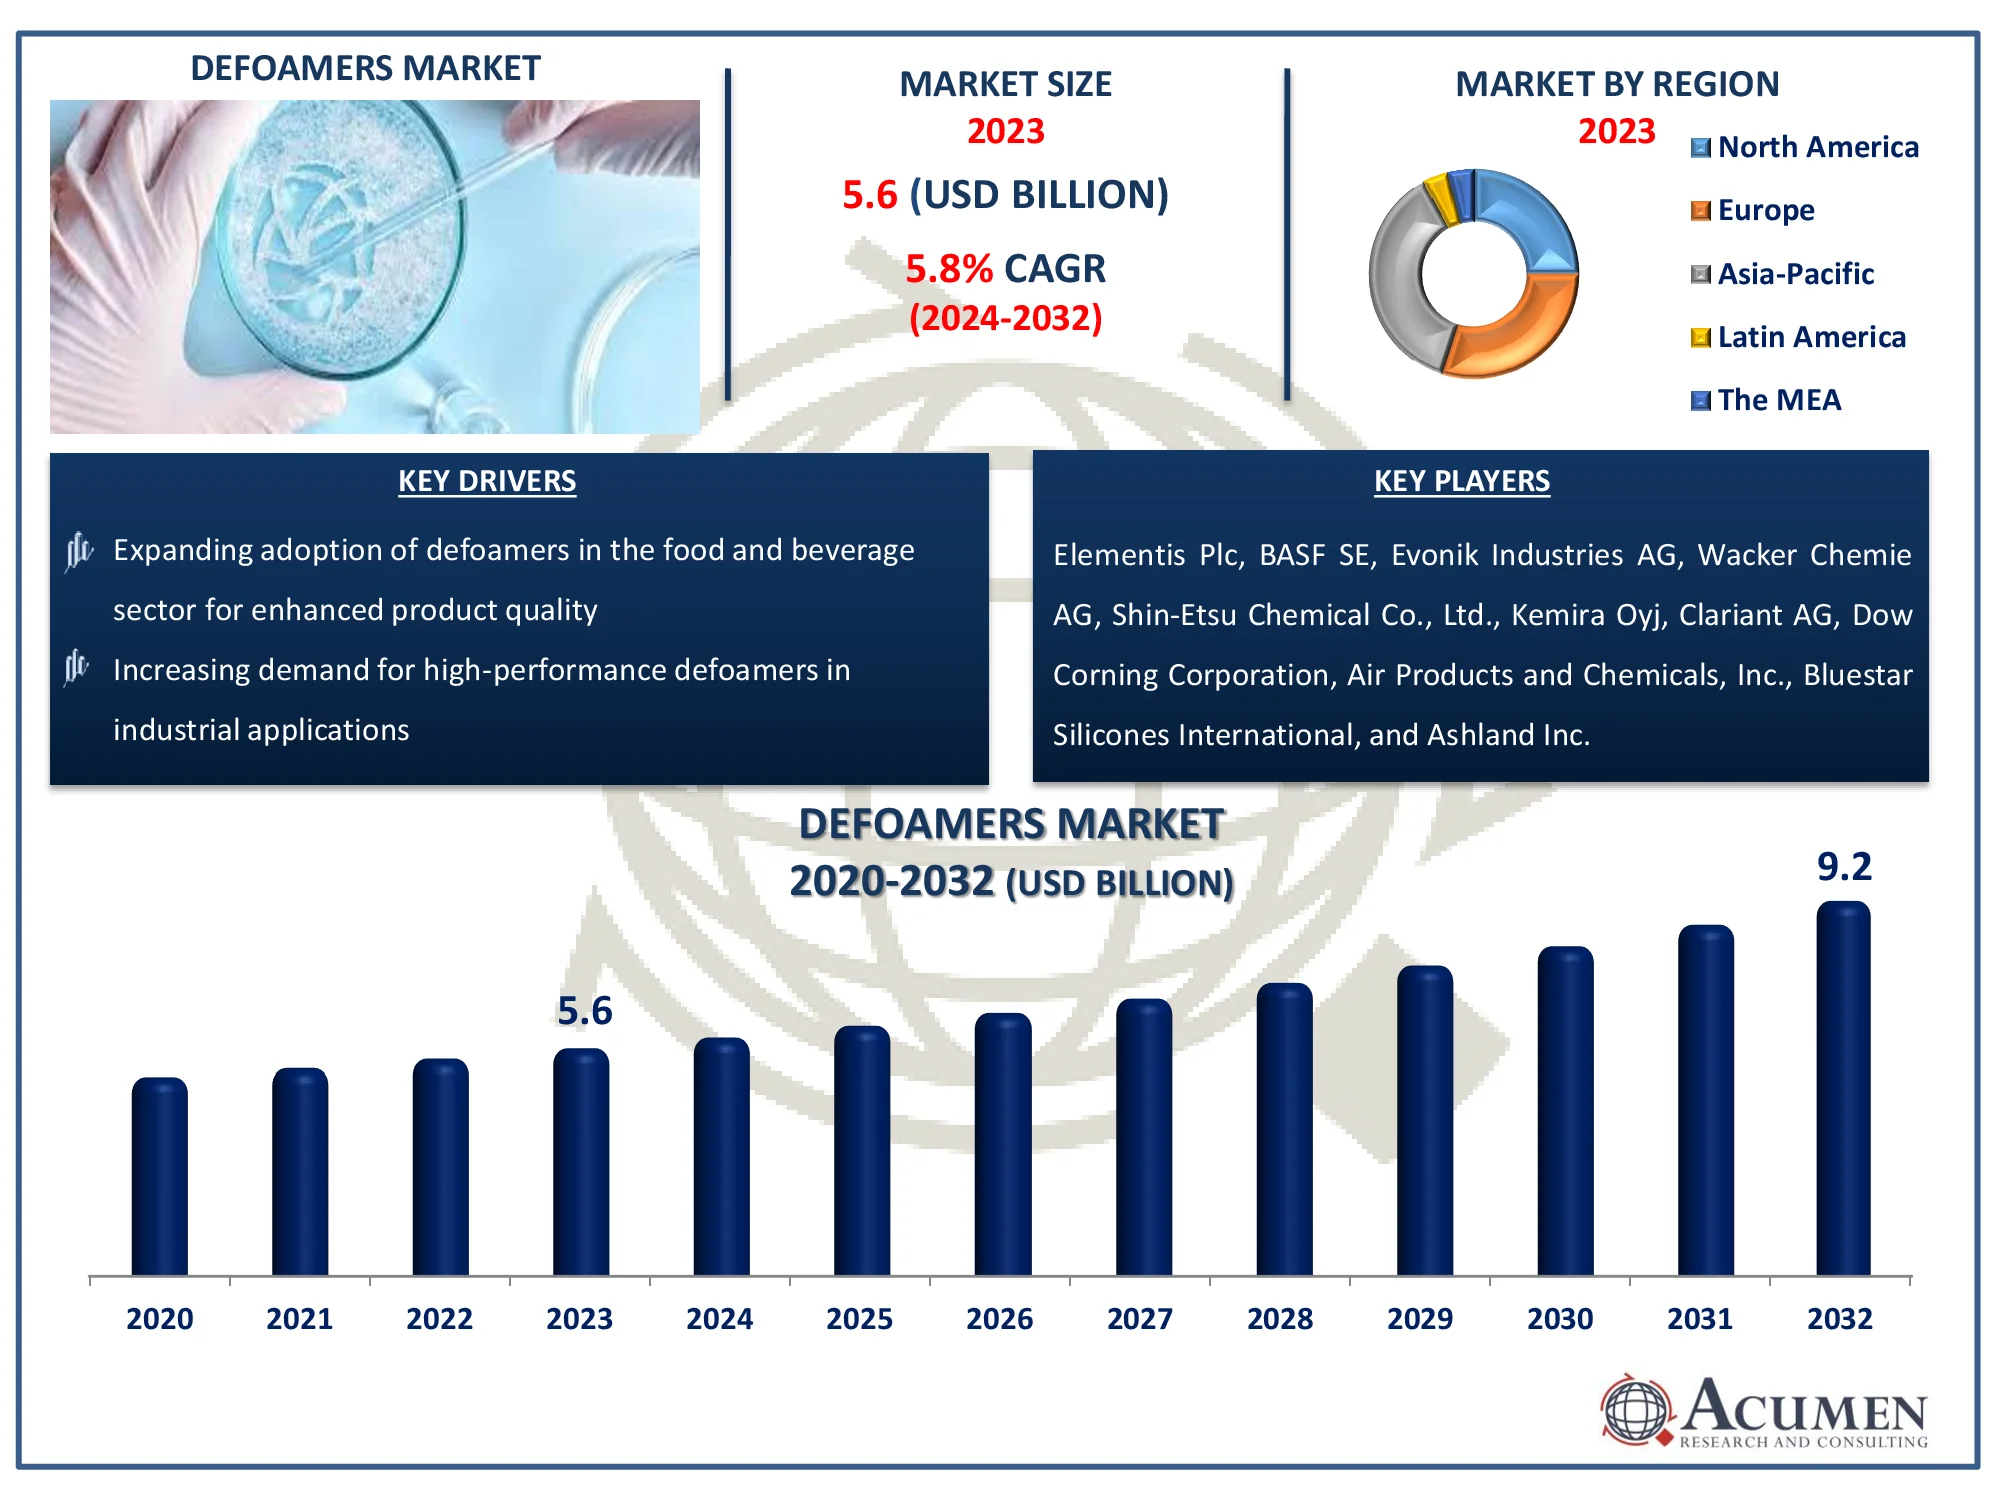
The Global Defoamers Market Size accounted for USD 5.6 Billion in 2023 and is estimated to achieve a market size of USD 9.2 Billion by 2032 growing at a CAGR of 5.8% from 2024 to 2032.
Defoamers Market Highlights
- Global defoamers market revenue is poised to garner USD 9.2 billion by 2032 with a CAGR of 5.8% from 2024 to 2032
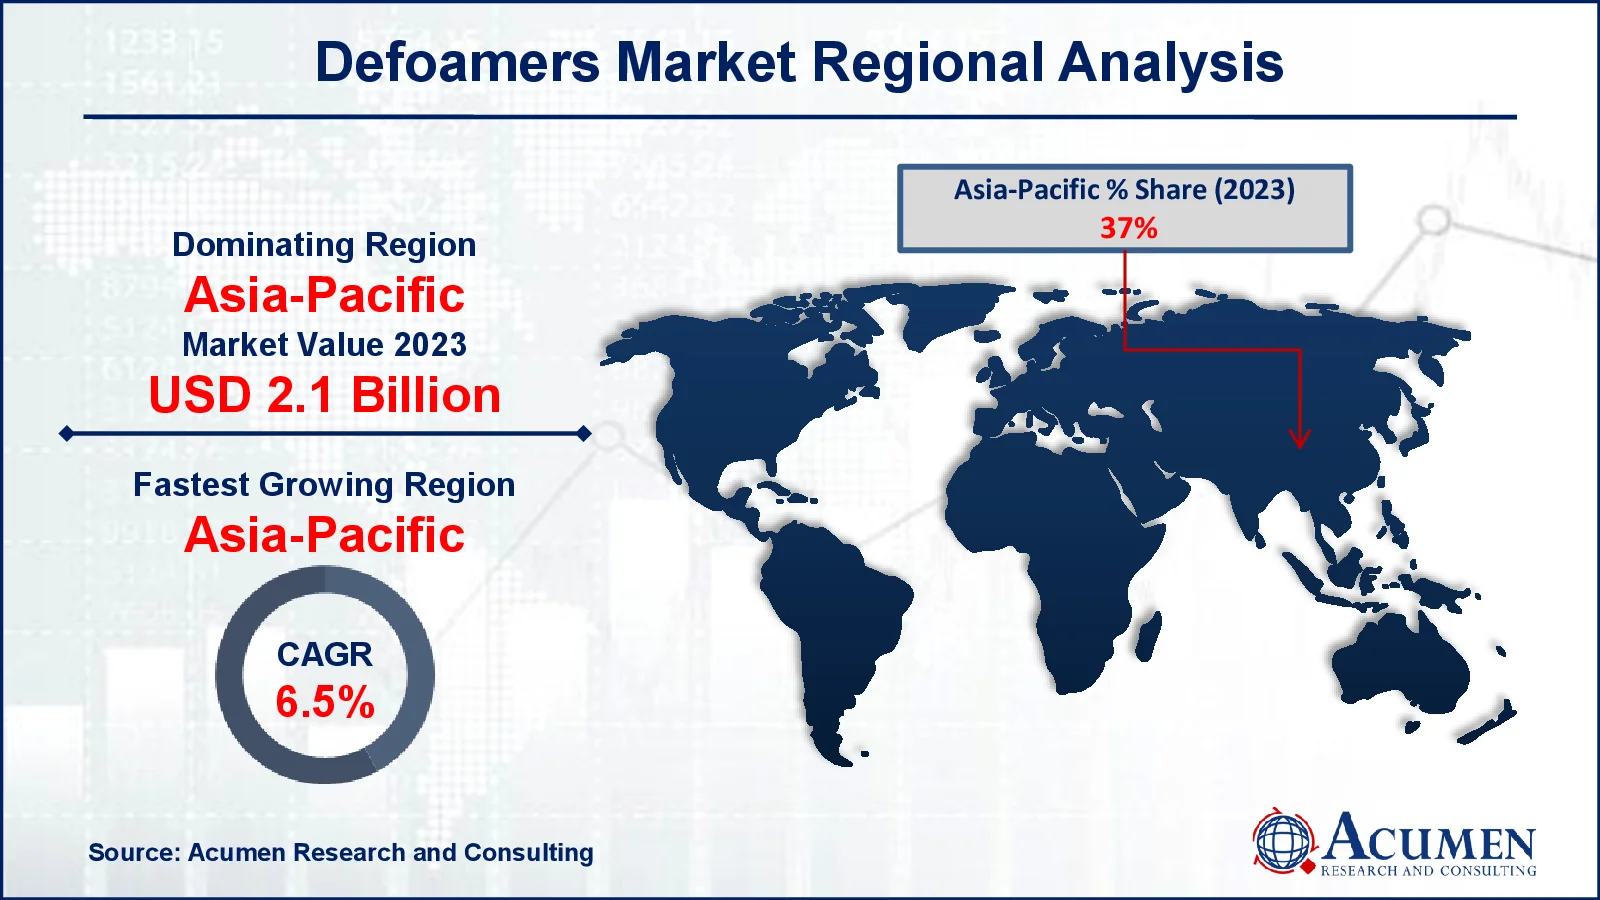
- Asia-Pacific defoamers market value occupied around USD 2.1 billion in 2023
- Asia-Pacific defoamers market growth will record a CAGR of more than 6.5% from 2024 to 2032
- Among product, the silicone based defoamers sub-segment generated 38% market share in 2023
- Based on end user industry, the paper & pulp sub-segment generated 29% defoamers market share in 2023
- Technological advancements in defoamer formulations for specialized applications is a popular defoamers market trend that fuels the industry demand

Defoamers are chemical additions that help reduce or prevent the production of foam in liquids. They work by breaking up the structure of foam bubbles, causing them to collapse. Foam can be an annoyance or even a concern in a variety of industrial and everyday uses. Silicone-based, alcohol-based, and mineral oil-based defoamers are some of the most common varieties. Each category has unique qualities and applications. Defoamers are normally introduced to liquids in small quantities, and their efficiency varies depending on the type of foam being treated, the concentration of defoamer, and the liquid's parameters (e.g., temperature, pH). Defoamers, by successfully breaking down foam bubbles, can increase efficiency, product quality, and safety in a variety sectors.
Global Defoamers Market Dynamics
Market Drivers
- Increasing demand for high-performance defoamers in industrial applications
- Rising focus on improving operational efficiency across end-use industries
- Growing use of water-based defoamers due to environmental regulations
- Expanding adoption of defoamers in the food and beverage sector for enhanced product quality
Market Restraints
- High cost of advanced defoamer formulations limits wider adoption
- Stringent environmental regulations regarding chemical defoamers
- Availability of alternative foam control solutions affecting market growth
Market Opportunities
- Development of bio-based defoamers to meet sustainability goals
- Increasing application of defoamers in emerging markets like Asia-Pacific
- Rising demand for defoamers in the pharmaceutical and personal care industries
Defoamers Market Report Coverage
|
Market |
Defoamers Market |
|
Defoamers Market Size 2023 |
USD 5.6 Billion |
|
Defoamers Market Forecast 2032 |
USD 9.2 Billion |
|
Defoamers Market CAGR During 2024 - 2032 |
5.8% |
|
Defoamers Market Analysis Period |
2020 - 2032 |
|
Defoamers Market Base Year |
2023 |
|
Defoamers Market Forecast Data |
2024 - 2032 |
|
Segments Covered |
By Product, By End User Industry, and By Geography |
|
Regional Scope |
North America, Europe, Asia Pacific, Latin America, and Middle East & Africa |
|
Key Companies Profiled |
Elementis Plc, BASF SE, Evonik Industries AG, Wacker Chemie AG, Shin-Etsu Chemical Co., Ltd., Kemira Oyj, Clariant AG, Dow Corning Corporation, Air Products and Chemicals, Inc., Bluestar Silicones International, and Ashland Inc. |
|
Report Coverage |
Market Trends, Drivers, Restraints, Competitive Analysis, Player Profiling, Covid-19 Analysis, Regulation Analysis |
Defoamers Market Insights
The defoamers market is driven by an increase in the utilization of defoamers in paper & pulp industry as well as in the water treatment industry. The rise in demand for defoamers from water treatment and paints & coatings industries is expected to drive the growth of defoamers market. Defoamers plays a significant role in the manufacturing and processing of liquid paints & coatings. They are very effective in the usage of coatings with brushes or other application techniques such as curtain coatings or spray coatings. Application of strict environmental regulations has replaced the solvent-based defoamers with water-based coating systems. Huge amounts of special surfactants are used in water-based coatings. This has augmented the need for highly effective defoamers. Extreme foam creation is expected to end in inadequacy; lengthy crushing time, storage uncertainty of paints and coatings formulation, and other concerns such as loss of grip, gloss lessening, and loss of opacity. High utilization of defoamers in the paints & coatings industry is projected to boost the defoamers market during the forecast period.
Defoamers are broadly used in the sugar beet industry. These defoamers are used in fried foods such as potato chips and several other snacks. These defoamers are used in the fast food industry for various food products such as fried chicken, french fries, and chicken nuggets. Silicone-based defoamers are used in most fizzy drinks and in various cooking oils to avoid bubbling, while deep frying. Defoamers can be used directly or combined in low foaming cleansing agents. The demand for defoaming agents in the food industry is anticipated to increase, as they control outpourings or bubbles during the preparation.
Defoamers Market Segmentation
The worldwide market for defoamers is split based on product, end user industry, and geography.
Defoamer Market By Product
- Oil Based Defoamers
- Water Based Defoamers
- Silicone Based Defoamers
- Others
According to defoamers industry analysis, silicone-based defoamers dominate the market due to its excellent performance in a wide range of industrial applications. These defoamers are highly recognized for their ability to withstand both high and low temperatures, making them excellent for usage in harsh situations such as chemical manufacture, water treatment, and food processing. Their unique ability to decrease foam formation while maintaining the chemical qualities of the products they are employed in contributes to their widespread popularity. Furthermore, silicone-based defoamers are non-reactive and provide long-lasting foam management, which is a fundamental reason for their widespread use in industries that require good performance over time.
Unlike oil- or water-based defoamers, silicone-based defoamers are more efficient at lower concentrations, lowering manufacturers' operational expenses. Silicone defoamers are also environmentally benign and non-toxic, which aligns with the growing regulatory emphasis on sustainability and safety. These facts, taken together, establish silicone-based defoamers as the market's leading sector, greatly contributing to overall growth.
Defoamer Market By End User Industry
- Paper & Pulp
- Water Treatment
- Paint & Coatings
- Food & Beverages
- Pharmaceuticals
- Oil & Gas
- Agrochemicals
- Chemical
- Metal Working
- Others
The paper & pulp industry leads the defoamers market due to its strong need for effective foam control agents. Foam generation is a chronic problem throughout the manufacturing process, particularly in pulp washing, bleaching, and paper machine operations. Excessive foam reduces machine performance, resulting in poor product quality and operating inefficiency. Defoamers serve an important role in reducing these issues by assuring smooth processing, improving drainage, and increasing product consistency.
Furthermore, the usage of environmentally benign, silicone-based defoamers has gained popularity, matching with the industry's shift toward sustainable operations. This advancement is critical for reducing the environmental effect associated with existing chemical defoamers. As a result, using defoamers at various phases of the paper production cycle is crucial for increasing productivity, minimizing downtime, and improving overall paper manufacturing efficiency. With continuing developments in defoamer formulations, the paper & pulp segment is projected to maintain its lead in the defoamers market forecast period.
Defoamers Market Regional Outlook
North America
- U.S.
- Canada
Europe
- U.K.
- Germany
- France
- Spain
- Rest of Europe
Asia-Pacific
- India
- Japan
- China
- Australia
- South Korea
- Rest of Asia-Pacific
Latin America
- Brazil
- Mexico
- Rest of LATAM
The Middle East & Africa
- South Africa
- GCC Countries
- Rest of the Middle East & Africa (ME&A)

Defoamers Market Regional Analysis
In terms of defoamers market analysis, the Asia-Pacific is expected to dominate the global defoamers industry owing to the extensive adoption of defoamers products in the automotive and consumer electronics industry. Countries such as China and Japan are expected to hold the largest share in the defoamers market in the Asia-Pacific region. Also, the developing countries such as India and China in the Asia-Pacific region are likely to create vast growth opportunities for the key manufacturers. This factor is projected to drive the growth during the defoamers industry forecast period.
In addition to that, the APAC region is expected to lead the global defoamers industry as China is expected to hold a significant share of the defoamers market due to the huge adoption of defoamers in paper & pulp industry, water treatment, and paints & coatings industries. Asia-Pacific region is a manufacturing hub of defoamers, and it accounts for one-third of the global production. Accessibility of raw materials for defoaming agents at low cost is projected to drive the growth of defoamers during the forecast period. Moreover, the key players are focusing on increasing their manufacturing facilities in the Asia-Pacific region in order to cater to the rising demand for defoamers from various end-use industries in the region. The industry in North America and Europe is expected to expand at a slow pace during the defoamers market forecast period.
Defoamers Market Players
Some of the top defoamers companies offered in our report include Elementis Plc, BASF SE, Evonik Industries AG, Wacker Chemie AG, Shin-Etsu Chemical Co., Ltd., Kemira Oyj, Clariant AG, Dow Corning Corporation, Air Products and Chemicals, Inc., Bluestar Silicones International, and Ashland Inc.
Frequently Asked Questions
How big is the defoamers market?
The defoamers market size was valued at USD 5.6 billion in 2023.
What is the CAGR of the global defoamers market from 2024 to 2032?
The CAGR of Defoamers is 5.8% during the analysis period of 2024 to 2032.
Which are the key players in the defoamers market?
The key players operating in the global market are including Elementis Plc, BASF SE, Evonik Industries AG, Wacker Chemie AG, Shin-Etsu Chemical Co., Ltd., Kemira Oyj, Clariant AG, Dow Corning Corporation, Air Products and Chemicals, Inc., Bluestar Silicones International, and Ashland Inc.
Which region dominated the global defoamers market share?
Asia-Pacific held the dominating position in defoamers industry during the analysis period of 2024 to 2032.
Which region registered fastest CAGR from 2024 to 2032?
Asia-Pacific region exhibited fastest growing CAGR for market of defoamers during the analysis period of 2024 to 2032.
What are the current trends and dynamics in the global defoamers industry?
The current trends and dynamics in the defoamers industry include increasing demand for high-performance defoamers in industrial applications, rising focus on improving operational efficiency across end-use industries, growing use of water-based defoamers due to environmental regulations, and expanding adoption of defoamers in the food and beverage sector for enhanced product quality.
Which end user Industry held the maximum share in 2023?
The paper & pulp end user industry held the maximum share of the defoamers industry.


