Dairy Alternatives Market | Acumen Research and Consulting
Dairy Alternatives Market Size - Global Industry, Share, Analysis, Trends and Forecast 2024 - 2032
Published :
Report ID:
Pages :
Format :
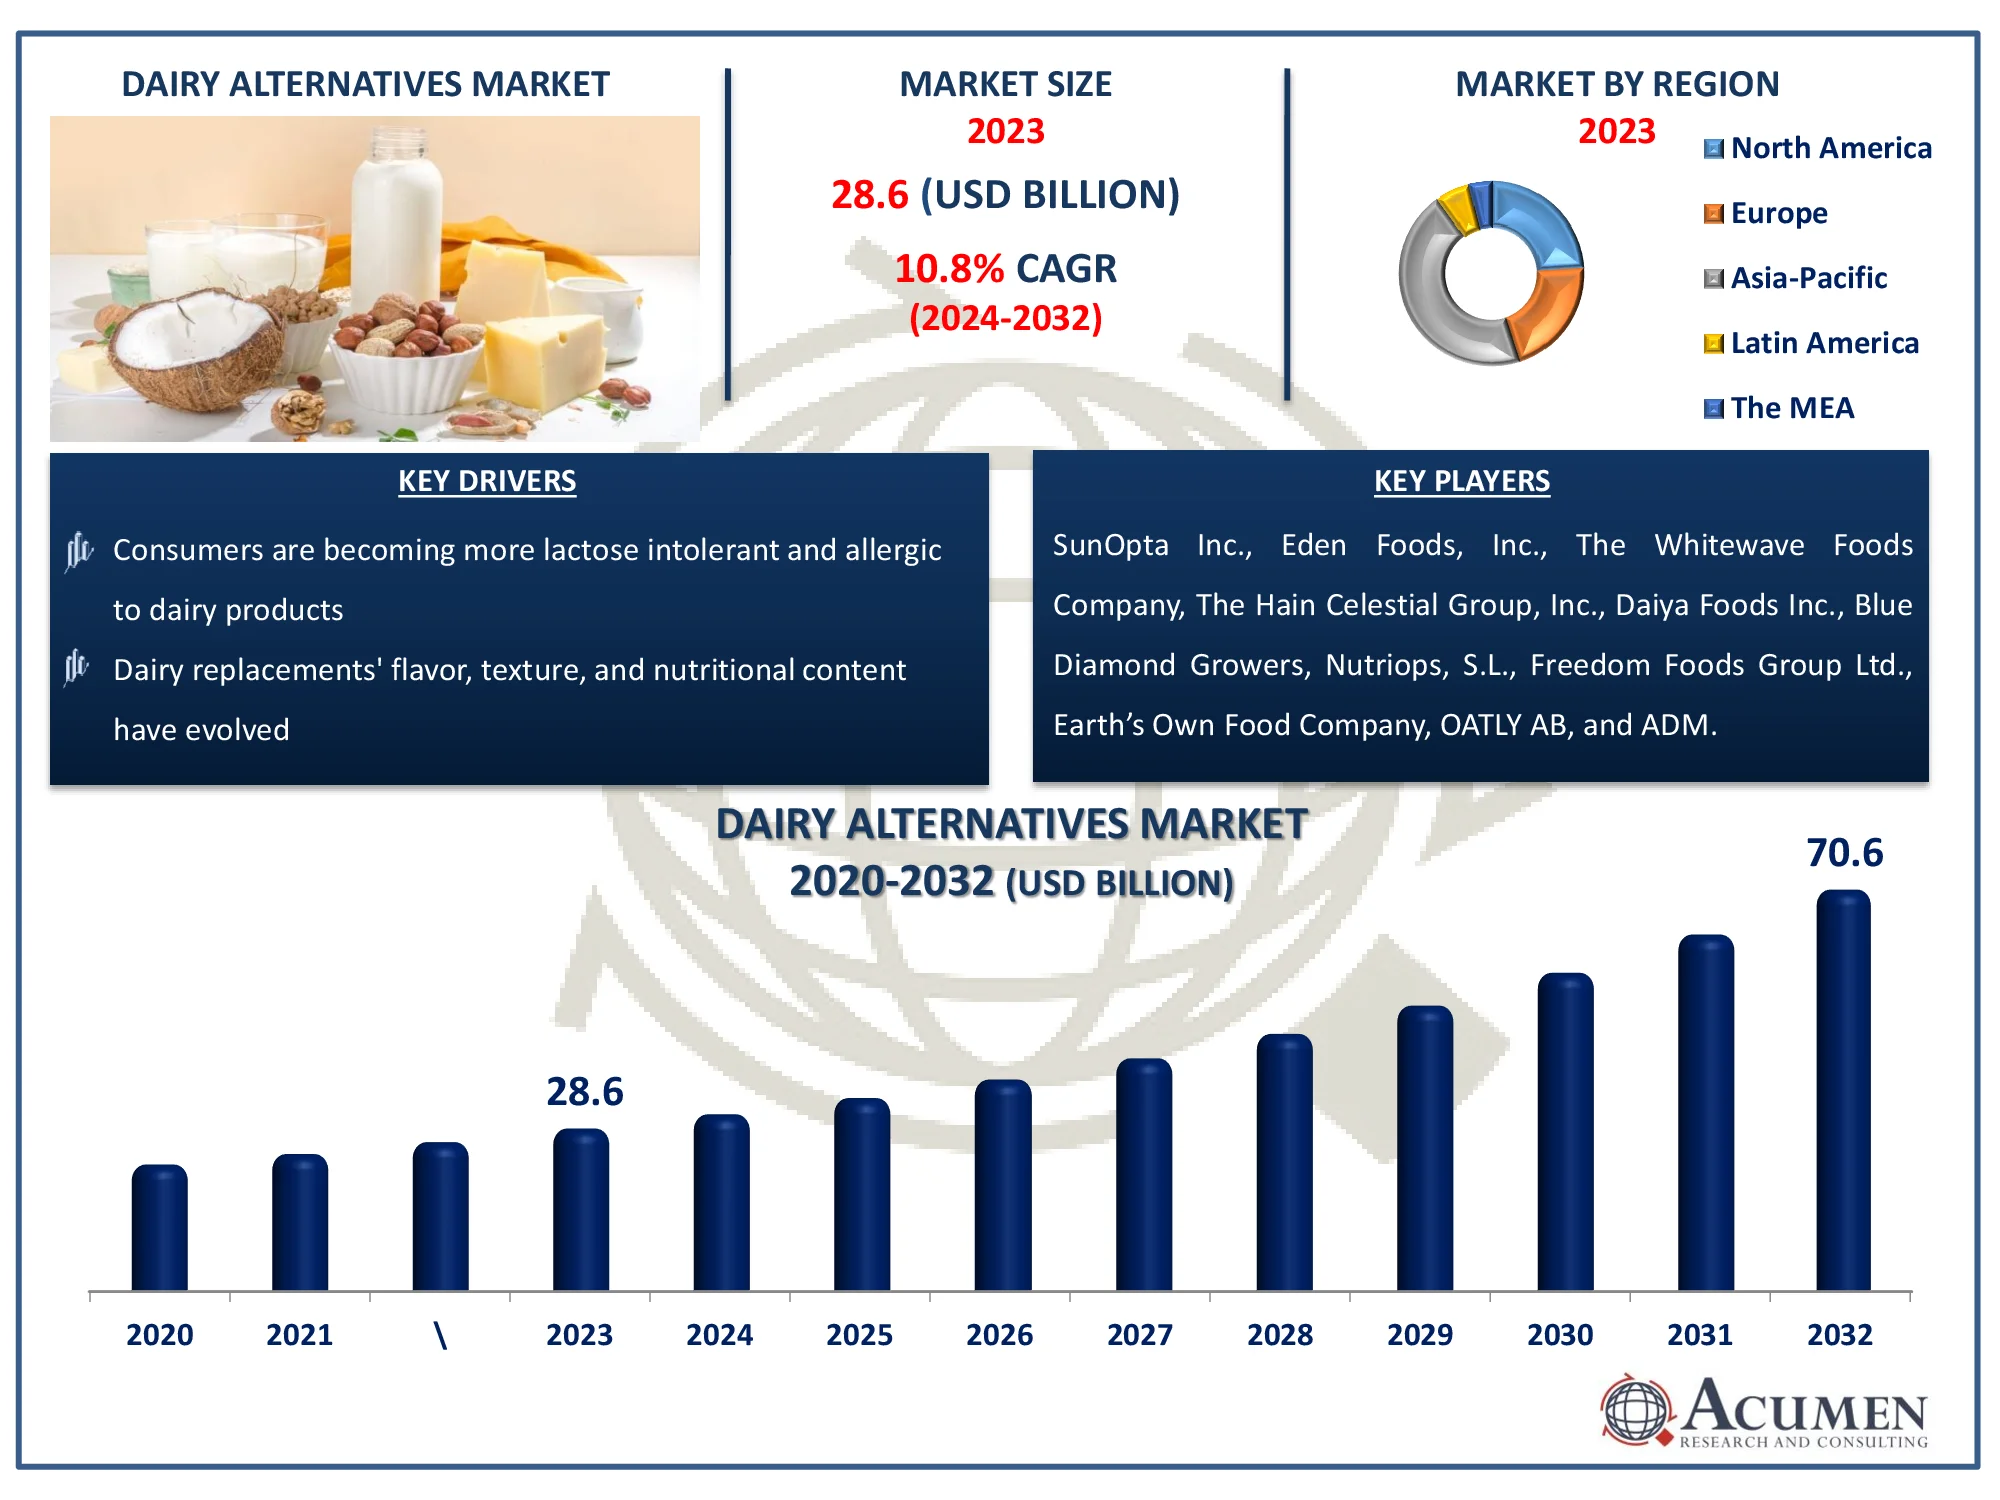
The Global Dairy Alternatives Market Size accounted for USD 28.6 Billion in 2023 and is estimated to achieve a market size of USD 70.6 Billion by 2032 growing at a CAGR of 10.8% from 2024 to 2032
Dairy Alternatives Market Highlights
- Global dairy alternatives market revenue is poised to garner USD 70.6 billion by 2032 with a CAGR of 10.8% from 2024 to 2032
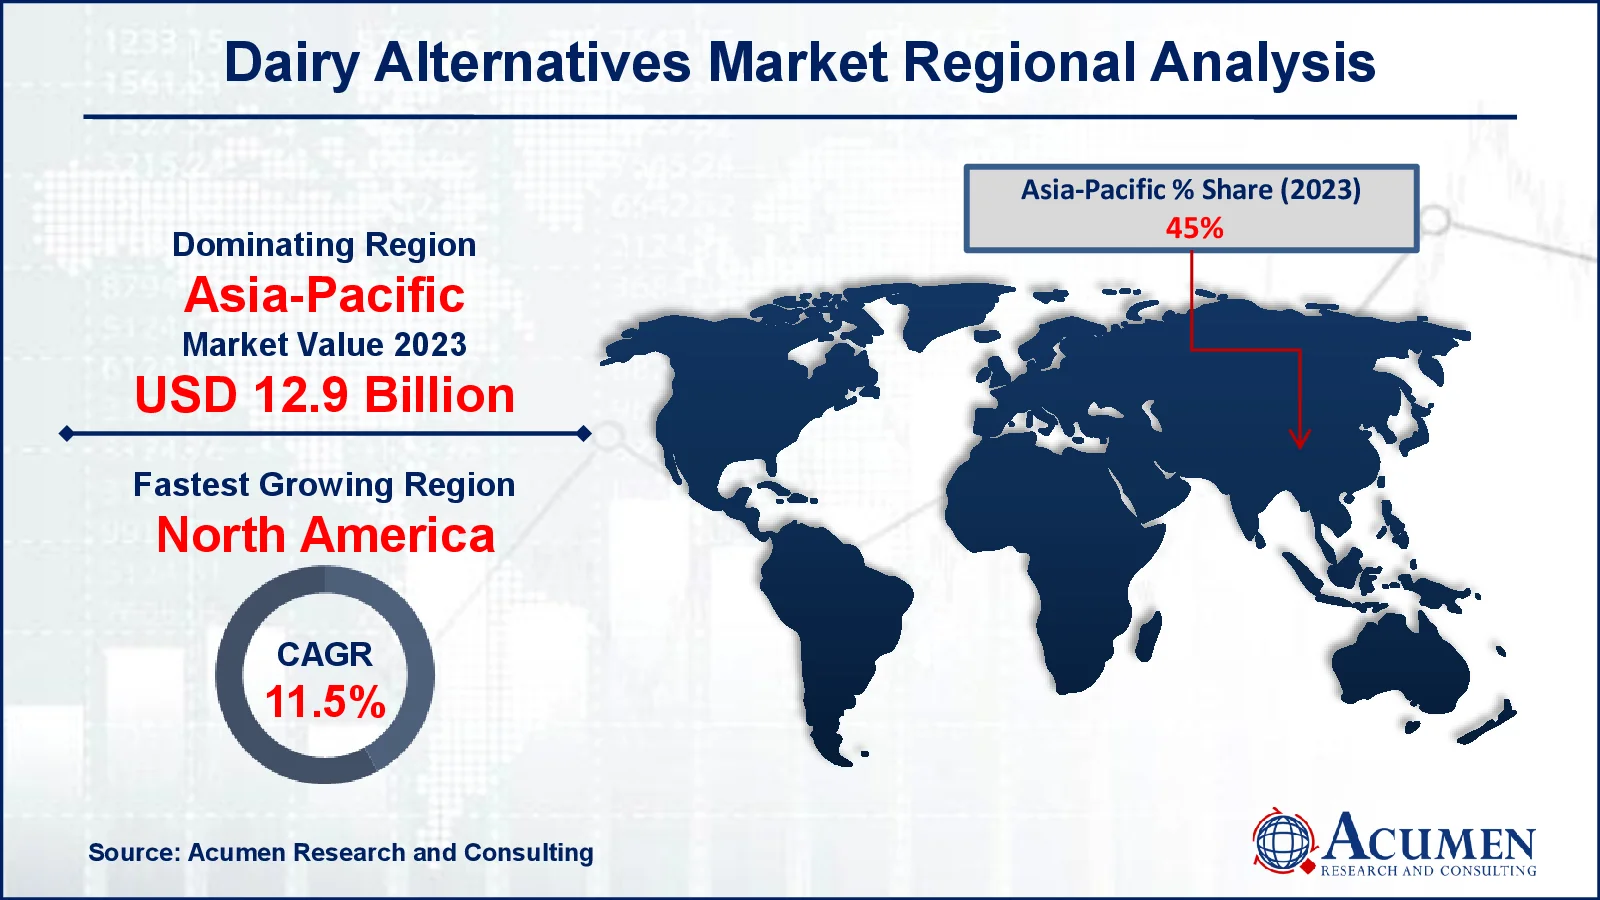
- Asia-Pacific dairy alternatives market value occupied around USD 12.9 billion in 2023
- North America dairy alternatives market growth will record a CAGR of more than 11.5% from 2024 to 2032
- Among product, the milk sub-segment generated more than USD 19.4 billion revenue in 2023
- Based on source, the soy sub-segment generated around 35% dairy alternatives market share in 2023
- E-commerce and online retail platforms are expanding to reach a larger audience is a popular dairy alternatives market trend that fuels the industry demand

Dairy alternatives are plant-based substitutes for traditional dairy products such as milk, cheese, yogurt, and butter. These substitutes are made from a range of substances, including as soy, almonds, oats, rice, and coconuts, and are acceptable for people who are lactose intolerant, allergic to dairy, or follow a vegan diet. They have a comparable taste and nutritional profile, and are frequently supplemented with vitamins such as B12 and D to replicate the benefits of dairy. Popular dairy replacements include almond milk, soy yogurt, and vegan cheeses. These goods are becoming increasingly popular as a result of rising health consciousness, environmental concerns, and dietary preferences, making them an important section of the food and beverage business.
Global Dairy Alternatives Market Dynamics
Market Drivers
- Consumers are becoming more lactose intolerant and allergic to dairy products
- Veganism and plant-based diets are becoming increasingly popular
- Environmental sustainability is becoming more widely understood
- Dairy replacements' flavor, texture, and nutritional content have evolved
Market Restraints
- Costs are higher than those for regular dairy products
- Some regions have a limited availability and shelf life
- Consumers want conventional dairy flavors and textures
Market Opportunities
- Expansion into emerging markets with increasing health consciousness
- The creation of new plant-based sources and formulations
- Increased supplementation with necessary foods such as protein and vitamins
Dairy Alternatives Market Report Coverage
| Market | Dairy Alternatives Market |
| Dairy Alternatives Market Size 2022 |
USD 28.6 Billion |
| Dairy Alternatives Market Forecast 2032 | USD 70.6 Billion |
| Dairy Alternatives Market CAGR During 2023 - 2032 | 10.8% |
| Dairy Alternatives Market Analysis Period | 2020 - 2032 |
| Dairy Alternatives Market Base Year |
2022 |
| Dairy Alternatives Market Forecast Data | 2023 - 2032 |
| Segments Covered | By Type, By Product, By Source, By Distribution Channel, And By Geography |
| Regional Scope | North America, Europe, Asia Pacific, Latin America, and Middle East & Africa |
| Key Companies Profiled | SunOpta Inc., Eden Foods, Inc., The Whitewave Foods Company, The Hain Celestial Group, Inc., Daiya Foods Inc., Blue Diamond Growers, Nutriops, S.L., Freedom Foods Group Ltd., Earth’s Own Food Company, OATLY AB, and ADM. |
| Report Coverage |
Market Trends, Drivers, Restraints, Competitive Analysis, Player Profiling, Covid-19 Analysis, Regulation Analysis |
Dairy Alternatives Market Insights
Expanding event of milk sensitivities among customers is probably going to be a key factor driving the market. Expanding fame of almond milk, inferable from high protein, fiber, lipids, and vitality content, is anticipated to drive its demand. Better taste and surface offered by almond milk instead of its partners is probably going to offer an upper hand for the item over the figure time frame. Moreover, almond milk controls pulse and offers advantages to heart, kidney, and skin, which is probably going to expand its notoriety over the dairy alternatives market forecast period.
The most widely recognized non-dairy item expended in the market is soy milk, which was additionally the biggest item portion in 2023. Soy milk contains isoflavones, which decrease the danger of bosom malignant growth and heart illnesses, and is probably going to pick up prominence, particularly among ladies and old purchasers. Soymilk contains different minerals, for example, press, calcium, phosphorous, zinc, sodium, potassium, and magnesium. The product is very famous among heart patients as it diminishes cholesterol levels. Also, soy milk contains an equivalent measure of proteins as that in cow milk and is low in calories contrasted with entire and skim milk. In this manner, developing utilization of soy milk is probably going to enlarge by and large industry demand.
Starter inquire about on organization execution in dairy options demonstrated that profits on soy, rice, and almond milk were around 6% higher than those on customary milk and milk products, which has caught the consideration of new businesses and nourishment organizations. Dairies in Europe are quickly getting to be pioneers in the market, particularly in Western Europe. The worldwide business is relied upon to develop at a noteworthy rate attributable to rising buyer demand for plant-inferred healthful dairy merchandise. Expanding buyer mindfulness in regards to wellbeing, alongside enhancing disposable income in nations, for example, Brazil, India, China, and Japan, is foreseen to goad utilization of soy milk, almond milk, coconut milk, and rice milk over the dairy alternatives industry forecast period.
Dairy Alternatives Market Segmentation
The worldwide market for dairy alternatives is split based on type, product, source, distribution channel, and geography.
Dairy Alternative Market By Types
- Flavored
- Plain
According to dairy alternatives industry analysis, plain has the most market share because of its versatility and general consumer appeal. Plain dairy alternatives, such as unsweetened almond milk or soy milk, are popular due to their neutral flavor, making them suitable for a variety of applications, including cooking and baking, as well as mixing with cereals or coffee. They appeal to health-conscious consumers who prefer products without additional sweeteners or tastes, which aligns with current trends toward clean labels and minimal processing. Furthermore, consumers with dietary restrictions or allergies typically choose plain dairy replacements, which add to their appeal. Plain's commercial supremacy originates from its widespread appeal across many demographics and usage contexts.
Dairy Alternative Market By Products
- Yogurt
- Milk
- Cheese
- Creamer
- Ice cream
- Others
As per the dairy alternatives market forecast, the milk industry dominates the industry throughout 2024 to 2032. This is partly owing to the popularity of plant-based milks like almond, soy, and oat milk among lactose intolerant people, vegans, and those looking for healthier options. It is widely used in everyday life, whether poured over cereal, stirred into coffee, or eaten on its own. Dairy-free milk has grown in popularity because it tastes great, is widely available, and is commonly added with essential nutrients like calcium and vitamins. As more people become health-conscious and environmentally conscious, plant-based milk remains the most popular option in the dairy alternatives market.
Dairy Alternative Market By Sources
- Almond
- Soy
- Coconut
- Oats
- Rice
- Others
In the dairy alternatives market, the soy segment is the most profitable. Soy milk has been around for a long time and was one of the first plant-based milks to become popular. It's popular because it's high in protein, similar to cow's milk, and has a creamy texture that complements a variety of foods and beverages. Soy milk is also fairly priced and widely available, making it affordable to a large number of users. Furthermore, it is typically enriched with vitamins and minerals, making it a nutritious option. Soy's established presence, nutritional benefits, and versatility in cooking and baking help to justify its position as the main revenue producer in the dairy alternatives market.
Dairy Alternative Market By Distribution Channels
- Convenience Stores
- Supermarket & Hypermarkets
- Online retail
- Others
The supermarkets and hypermarkets segment generates the most revenue. This is because these stores sell a diverse selection of items under one roof, allowing customers to pick up their preferred dairy alternatives while doing their regular food shopping. Supermarkets and hypermarkets also have plenty of shelf space, allowing for a diverse range of brands and goods, from almond milk to vegan cheese. Their frequent promotions and reductions make these alternatives more inexpensive, drawing a larger audience. Furthermore, the considerable foot activity in these stores provides great product visibility and accessibility, making them the preferable location for acquiring dairy alternatives.
Dairy Alternatives Market Regional Outlook
North America
- U.S.
- Canada
Europe
- U.K.
- Germany
- France
- Spain
- Rest of Europe
Asia-Pacific
- India
- Japan
- China
- Australia
- South Korea
- Rest of Asia-Pacific
Latin America
- Brazil
- Mexico
- Rest of Latin America
The Middle East & Africa
- South Africa
- GCC Countries
- Rest of the Middle East & Africa (ME&A)

Dairy Alternatives Market Regional Analysis
In terms of dairy alternatives market analysis, as far as region, Asia-Pacific represented the biggest offer in 2023. Extending populace and rising dispensable salaries in developing nations, for example, India and China are relied upon to enlarge product demand in the district. Soy, rice, and almond milk are fundamentally devoured as conventional refreshments in Asia Pacific. The local market is described by demand for without lactose milk for kids, lactating moms, and pregnant ladies. These dairy choices offer a wide scope of utilization in sans lactose products for grown-ups, in this way enhancing business sector prospects in Asia Pacific.
Dairy Alternatives Market Players
Some of the top dairy alternatives companies offered in our report includes SunOpta Inc., Eden Foods, Inc., The Whitewave Foods Company, The Hain Celestial Group, Inc., Daiya Foods Inc., Blue Diamond Growers, Nutriops, S.L., Freedom Foods Group Ltd., Earth’s Own Food Company, OATLY AB, and ADM.
Frequently Asked Questions
How big is the dairy alternatives market?
The dairy alternatives market size was valued at USD 28.6 billion in 2023.
What is the CAGR of the global dairy alternatives market from 2024 to 2032?
The CAGR of Dairy Alternatives is 10.8% during the analysis period of 2024 to 2032.
Which are the key players in the dairy alternatives market?
The key players operating in the global market are including SunOpta Inc., Eden Foods, Inc., The Whitewave Foods Company, The Hain Celestial Group, Inc., Daiya Foods Inc., Blue Diamond Growers, Nutriops, S.L., Freedom Foods Group Ltd., Earth’s Own Food Company, OATLY AB, and ADM.
Which region dominated the global dairy alternatives market share?
Asia-Pacific held the dominating position in dairy alternatives industry during the analysis period of 2024 to 2032.
Which region registered fastest CAGR from 2024 to 2032?
North America region exhibited fastest growing CAGR for market of dairy alternatives during the analysis period of 2024 to 2032.
What are the current trends and dynamics in the global dairy alternatives industry?
The current trends and dynamics in the dairy alternatives industry include consumers are becoming more lactose intolerant and allergic to dairy products, veganism and plant-based diets are becoming increasingly popular, environmental sustainability is becoming more widely understood, and dairy replacements' flavor, texture, and nutritional content have evolved.
Which product held the maximum share in 2023?
The milk product held the maximum share of the dairy alternatives industry.


