Cumene Market | Acumen Research and Consulting
Cumene Market Size - Global Industry, Share, Analysis, Trends and Forecast 2023 - 2032
Published :
Report ID:
Pages :
Format :
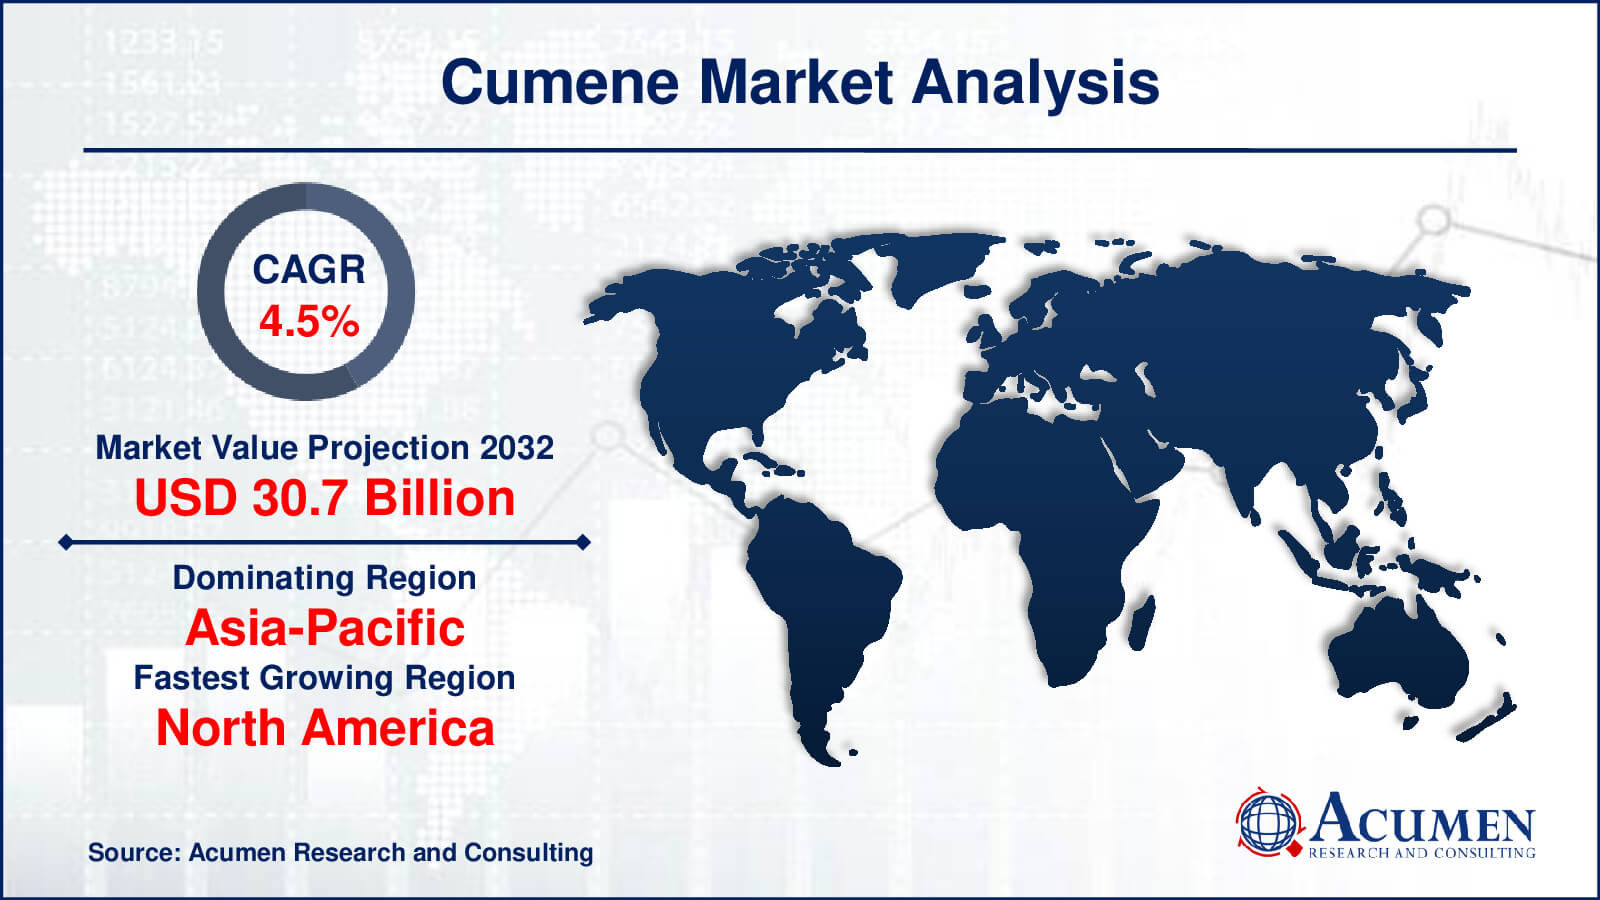
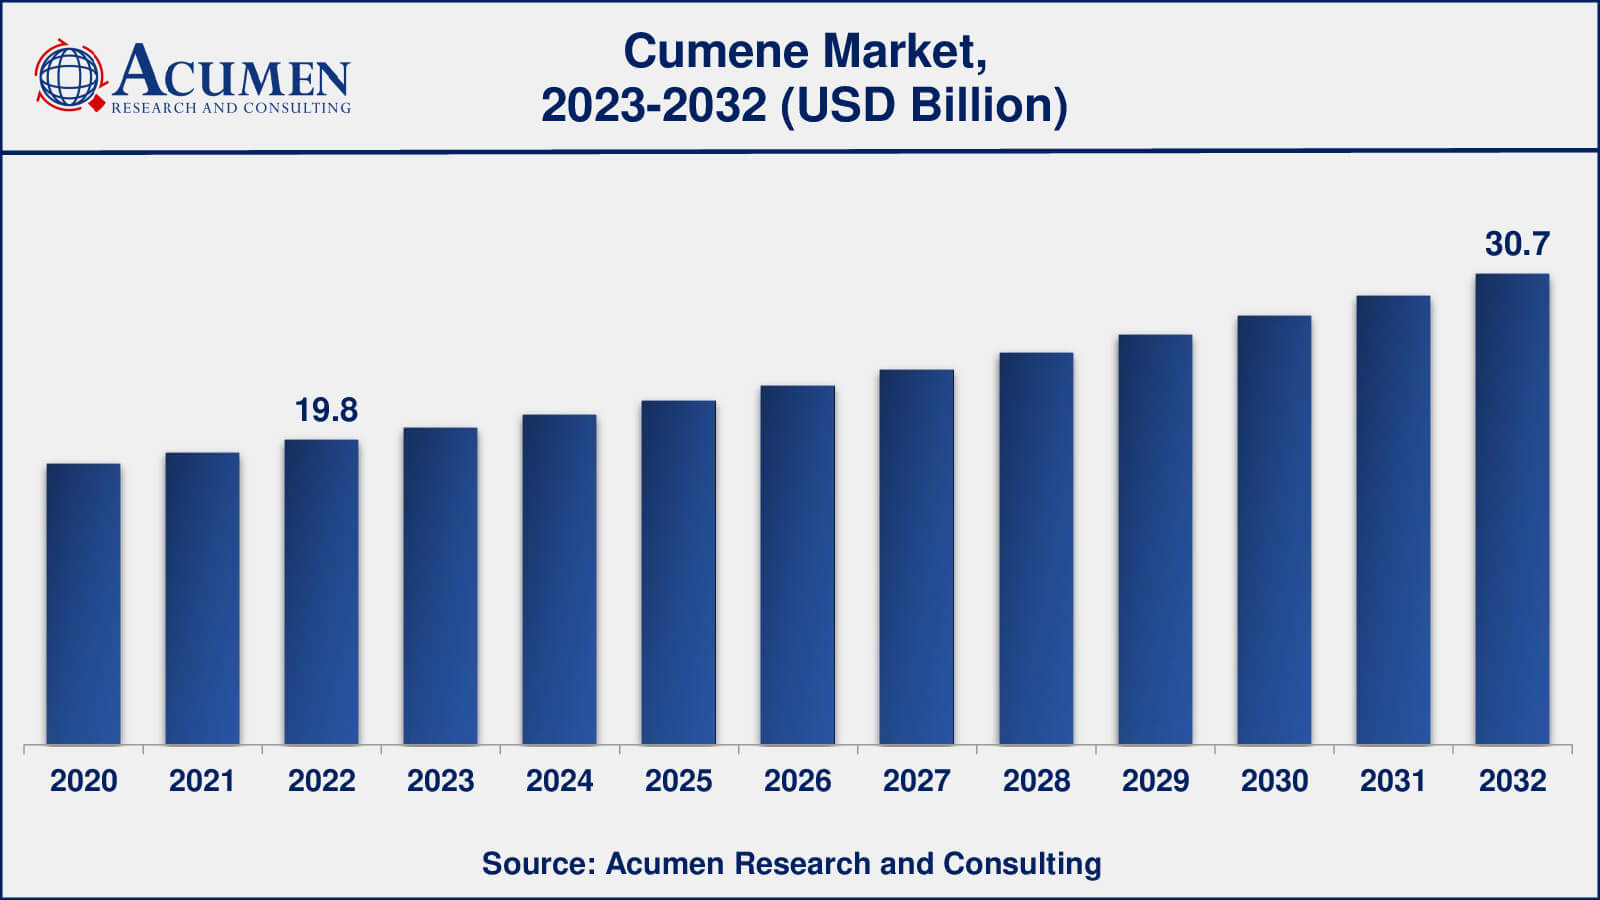
The Global Cumene Market Size accounted for USD 19.8 Billion in 2022 and is estimated to achieve a market size of USD 30.7 Billion by 2032 growing at a CAGR of 4.5% from 2023 to 2032.
Cumene Market Highlights
- Global cumene market revenue is poised to garner USD 30.7 billion by 2032 with a CAGR of 4.5% from 2023 to 2032
- Asia-Pacific cumene market value occupied around USD 9.7 billion in 2022
- North America cumene market growth will record a CAGR of more than 5% from 2023 to 2032
- Among production technology, the zeolite sub-segment generated over US$ 9.3 billion revenue in 2022
- Based on application, the phenol sub-segment generated around 52% share in 2022
- The rise in the demand for phenolic resins and bisphenol-A is a popular cumene market trend that fuels the industry demand
Cumene is a flammable organic compound, also known as isopropylbenzene. This compound is derived from an aromatic hydrocarbon with an aliphatic substitution. It is a major component of refined crude oil and fuels, and it is used in a wide range of engineering applications as a fundamental chemical compound for producing cumene hydroperoxide. This compound, in turn, yields two commercially important chemicals: phenol and acetone. Cumene finds use in fuel additives, enamels, lacquers, adhesives, sealants, high-octane production fuels, and as a solvent in paints. Cumene can be produced through various methods, including solid phosphoric acid, zeolite-based catalysts, and aluminum chloride.
Global Cumene Market Dynamics
Market Drivers
- Increasing demand for phenol from the plastic industry
- Increased utilization of cumene
- Rising demand of paint & enamels
Market Restraints
- Inhalation exposure to cumene may cause headaches, dizziness and other sickness
- Harmful effects due to extended exposure
- High material cost
Market Opportunities
- Rapid expansion of aviation industry
- Product innovations and developments
Cumene Market Report Coverage
| Market | Cumene Market |
| Cumene Market Size 2022 | USD 19.8 Billion |
| Cumene Market Forecast 2032 | USD 30.7 Billion |
| Cumene Market CAGR During 2023 - 2032 | 4.5% |
| Cumene Market Analysis Period | 2020 - 2032 |
| Cumene Market Base Year | 2022 |
| Cumene Market Forecast Data | 2023 - 2032 |
| Segments Covered | By Production Technology, By Application, By End-User, And By Geography |
| Regional Scope | North America, Europe, Asia Pacific, Latin America, and Middle East & Africa |
| Key Companies Profiled | Axiall Corporation, BASF SE, BP Plc., CPCC, Chang Chun Plastics Co. LTD., CNPC, Exxon Mobil Corporation, JX Nippon Oil & Energy, KenolKobil, KMG Chemicals, Royal Dutch Shell Plc., SABIC, Sumitomo Chemical Co., Ltd., Total S.A., and The Dow Chemical Company. |
| Report Coverage |
Market Trends, Drivers, Restraints, Competitive Analysis, Player Profiling, Covid-19 Analysis, Regulation Analysis |
Cumene Market Insights
The global cumene market is experiencing substantial growth opportunities globally, due to a surge in demand for acetone and phenol and their by-products. Moreover, overall economic growth, an increase in per capita disposable earnings, and a surge in the usage of bisphenol-A & phenolic resins are projected to propel the growth of this market throughout the forecast period. Furthermore, growth in demand for phenol in several industries such as laminates, composites, and plastics is expected to supplement the global market growth. Conversely, the hazardous health effects of cumene and volatile prices of crude oil may hinder the growth of the cumene market. Cumene may give a negative impact on the human body such as dizziness, headaches, minor in coordination, drowsiness, and unconsciousness. The central nervous system (CNS) of the human body cumene may have a depressive effect. These serious types of side effects will hamper the growth of the cumene market in future years. Development and product innovations will be the opportunity for the market. Improvement of products like the advancement of food grade cumene for polycarbonate bottles and containers which is plastic-based this will expand the opportunity for the growth of the market in upcoming years.
Cumene Market Segmentation
The worldwide market for cumene is split based on production technology, application, end-user, and geography.
Cumene Production Technologies
- Zeolite
- Solid Phosphoric Acid
- Aluminum Chloride
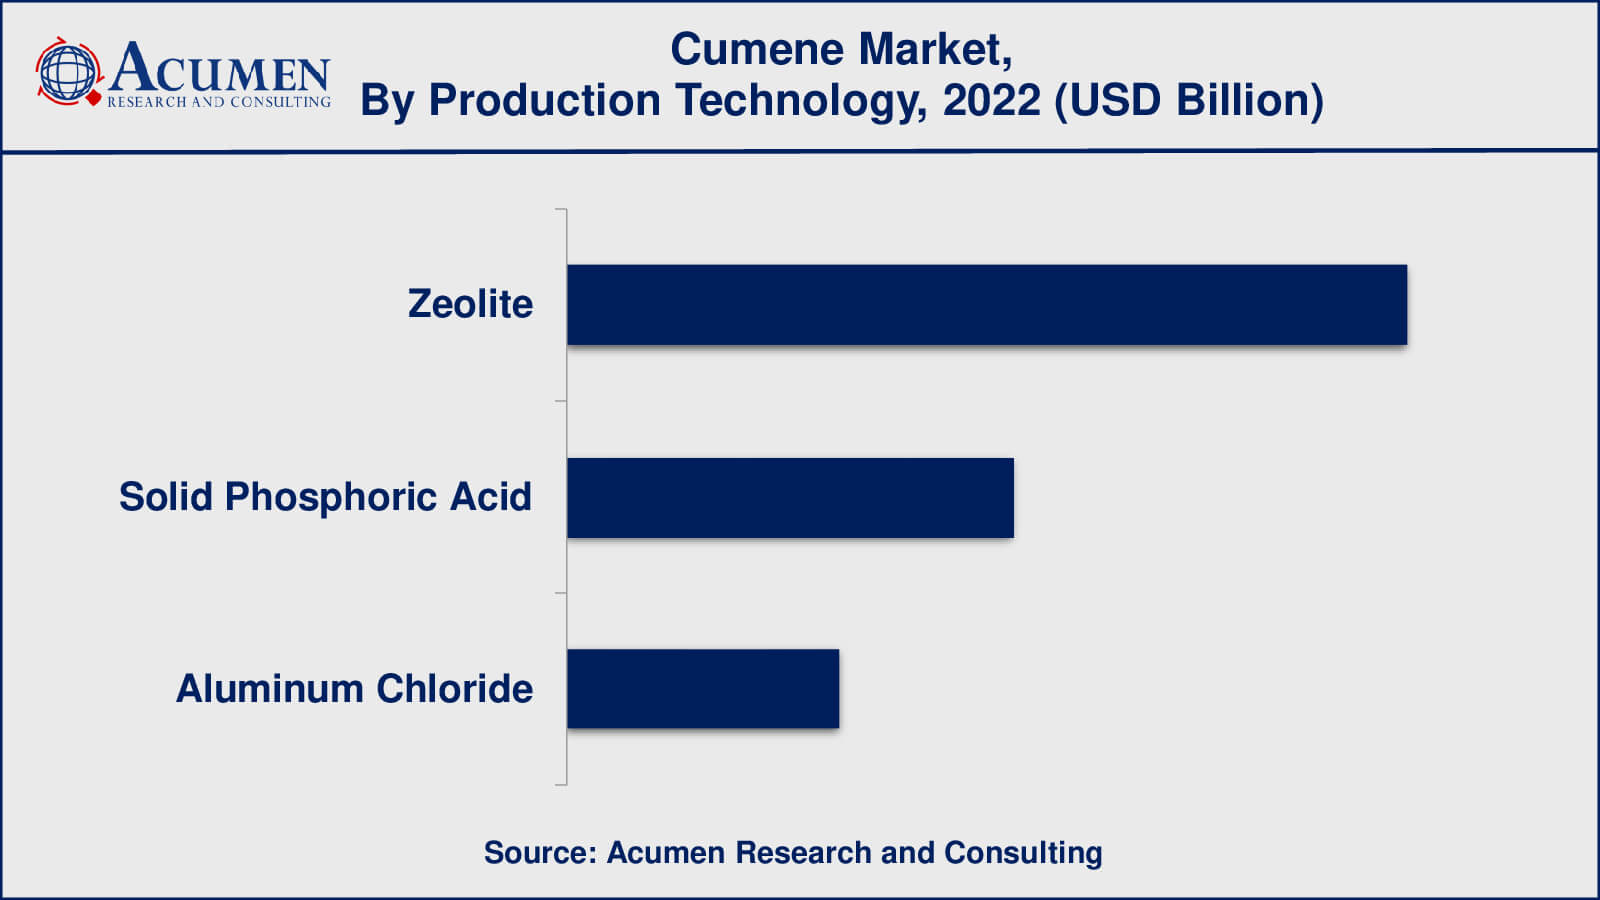
Based on the production technology the market is categorized into Zeolite, Solid Phosphoric Acid, and Aluminum Chloride. According to Cumene industry analysis, Zeolite has held the largest portion in the past years within the Production technology segment in recent years. In the cumene market, there is many negative factors of aluminum chloride and Solid Phosphoric Acid while the production process some factors are including environmental hazard, high corrosion, and catalyst non-renewability. Hence the use of zeolite is increasing during the projection period.
Cumene Applications
- Phenol
- Acetone
- Others (Blending Component, Solvent Etc.)
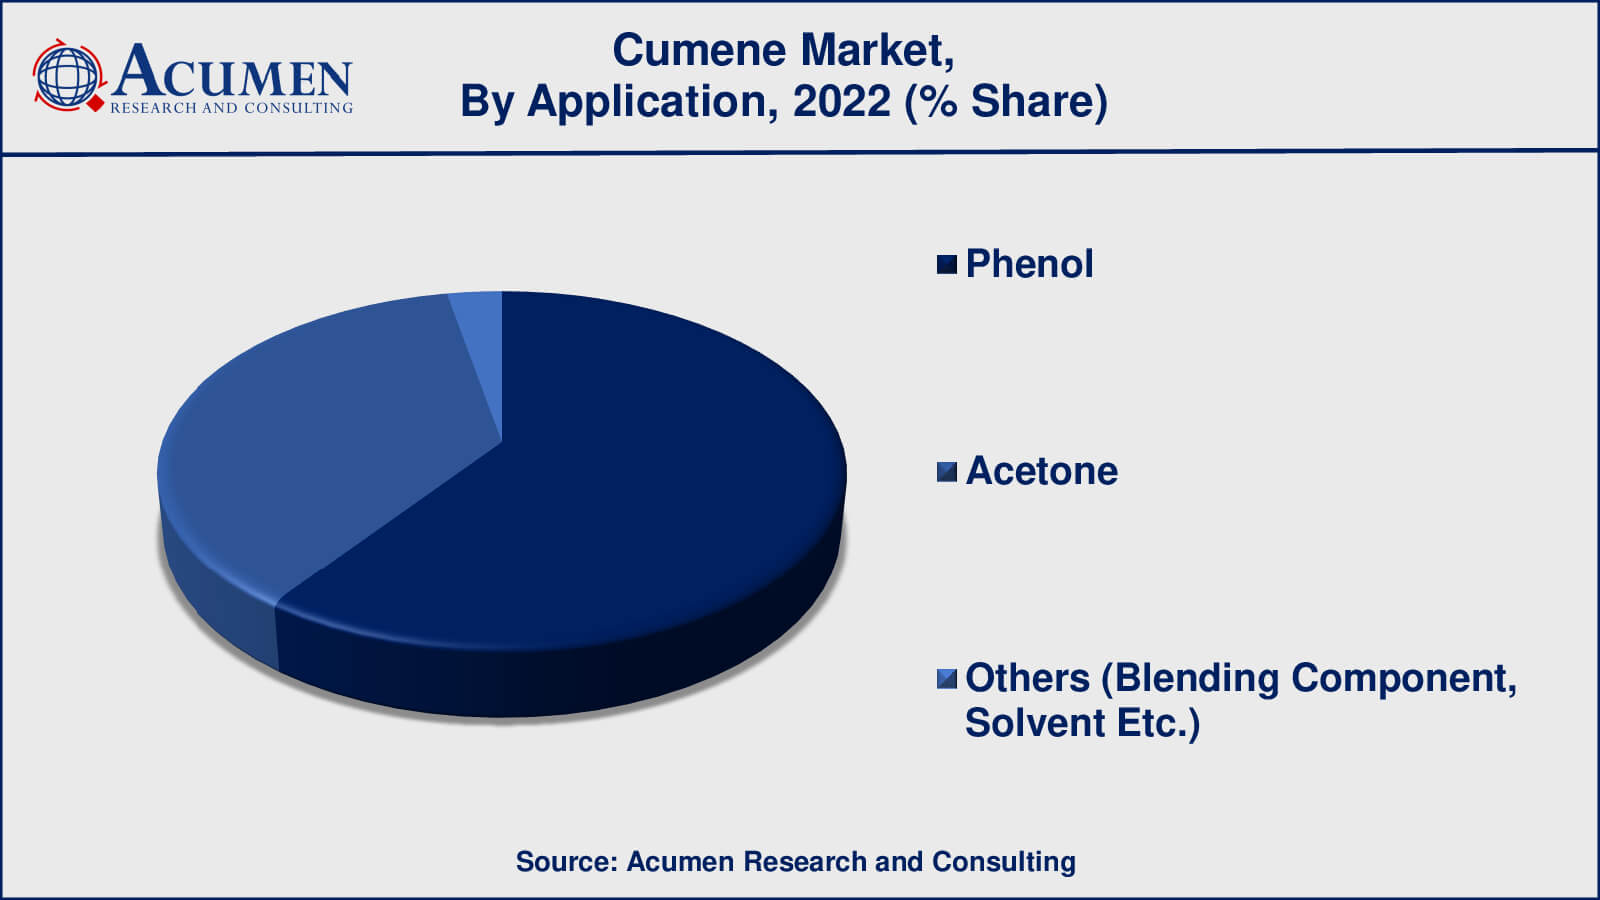
In terms of application, the cumene market is bifurcated into phenol, acetones, and others (blending component, solvent, etc.). In recent years, the phenol segment in Asia-Pacific held the highest market share in terms of volume and revenue and is anticipated to mirror this trend in years to come. In addition, Europe is estimated to witness the highest growth during the forecast period in terms of both value and volume from other application sectors. The growing population and need for cumene as a fuel additive is highly driving the growth of this market.
Cumene End-Users
- Plastics Industry
- Automotive Industry
- Chemical Industry
- Paint Industry
- Rubber Industry
- Others
On the basis of the end-user segment, the cumene market includes the plastics industry, automotive industry, chemical industry, paint industry, rubber industry, and others. According to the cumene market forecast, the plastics industry segments have dominated the market share and are likely to continue their dominance throughout the forecasted timeframe from 2023 to 2032. For the manufacture of plastics, there is a major use of phenols and acetone. Rising demand for plastics has been attribute to the increase of cumene in the market. This demand from the plastics industry sector has been a major driving force for the growth of the cumene market throughout the forecast period.
Cumene Market Regional Outlook
North America
- U.S.
- Canada
Europe
- U.K.
- Germany
- France
- Spain
- Rest of Europe
Asia-Pacific
- India
- Japan
- China
- Australia
- South Korea
- Rest of Asia-Pacific
Latin America
- Brazil
- Mexico
- Rest of Latin America
The Middle East & Africa
- South Africa
- GCC Countries
- Rest of the Middle East & Africa (ME&A)
Cumene Market Regional Analysis
In terms of regional segments, Asia-Pacific has consistently held the largest revenue share in the cumene market in recent years. This growth can be attributed to rising industries such as the automotive industry, consumer and cosmetics industry as well as increasing economies like China, India, and South Korea. The demand for cumene has risen due to the rising demand for paints & enamels, further bolstering market growth in the region.
North America is expected to follow closely behind with the second-largest revenue share in the cumene market. Due to an increase in the adoption of electronic technologies including laptops, gaming devices, and smartphones. Another hand growing disposable income is one of the key attributes of the market. The rising demand for phenol and acetone in Europe is expected to drive further growth in the market in the coming years.
Europe, on the other hand, is experiencing the anticipated fastest growth in the cumene market. A surge in the construction and building activities, coupled with increasing utilization of cumene is expected to be a key driver for market growth in the Europe region.
Cumene Market Players
Some of the top cumene companies offered in our report includes Axiall Corporation, BASF SE, BP Plc., CPCC, Chang Chun Plastics Co. LTD., CNPC, Exxon Mobil Corporation, JX Nippon Oil & Energy, KenolKobil, KMG Chemicals, Royal Dutch Shell Plc., SABIC, Sumitomo Chemical Co., Ltd., Total S.A., and The Dow Chemical Company.
Frequently Asked Questions
What was the market size of the global cumene in 2022?
The market size of cumene was USD 19.8 billion in 2022.
What is the CAGR of the global cumene market from 2023 to 2032?
The CAGR of cumene is 4.5% during the analysis period of 2023 to 2032.
Which are the key players in the cumene market?
The key players operating in the global market are including Axiall Corporation, BASF SE, BP Plc., CPCC, Chang Chun Plastics Co. LTD., CNPC, Exxon Mobil Corporation, JX Nippon Oil & Energy, KenolKobil, KMG Chemicals, Royal Dutch Shell Plc., SABIC, Sumitomo Chemical Co., Ltd., Total S.A., and The Dow Chemical Company.
Which region dominated the global cumene market share?
North America held the dominating position in cumene industry during the analysis period of 2023 to 2032.
Which region registered fastest CAGR from 2023 to 2032?
Asia-Pacific region exhibited fastest growing CAGR for market of cumene during the analysis period of 2023 to 2032.
What are the current trends and dynamics in the global cumene industry?
The current trends and dynamics in the cumene industry include rising demand of paint & enamels, increased utilization of cumenes, rise in the fashion industry, and growing demand for phenol and acetone.
Which production technology held the maximum share in 2022?
The zeolite production technology held the maximum share of the cumene industry.


