Crude Sulfate Turpentine Market Size - Global Industry, Share, Analysis, Trends and Forecast 2024 - 2032
Published :
Report ID:
Pages :
Format :
Crude Sulfate Turpentine Market Size - Global Industry, Share, Analysis, Trends and Forecast 2024 - 2032
Report Coverage
- Industry Dynamics
- Market Size and Forecast Data
- Segment Analysis
- Competitive Landscape
- Regional Analysis with a Niche Focus on Country-Level Data
- High Level Analysis - Porter's, PESTEL, Value Chain, etc.
- Company Profiles of Key Players
- Option to Customize the Report As Per Your Specific Need
Request Sample Report
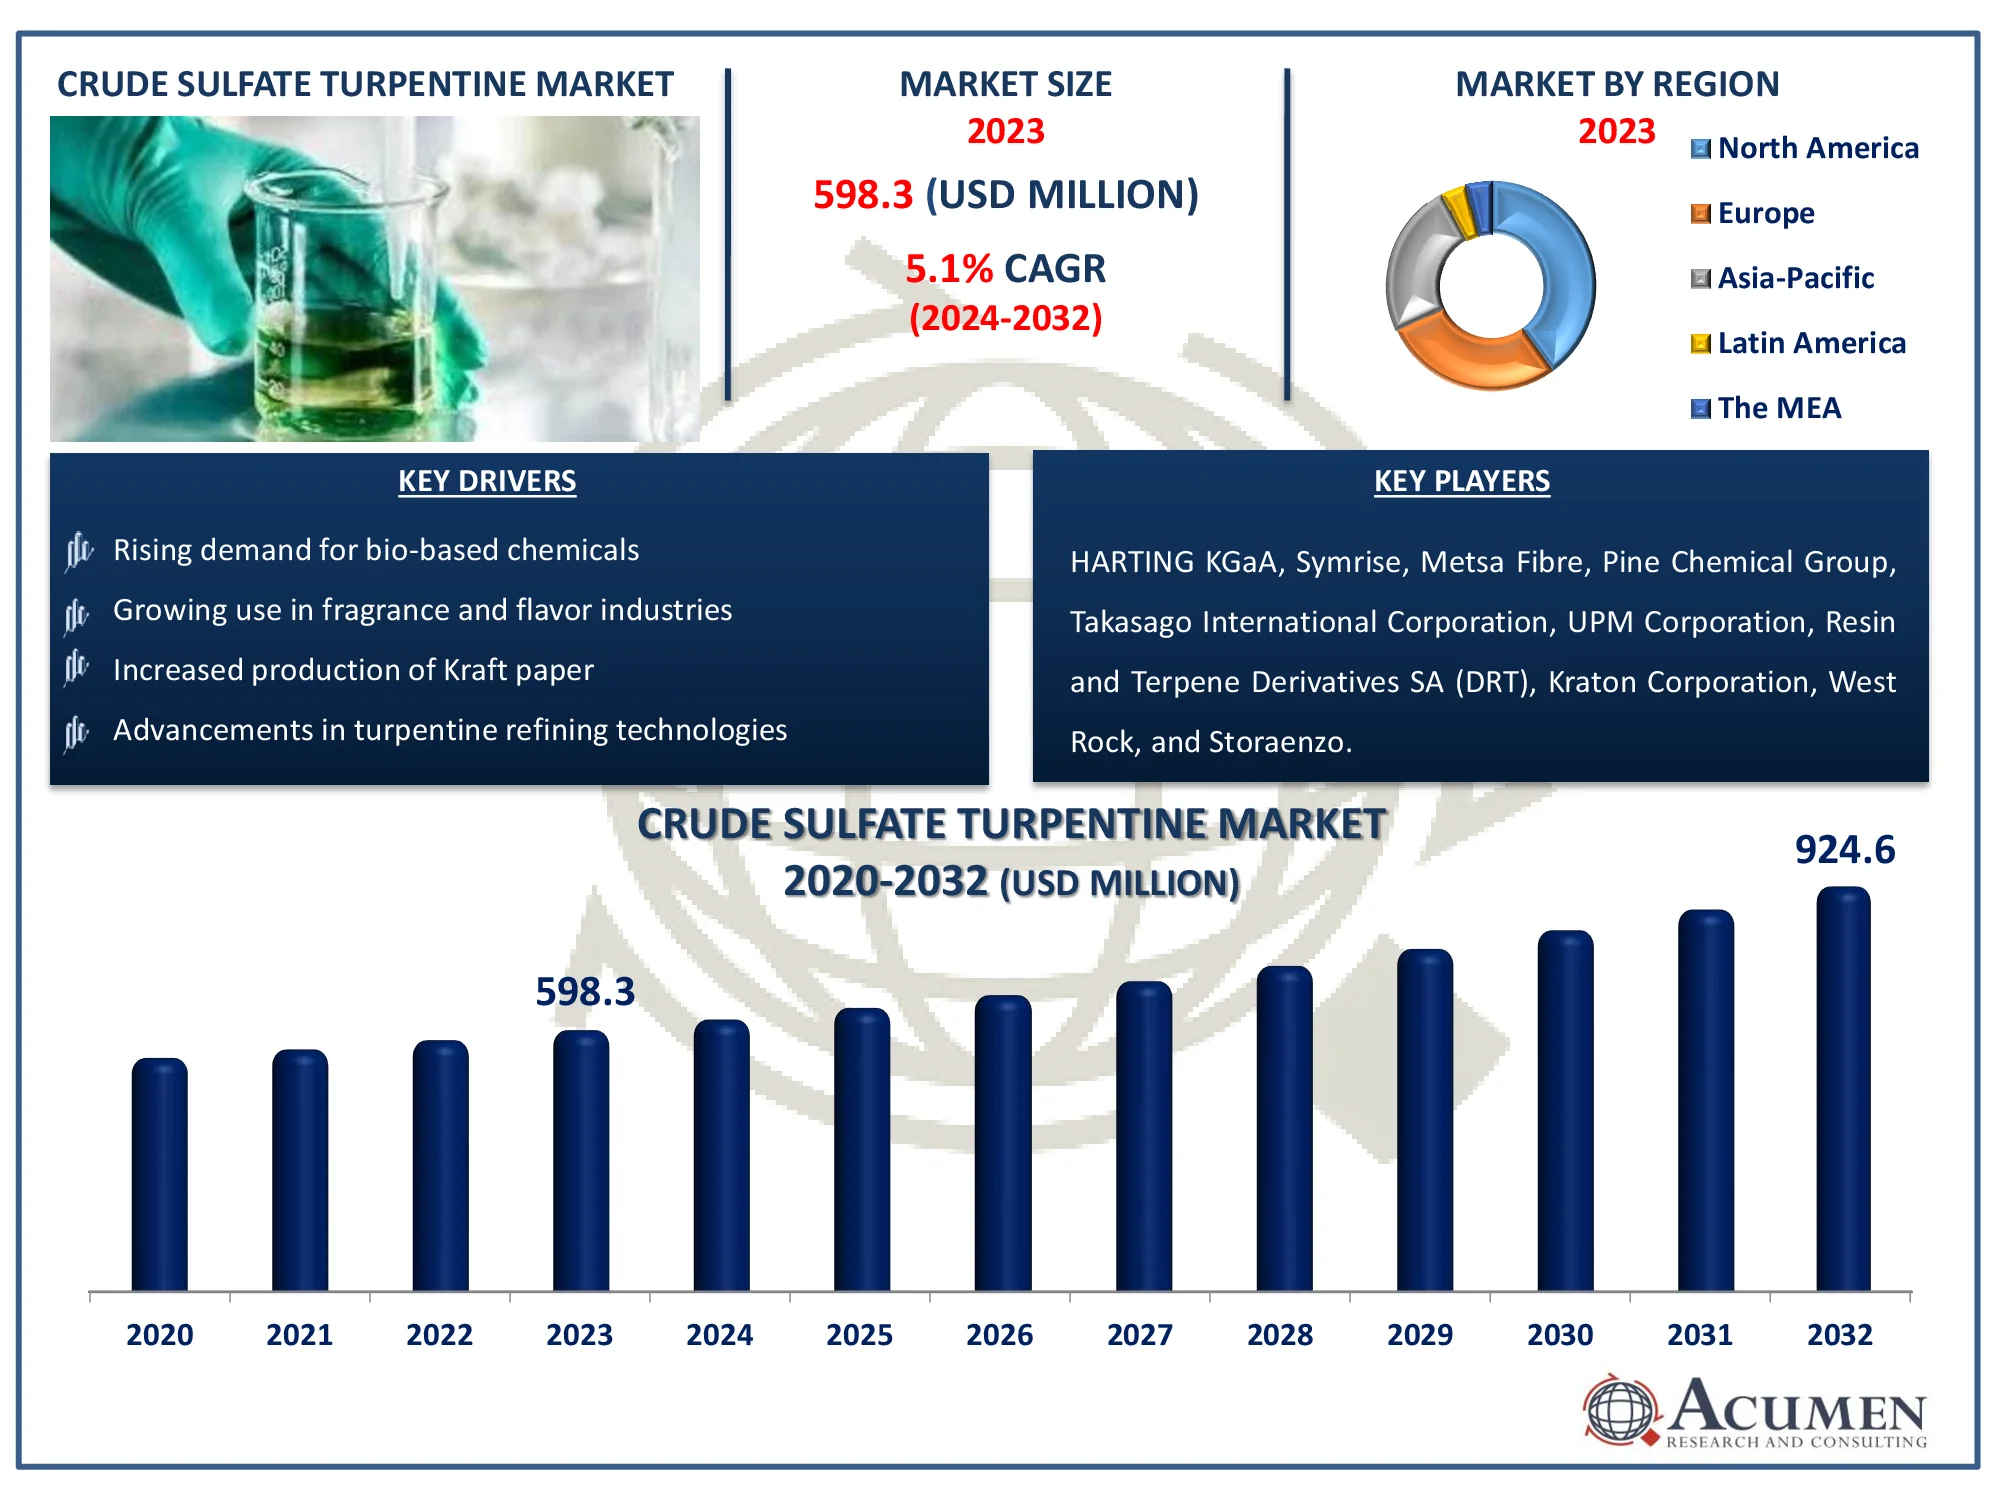
The Global Crude Sulfate Turpentine Market Size accounted for USD 598.3 Million in 2023 and is estimated to achieve a market size of USD 924.6 Million by 2032 growing at a CAGR of 5.1% from 2024 to 2032
Crude Sulfate Turpentine Market Highlights
- Global crude sulfate turpentine market revenue is poised to garner USD 924.6 million by 2032 with a CAGR of 5.1% from 2024 to 2032
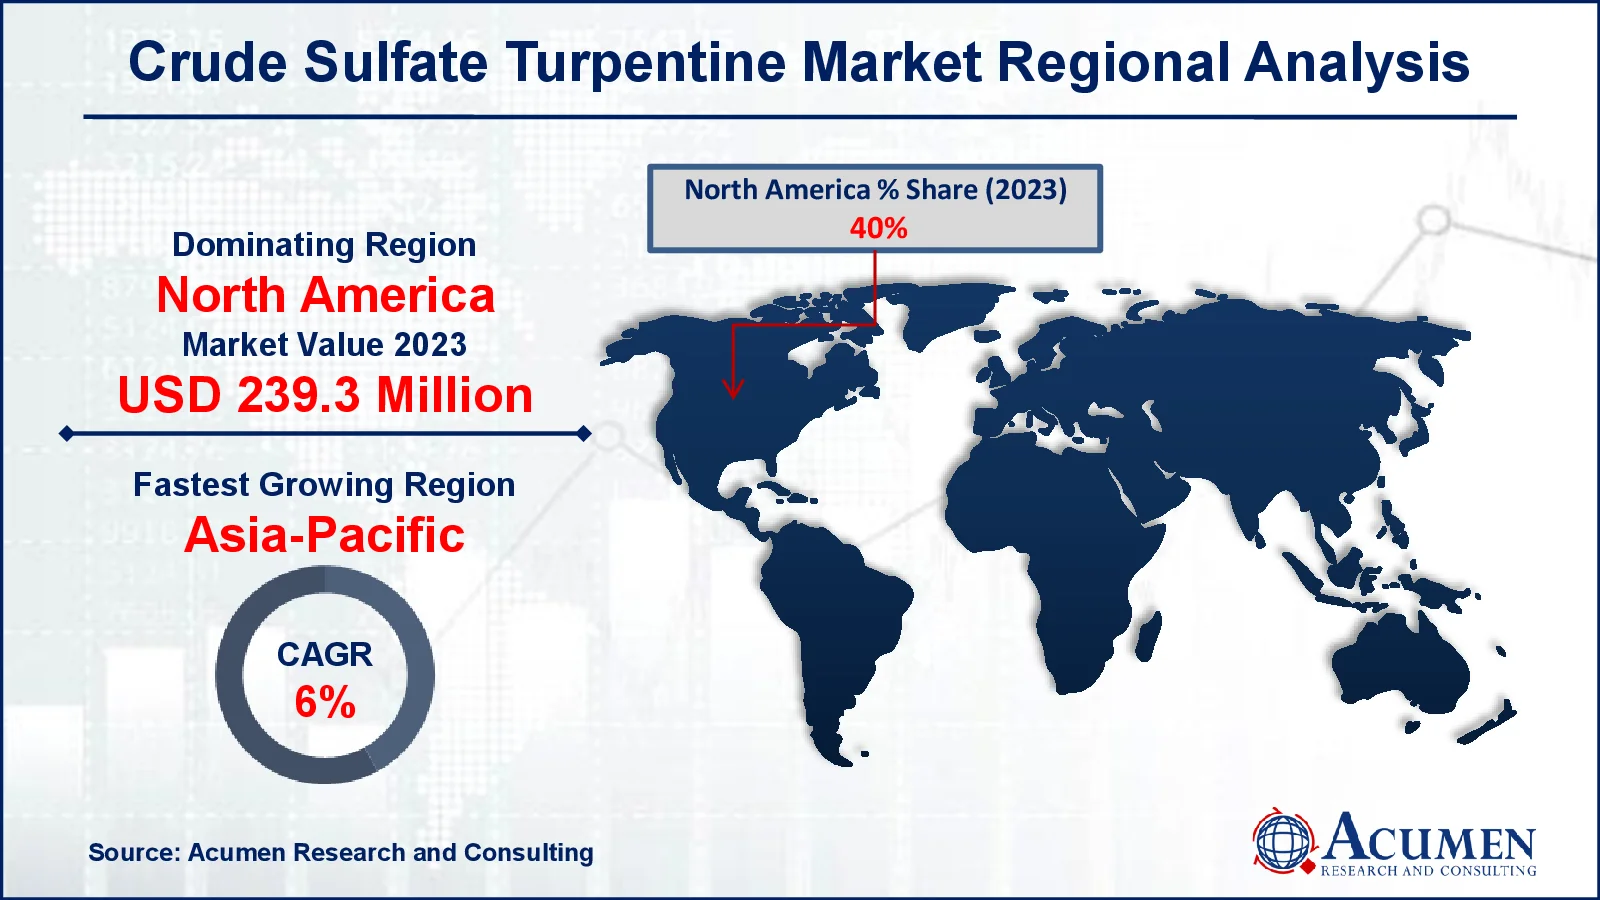
- North America crude sulfate turpentine market value occupied around USD 239.3 million in 2023
- Asia-Pacific crude sulfate turpentine market growth will record a CAGR of more than 6% from 2024 to 2032
- Among product, the alpha-pinene sub-segment generated USD 311.1 million revenue in 2023
- Based on application, the aroma chemicals sub-segment generated 45% crude sulfate turpentine market share in 2023
- Growth in emerging markets for bio-based solvents is a popular crude sulfate turpentine market trend that fuels the industry demand

Crude sulfate turpentine (CST) is a byproduct of the Kraft pulping process, which separates it from the black liquid produced by boiling wood to make paper pulp. CST, which is made up of a variety of organic compounds, notably terpenes such as alpha-pinene, beta-pinene, and camphene, is prized as a raw material for the chemical industry. It is frequently processed into a variety of goods, including solvents, adhesives, perfumes, and flavorings. CST is also utilized in the manufacture of resins, inks, and agrochemicals. CST's renewable nature, along with the growing demand for bio-based chemicals, is fueling interest in it as a sustainable alternative to petroleum-derived products
Global Crude Sulfate Turpentine Market Dynamics
Market Drivers
- Rising demand for bio-based chemicals
- Growing use in fragrance and flavor industries
- Increased production of Kraft paper
- Advancements in turpentine refining technologies
Market Restraints
- Fluctuating raw material availability
- Stringent environmental regulations
- High refining costs
Market Opportunities
- Expansion in renewable chemical markets
- Development of sustainable turpentine-based products
- Increased adoption in agrochemicals and adhesives
Crude Sulfate Turpentine Market Report Coverage
| Market | Crude Sulfate Turpentine Market |
| Crude Sulfate Turpentine Market Size 2022 |
USD 598.3 Million |
| Crude Sulfate Turpentine Market Forecast 2032 | USD 924.6 Million |
| Crude Sulfate Turpentine Market CAGR During 2023 - 2032 | 5.1% |
| Crude Sulfate Turpentine Market Analysis Period | 2020 - 2032 |
| Crude Sulfate Turpentine Market Base Year |
2023 |
| Crude Sulfate Turpentine Market Forecast Data | 2024 - 2032 |
| Segments Covered | By Product, By Application, And By Geography |
| Regional Scope | North America, Europe, Asia Pacific, Latin America, and Middle East & Africa |
| Key Companies Profiled | HARTING KGaA, Symrise, Metsa Fibre, Pine Chemical Group, Takasago International Corporation, UPM Corporation, Resin and Terpene Derivatives SA (DRT), Kraton Corporation, West Rock, and Storaenzo. |
| Report Coverage |
Market Trends, Drivers, Restraints, Competitive Analysis, Player Profiling, Covid-19 Analysis, Regulation Analysis |
Crude Sulfate Turpentine Market Insights
Expanding product infiltration in the aroma chemicals is foreseen to fuel the business development. Product need crosswise over changed applications including personal care, aroma chemicals, and home care products is relied upon to drive the crude sulfate turpentine market. Expanding inclination towards bio-based products inferable from better points of need over artificially inferred products will additionally enlarge the need over the assessed period. Major industry members are concentrating on securing manageable feed stock and actualizing compelling generation process. They are moving towards high bio sustainable substance products to guarantee predominant execution crosswise over end-use applications. Solvents producer executing carene as fixing are focusing on synthetic preparing, glues, paints, enterprises to snatch more open doors by replacing chemical compounds like cement, hydrocarbons, and mineral spirits.
Moving inclination toward eco-accommodating CST subordinates as a substitute to the petrochemical subsidiaries is foreseen to drive the business further. Crude sulfateturpentine , a result acquired in pulp influencing process, to can be sourced at a fixed price based on the yearly or six-month to month contracts. Makers straightforwardly source the materials from plants. It is an unpredictable golden fluid that offers significant products including alpha and beta pinenes, which are the building hinders for different normal flavours and scents.
Besides, these products are responded into poly-terpenes, which are utilized in glues, claim to fame inks, electronic solvents, nutrients, pharmaceuticals, disinfectants, and different products. The convergence of the products fluctuates with the change in geological territories inferable from variety in the sort Pinus in the pine tree. Makers are concentrating on securing sustainable raw materials with a productive assembling process. They are moving towards renewable bio substance to the product manufacturing. For example, Kraton is actualizing high bio- renewable substance (BRC) commonly keeping up the general execution of the tires produced.
Crude Sulfate Turpentine Market Segmentation
The worldwide market for crude sulfate turpentine is split based on product, application, and geography.
Crude Sulfate Turpentine Market By Products
- Alpha-Pinene
- Beta-Pinene
- Delta-3-Carene
- Camphene
- Terpinolene
- Limonene
Alpha-Pinene is the dominant component in crude sulfate turpentine market, accounting for a significant portion of its overall composition. This colorless liquid terpene possesses a characteristic piney odor. Its versatility has made it a cornerstone in numerous industries. Alpha-Pinene is a crucial precursor for the synthesis of a wide range of chemicals. It serves as a starting material for the production of fragrances, flavors, and aroma chemicals. In addition, it finds applications in the manufacturing of resins, adhesives, and cleaners. The growing demand for natural and sustainable products has boosted the importance of alpha-pinene, as it offers a renewable alternative to synthetic compounds. While other components like beta-pinene, delta-3-carene, camphene, terpinolene, and limonene also have their specific uses, alpha-pinene's abundance and diverse applications solidify its position as the primary focus within the CST market.
Crude Sulfate Turpentine Market By Applications
- Additives
- Adhesives
- Paints & Printing Inks
- Solvents
- Rubber Processing
- Aroma Chemicals
- Personal/Home Care Product
According to crude sulfate turpentine industry analysis, CST has a wide range of applications throughout industries. From improving product performance to imparting desired features, its derivatives play an important function. One of the most common applications of CST is the production of fragrance compounds. This category has expanded significantly due to rising demand for natural and sustainable components in personal care, household products, and exquisite fragrances. CST-derived chemicals provide a diverse range of smells, from fresh and woody to lemony and floral.
These scent compounds are essential to the creation of perfumes, colognes, and air fresheners. Their natural provenance appeals to those seeking environmentally beneficial solutions. Furthermore, the diversity of CST-based aroma compounds enables the development of intricate and subtle smell profiles. As worldwide awareness of clean and natural products grows, the aroma chemicals category is positioned for further expansion in the crude sulfate turpentine market forecast period.
Crude Sulfate Turpentine Market Regional Outlook
North America
- U.S.
- Canada
Europe
- U.K.
- Germany
- France
- Spain
- Rest of Europe
Asia-Pacific
- India
- Japan
- China
- Australia
- South Korea
- Rest of Asia-Pacific
Latin America
- Brazil
- Mexico
- Rest of Latin America
The Middle East & Africa
- South Africa
- GCC Countries
- Rest of the Middle East & Africa (ME&A)

Crude Sulfate Turpentine Market Regional Analysis
In terms of crude sulfate turpentine market analysis, North America developed as the biggest regional industry in the past attributable to nearness of the real exporters. The area is foreseen to keep up its strength amid the forthcoming years. Europe additionally held a huge industry share in 2023 and will grow in the coming a very long time because of popularity for common fixings in beautifying agents and personal care products. Presence of a hearty individual consideration manufacturing base in nations, for example, U.K., France, and Germany, is additionally expected to be a good factor for the market.
Asia-Pacific is anticipated to be the quickest developing local market in the years to come attributable to rising product need in beauty care products and individual consideration industry from developing nations, for example, China and Japan. China is the biggest maker of turpentine over the globe, subsequently; the vast majority of the turpentine prerequisites in the nation are met by provincial generation units.
Crude Sulfate Turpentine Market Players
Some of the top crude sulfate turpentine companies offered in our report include HARTING KGaA, Symrise, Metsa Fibre, Pine Chemical Group, Takasago International Corporation, UPM Corporation, Resin and Terpene Derivatives SA (DRT), Kraton Corporation, West Rock, and Storaenzo.
Frequently Asked Questions
How big is the crude sulfate turpentine market?
The crude sulfate turpentine market size was valued at USD 598.3 million in 2023.
What is the CAGR of the global crude sulfate turpentine market from 2024 to 2032?
The CAGR of crude sulfate turpentine is 5.1% during the analysis period of 2024 to 2032.
Which are the key players in the crude sulfate turpentine market?
The key players operating in the global market are including HARTING KGaA, Symrise, Metsa Fibre, Pine Chemical Group, Takasago International Corporation, UPM Corporation, Resin and Terpene Derivatives SA (DRT), Kraton Corporation, West Rock, and Storaenzo.
Which region dominated the global crude sulfate turpentine market share?
North America held the dominating position in crude sulfate turpentine industry during the analysis period of 2024 to 2032.
Which region registered fastest CAGR from 2024 to 2032?
Asia-Pacific region exhibited fastest growing CAGR for market of crude sulfate turpentine during the analysis period of 2024 to 2032.
What are the current trends and dynamics in the global crude sulfate turpentine industry?
The current trends and dynamics in the crude sulfate turpentine industry include rising demand for bio-based chemicals, growing use in fragrance and flavor industries, increased production of Kraft paper, and advancements in turpentine refining technologies.
Which application held the maximum share in 2023?
The aroma chemicals application held the maximum share of the crude sulfate turpentine industry.


