Chondroitin Sulfate Market Size - Global Industry, Share, Analysis, Trends and Forecast 2024 - 2032
Published :
Report ID:
Pages :
Format :
Chondroitin Sulfate Market Size - Global Industry, Share, Analysis, Trends and Forecast 2024 - 2032
Report Coverage
- Industry Dynamics
- Market Size and Forecast Data
- Segment Analysis
- Competitive Landscape
- Regional Analysis with a Niche Focus on Country-Level Data
- High Level Analysis - Porter's, PESTEL, Value Chain, etc.
- Company Profiles of Key Players
- Option to Customize the Report As Per Your Specific Need
Request Sample Report
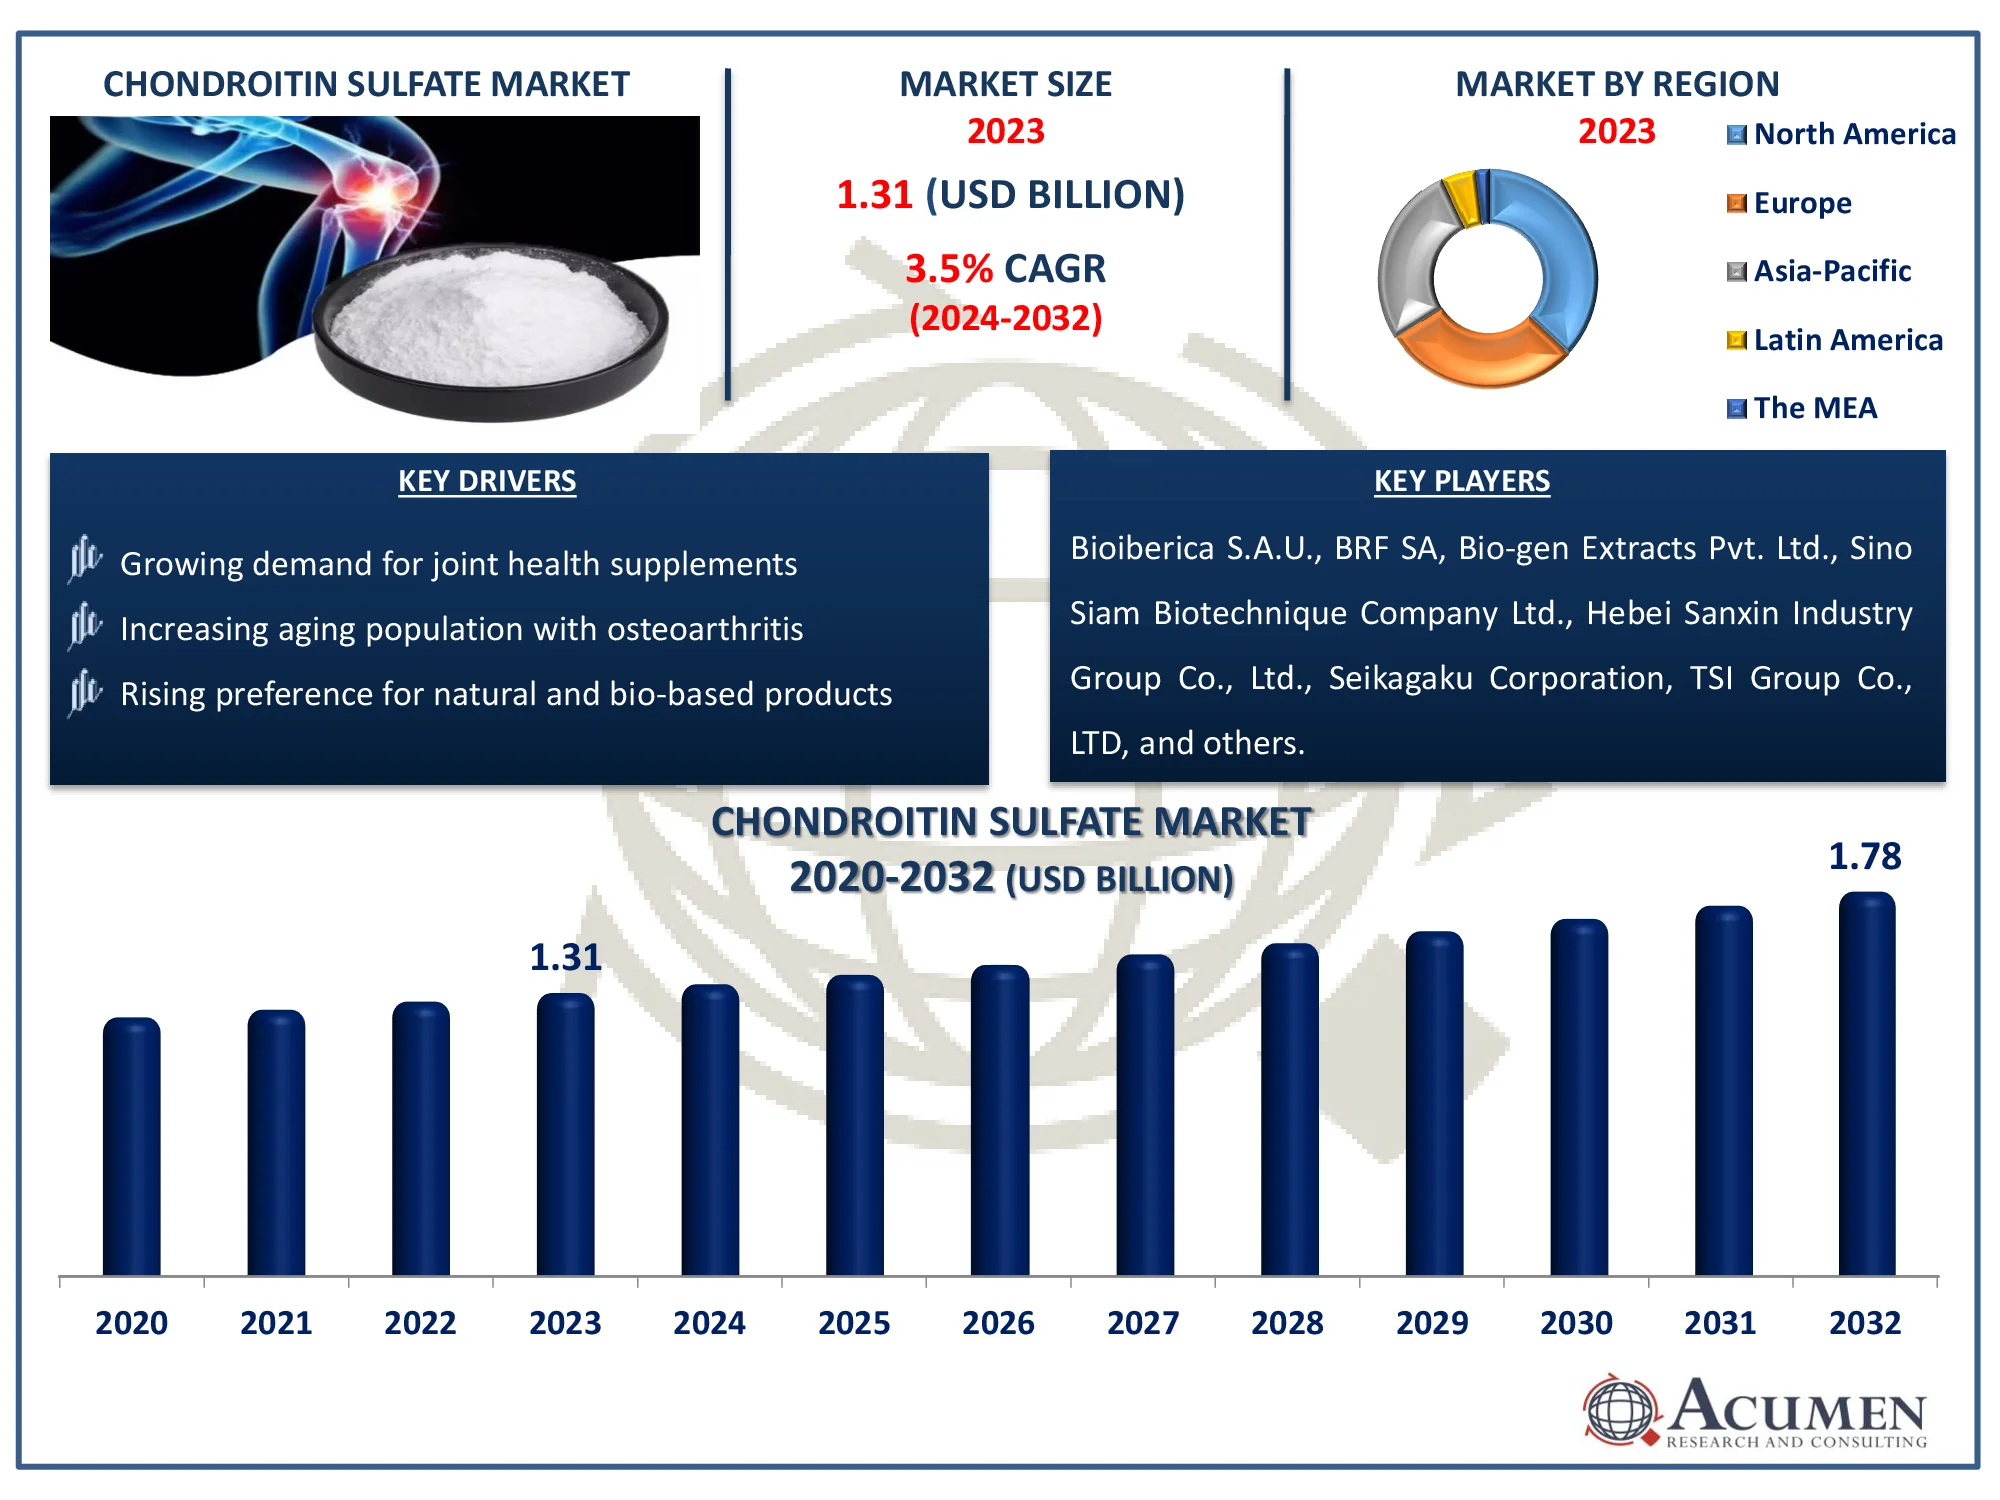
The Global Chondroitin Sulfate Market Size accounted for USD 1.31 Billion in 2023 and is estimated to achieve a market size of USD 1.78 Billion by 2032 growing at a CAGR of 3.5% from 2024 to 2032.
Chondroitin Sulfate Market Highlights
- The global chondroitin sulfate market is expected to reach USD 1.78 billion by 2032, growing at a CAGR of 3.5% from 2024 to 2032
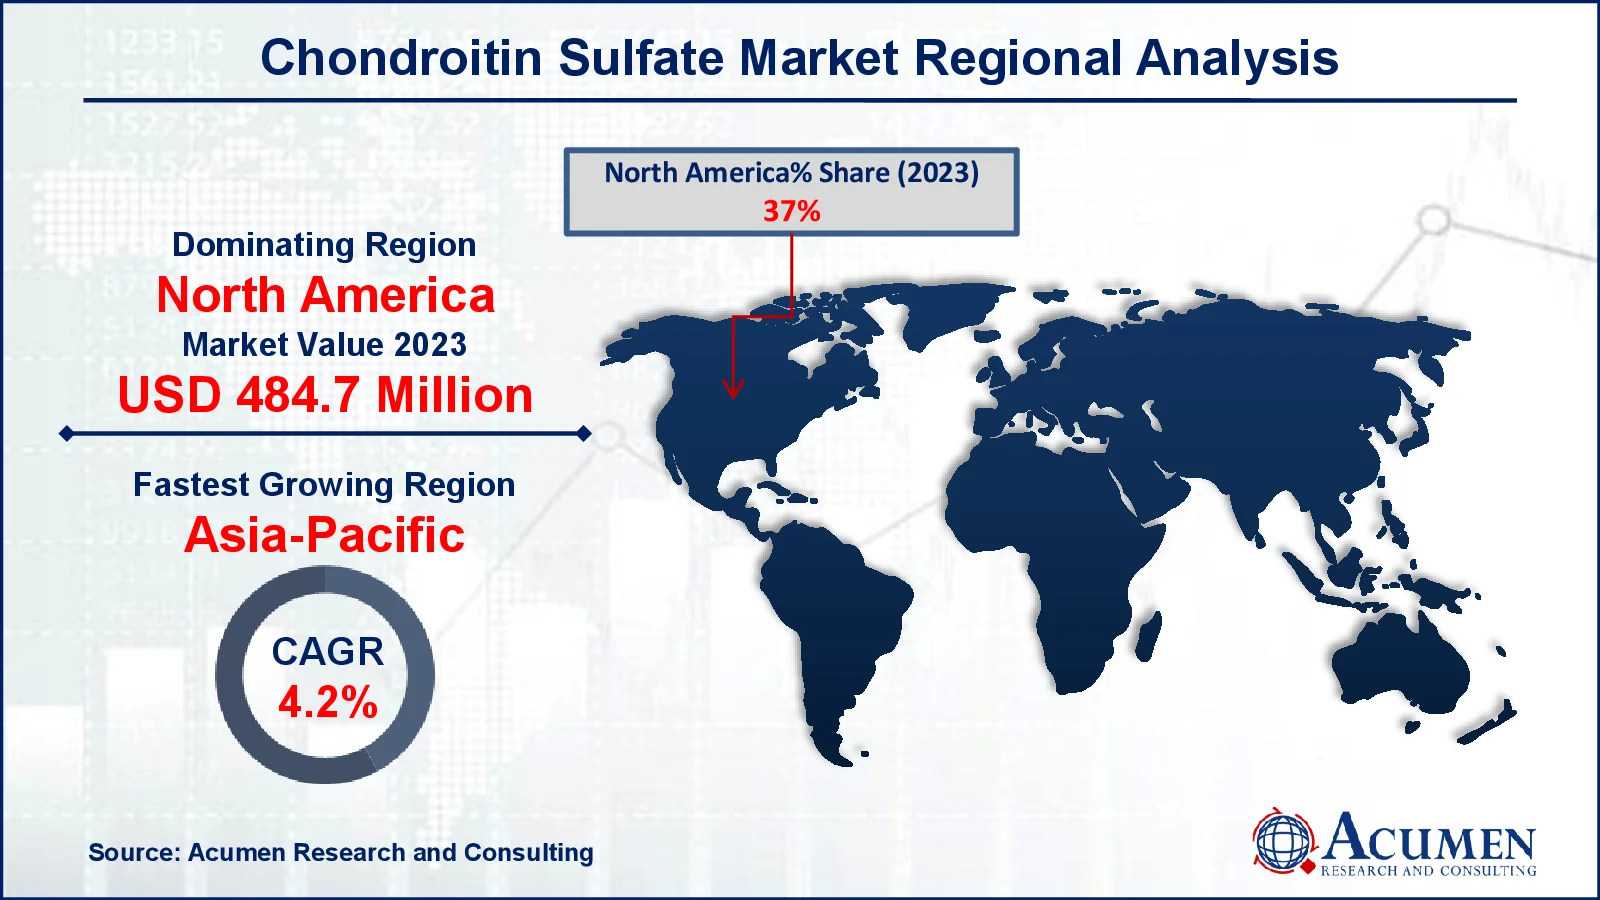
- In 2023, the North American chondroitin sulfate market was valued at approximately USD 484.7 million
- The Asia-Pacific region is projected to grow at a CAGR of over 4.2% from 2024 to 2032
- The bovine source represented 38% of the market share in 2023
- The dietary supplements sub-segment held 35% of the market share in 2023
- Growth in the use of chondroitin sulfate in veterinary medicine for animal joint health market trend that fuels the industry demand

Chondroitin sulfate is also known as glycosaminoglycan-sulfated glucose (GAG). Chondroitin sulfate is a long alternating sugar chain including glucuronic acid and N-acetylgalactosamine. Chondroitin sulfate is a chemical molecule found in human connective tissues, specifically cartilage and joints. Commercial chondroitin sulfate is derived from a variety of animal sources, including pig, beef, chicken, fish, sharks, and crocodiles. As an alternative treatment, chondroitin sulfate is used to prevent osteoarthritis from worsening. Chondroitin sulfate also reduces articular pain and inflammation. Regular chondroitin sulfate intake helps to improve joint function. Commercial chondroitin combines glucosamine and chondroitin sulfate. Chondroitin sulfate can be used to improve joint function, as an eye drop for waxing teeth, and for veterinary purposes.
Global Chondroitin Sulfate Market Dynamics
Market Drivers
- Growing demand for joint health supplements
- Increasing aging population with osteoarthritis
- Rising preference for natural and bio-based products
Market Restraints
- High cost of chondroitin sulfate production
- Regulatory challenges and lack of standardization
- Limited awareness in emerging markets
Market Opportunities
- Expanding use in pet healthcare products
- Potential for growth in developing countries
- Advancements in formulations and delivery systems
Chondroitin Sulfate Market Report Coverage
| Market | Chondroitin Sulfate Market |
| Chondroitin Sulfate Market Size 2022 |
USD 1.31 Billion |
| Chondroitin Sulfate Market Forecast 2032 | USD 1.78 Billion |
| Chondroitin Sulfate Market CAGR During 2023 - 2032 | 3.5% |
| Chondroitin Sulfate Market Analysis Period | 2020 - 2032 |
| Chondroitin Sulfate Market Base Year |
2022 |
| Chondroitin Sulfate Market Forecast Data | 2023 - 2032 |
| Segments Covered | By Source, By Form, By Application, And By Geography |
| Regional Scope | North America, Europe, Asia Pacific, Latin America, and Middle East & Africa |
| Key Companies Profiled | Bioiberica S.A.U., BRF SA, Bio-gen Extracts Pvt. Ltd., Sino Siam Biotechnique Company Ltd., Hebei Sanxin Industry Group Co., Ltd., Seikagaku Corporation, TSI Group Co., LTD, Sigma Aldrich, Inc. (Merck KGaA, Darmstadt), Qingdao Wan Toulmin Biological Sources Co., Ltd., and ZPD A/S. |
| Report Coverage |
Market Trends, Drivers, Restraints, Competitive Analysis, Player Profiling, Covid-19 Analysis, Regulation Analysis |
Chondroitin Sulfate Market Insights
Increasing aging population with osteoarthritis drives demand of chondroitin sulfate market. As per national library of medicine, the United Nations Population Division projects that 34% of Indians will be above the age of 50 by 2050. Between 2010 and 2050, the number of persons aged 65 and older is expected to increase from 5% to 14%, while the percentage of those aged 80 and older will jump from 1% to 3%. As the aging population develops, so do osteoarthritis cases, and demand for effective therapies, such as chondroitin sulfate, is expected to rise, boosting market expansion.
Additionally, growing demand for joint health supplements also leads market value. For instance, FlexAgain announced intentions in March 2023 to launch joint supplements on popular third-party marketplaces such as Amazon. The decision to start on these platforms was prompted by rising demand for nutritional supplements and the growing prevalence of e-commerce.
Limited awareness of the benefits of chondroitin sulfate in emerging areas may limit its acceptance, impeding market expansion. As a result, a lack of information about its role in joint health and osteoarthritis care may lower consumer demand in these areas.
Moreover, advancements in formulations and delivery system become opportunity for chondroitin sulfate market. Infinitus (LKK Group Limited), a Chinese herbal health product distributor, debuted the Li Mai Jian supplement line in July 2022, with the focus on "Enhancing Bone Strength for Joint Well-being." This series comprises a "Joint Care" package with Cartilage Extract Pressed Candy and Strawberry-Flavored Vitamin D, Calcium, and Zinc Tablets, which are intended to give specialist bone and joint support for people of all ages. The growing consumer interest in preventive healthcare and joint support is increasing the market value of chondroitin sulfate products.
Chondroitin Sulfate Market Segmentation
The worldwide market for chondroitin sulfate is split based on source, form, application, and geography.
Chondroitin Sulfate Sources
- Bovine
- Shark
- Swine
- Synthetic
- Poultry
According to the chondroitin sulfate industry analysis, bovine-derived chondroitin sulfate dominates the market because it is more readily available and cost-effective than alternative sources. Cow cartilage contains a high concentration of chondroitin sulfate, making it an excellent source for extraction. Furthermore, bovine chondroitin sulfate has a documented track record of efficacy in treating osteoarthritis and joint health, which adds to its commercial appeal. Alternate sources such are used, bovine remains the most popular due to its availability and price.
Chondroitin Sulfate Forms
- Powder
- Liquid
- Capsules/Tablets
According to the chondroitin sulfate industry analysis, powder form leads market position in 2023 in chondroitin sulfate industry because of its versatility and ease of use. Powdered chondroitin sulfate is easy to add into dietary supplements, making it convenient for both makers and customers. Furthermore, it enables for more precise dosing and absorption, making it an excellent alternative for joint health solutions. The increased desire for natural, effective supplements for osteoarthritis treatment adds to the appeal of the powdered form on the market.
Chondroitin Sulfate Applications
- Dietary Supplements
- Pharmaceutical
- Cosmetics
- Veterinary Use
- Others
According to the chondroitin sulfate market forecast, the chondroitin sulfate market is predicted to grow significantly in the dietary supplements sector as people become more conscious of joint health issues and the prevalence of arthritis and osteoarthritis increases. As customers look for natural ways to treat joint discomfort and improve mobility, chondroitin sulfate's role in promoting cartilage health and lowering inflammation makes it a popular supplement ingredient. Demand is also being driven by the growing trend of preventative healthcare and aging populations around the world.
Chondroitin Sulfate Market Regional Outlook
North America
- U.S.
- Canada
Europe
- U.K.
- Germany
- France
- Spain
- Rest of Europe
Asia-Pacific
- India
- Japan
- China
- Australia
- South Korea
- Rest of Asia-Pacific
Latin America
- Brazil
- Mexico
- Rest of Latin America
The Middle East & Africa
- South Africa
- GCC Countries
- Rest of the Middle East & Africa (ME&A)

Chondroitin Sulfate Market Regional Analysis
For several reasons, the largest regional market in North America was predicted to be worth over USD 484.7 million. The thriving pharmaceutical business in the United States, as well as FDA approval for sodium chondroitin sulfate infusers, contributes to regional industry growth. The market for chondroitin sulfate is being driven by an older population and helpful government initiatives for healthcare sector. The Health Care Financing Administration is part of the Department of Health and Human Services and oversees two major programs that are Medicare and Medicaid. Medicare is a government program that directly supports healthcare services for aged Americans. Medicaid is a joint federal-state program that provides financial assistance for healthcare services to low-income persons, including the poor and elderly. Government programs, which provide healthcare to the elderly, may raise demand for chondroitin sulfate as these programs expand their scope of healthcare services, fueling market growth.
Asia-Pacific is expected to be the fastest expanding region, with a 4.2% CAGR over the forecast period, owing to rising osteoarthritis incidence and increased customer awareness of nutritional supplements. Asia-Pacific was the second largest regional market in 2023, driven by the growth of end-user sectors such as nutraceuticals, pharmaceuticals, personal care, and cosmetics. Increased product production in the area, as well as increased exports from key nations such as China and Japan, are projected to boost the industry's growth.
The chondroitin sulfate market in Europe is growing significantly, owing to an aging population and increased awareness of joint health issues. Countries such as Germany, the United Kingdom, and France are dominating the market, with an increasing number of people seeking natural and effective osteoarthritis therapies.
Chondroitin Sulfate Market Players
Some of the top chondroitin sulfate companies offered in our report include Bioiberica S.A.U., BRF SA, Bio-gen Extracts Pvt. Ltd., Sino Siam Biotechnique Company Ltd., Hebei Sanxin Industry Group Co., Ltd., Seikagaku Corporation, TSI Group Co., LTD, Sigma Aldrich, Inc. (Merck KGaA, Darmstadt), Qingdao Wan Toulmin Biological Sources Co., Ltd., and ZPD A/S.
Frequently Asked Questions
How big is the chondroitin sulfate market?
The chondroitin sulfate market size was valued at USD 1.31 billion in 2023.
What is the CAGR of the global chondroitin sulfate market from 2024 to 2032?
The CAGR of chondroitin sulfate is 3.5% during the analysis period of 2024 to 2032.
Which are the key players in the chondroitin sulfate market?
The key players operating in the global market are including Bioiberica S.A.U., BRF SA, Bio-gen Extracts Pvt. Ltd., Sino Siam Biotechnique Company Ltd., Hebei Sanxin Industry Group Co., Ltd., Seikagaku Corporation, TSI Group Co., LTD, Sigma Aldrich, Inc. (Merck KGaA, Darmstadt), Qingdao Wan Toulmin Biological Sources Co., Ltd., and ZPD A/S.
Which region dominated the global chondroitin sulfate market share?
North America held the dominating position in chondroitin sulfate industry during the analysis period of 2024 to 2032.
Which region registered fastest CAGR from 2024 to 2032?
Asia-Pacific region exhibited fastest growing CAGR for market of chondroitin sulfate during the analysis period of 2024 to 2032.
What are the current trends and dynamics in the global chondroitin sulfate industry?
The current trends and dynamics in the chondroitin sulfate industry include growing demand for joint health supplements, increasing aging population with osteoarthritis, and rising preference for natural and bio-based products.
Which source held the maximum share in 2023?
The bovine source held the maximum share of the chondroitin sulfate industry.


