Chemical Distribution Market | Acumen Research and Consulting
Chemical Distribution Market Size - Global Industry, Share, Analysis, Trends and Forecast 2024 - 2032
Published :
Report ID:
Pages :
Format :
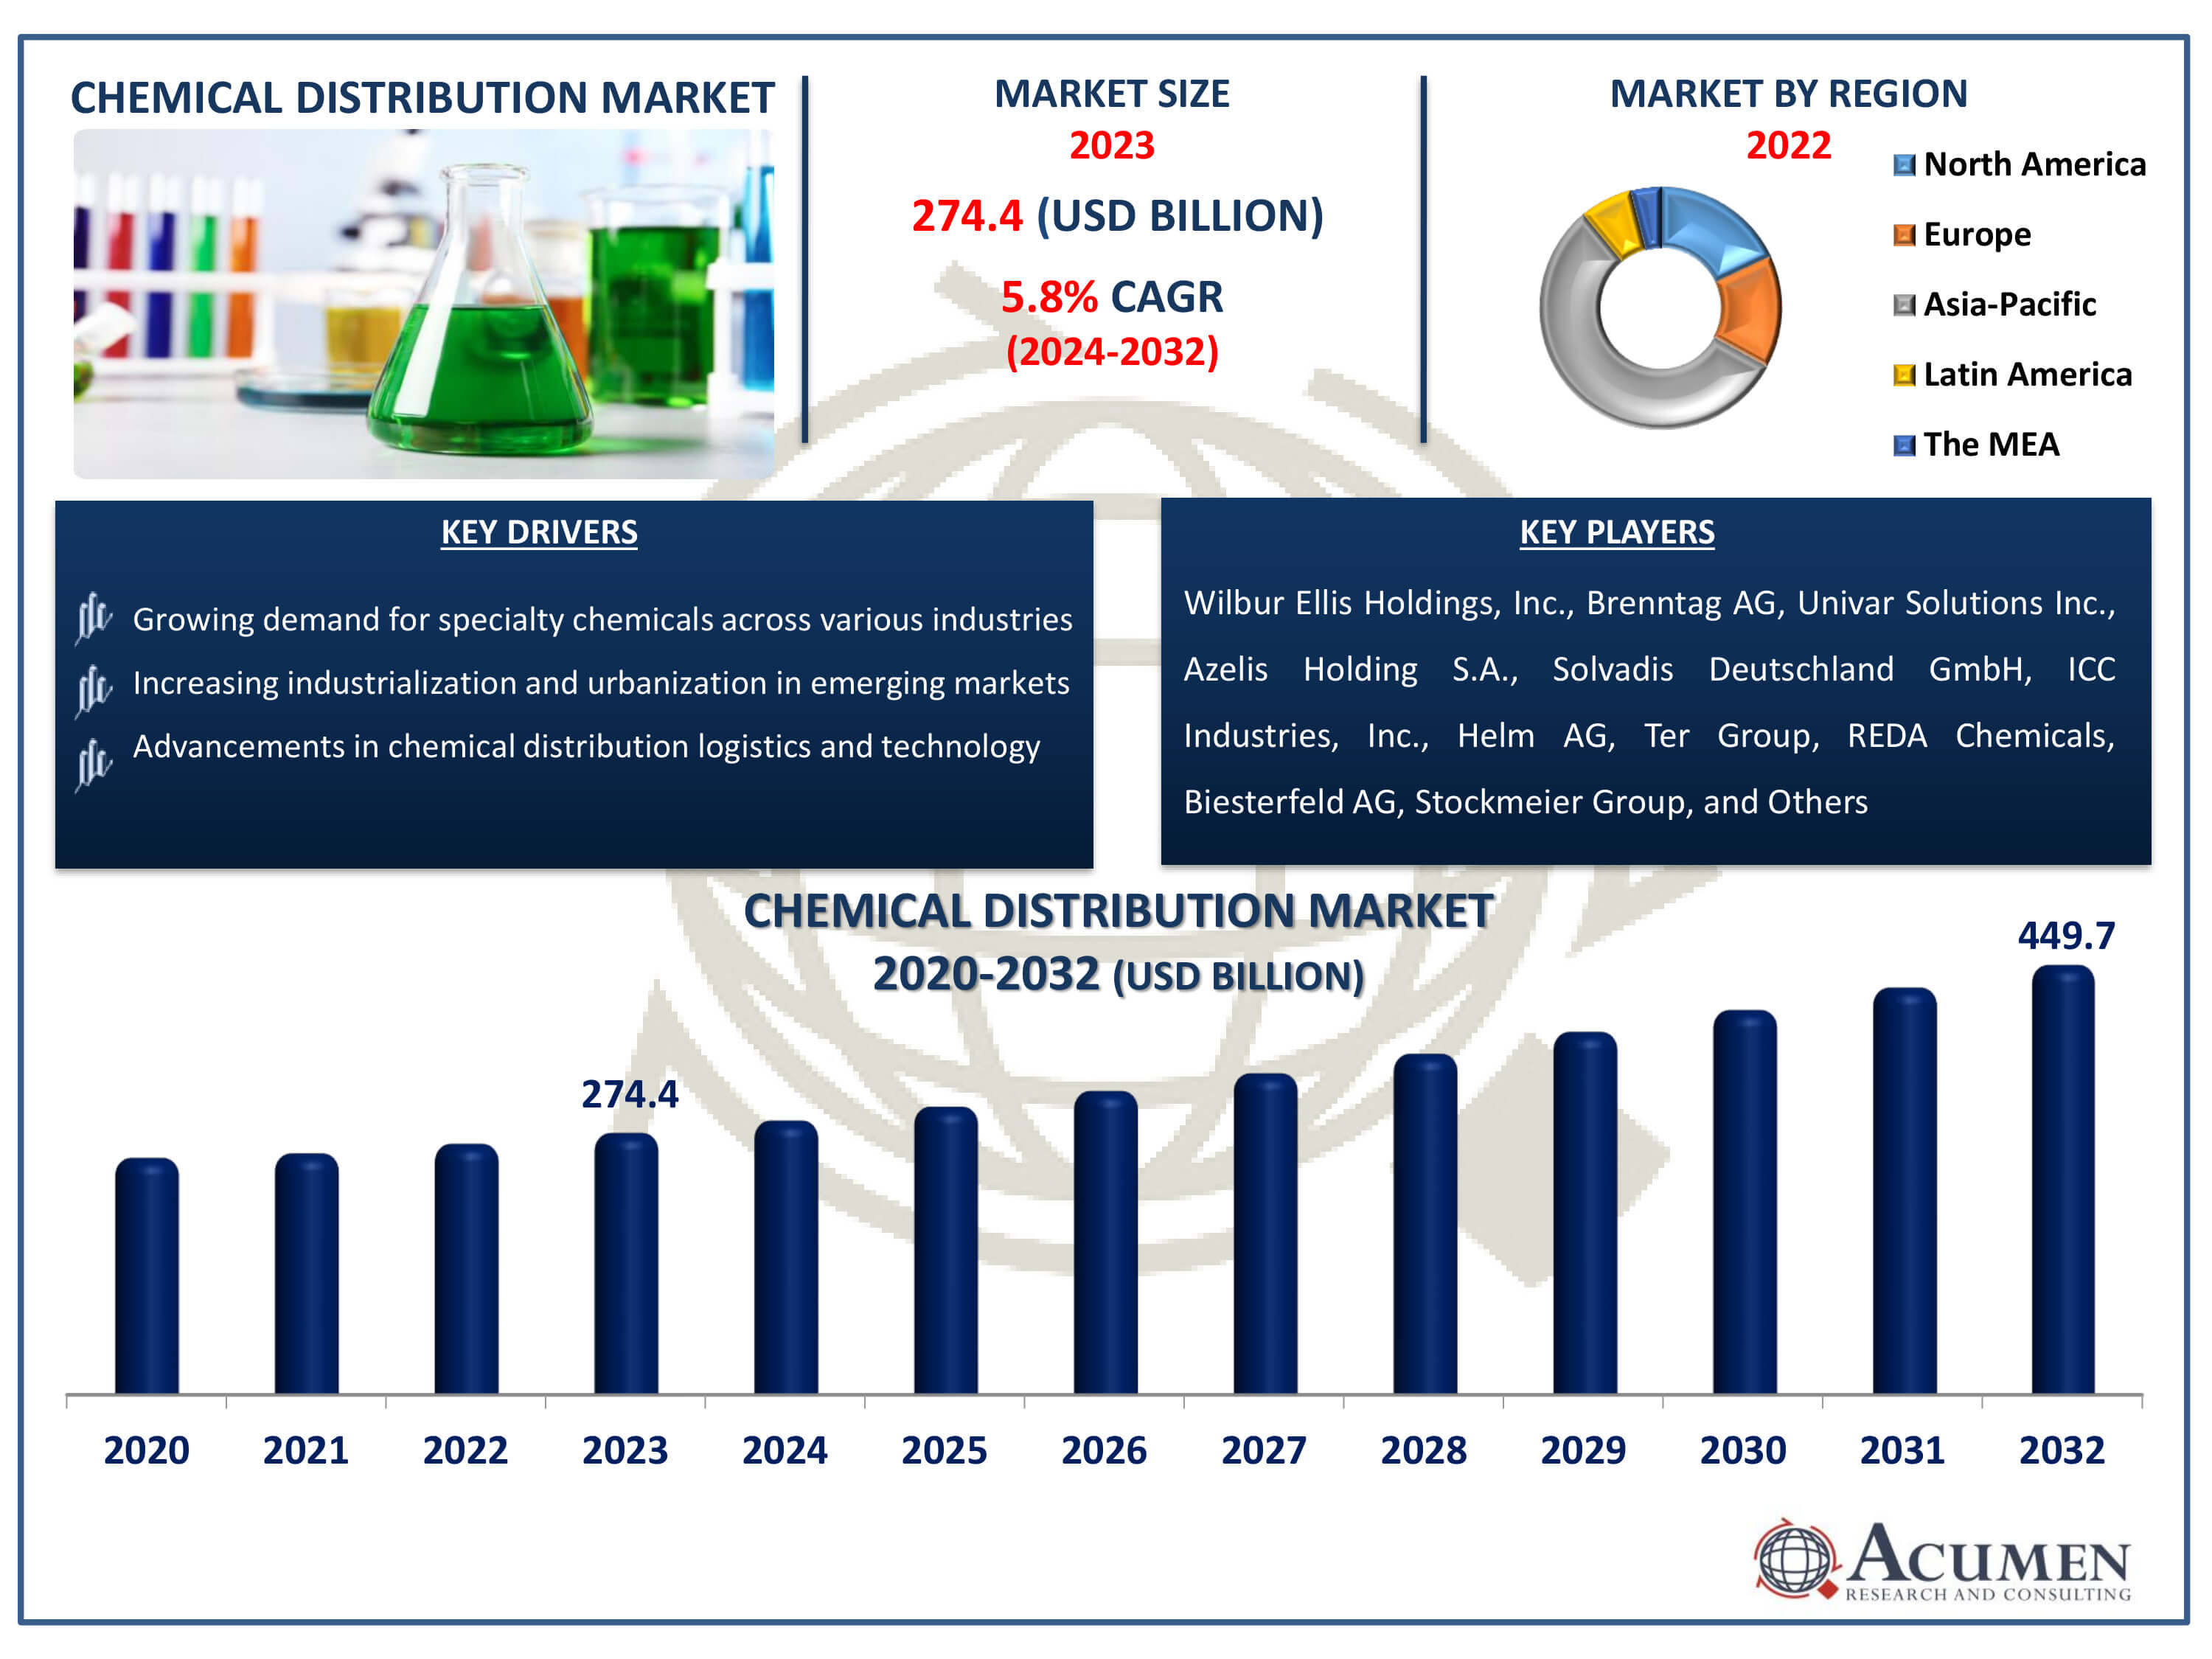
The Chemical Distribution Market Size accounted for USD 274.4 Billion in 2023 and is estimated to achieve a market size of USD 449.7 Billion by 2032 growing at a CAGR of 5.8% from 2024 to 2032.
Chemical Distribution Market Highlights
- Global chemical distribution market revenue is poised to garner USD 449.7 billion by 2032 with a CAGR of 5.8% from 2024 to 2032
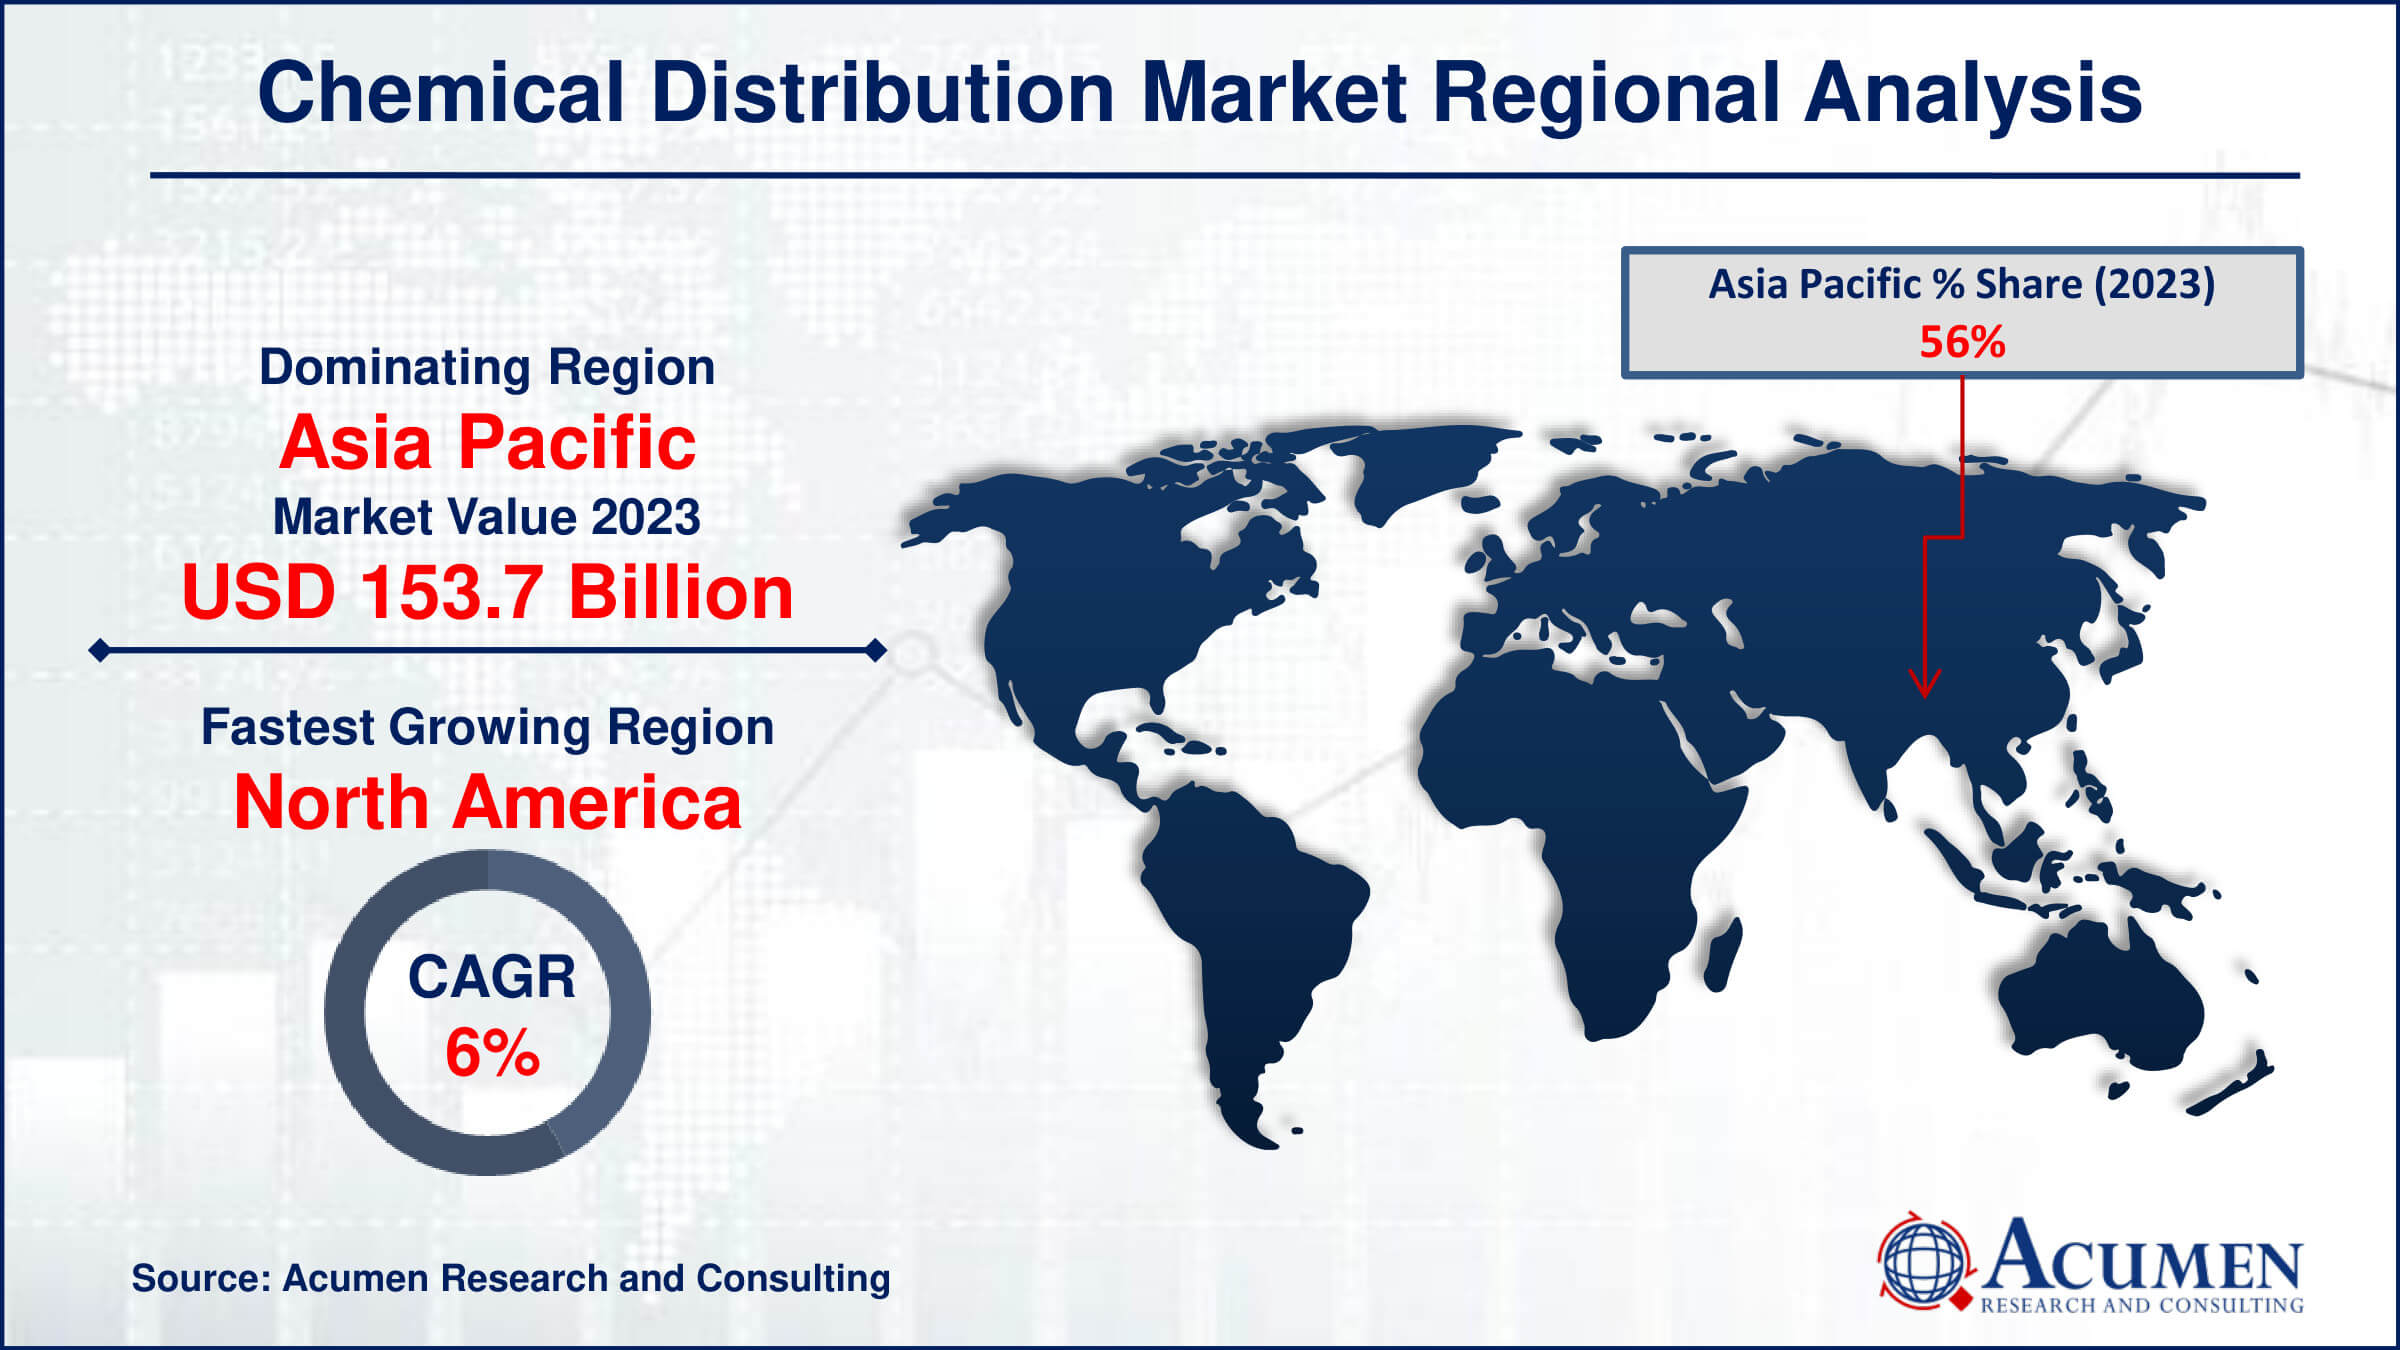
- Asia Pacific chemical distribution market value occupied around USD 153.7 billion in 2023
- North America chemical distribution market growth will record a CAGR of more than 6% from 2024 to 2032
- Among product, the commodity chemical sub-segment generated 67% of the market share in 2023
- Based on end-user, the construction sub-segment generated 20% of market share in 2023
- Growing globalization, consolidation, and e-commerce is the chemical distribution market trend that fuels the industry demand

Chemical distribution involves the storage and transportation of mass and packaged chemicals. These are frequently supplied via pipelines, barrels, containers, and sacks. The chemical business manufactures a wide range of chemicals as raw materials for manufacturing sectors such as oil and petroleum, food, building construction, textile, cosmetics, paint, and agriculture. A wide range of specialty and commodity chemicals are available through distributors worldwide.
Global Chemical Distribution Market Dynamics
Market Drivers
- Growing demand for specialty chemicals across various industries
- Increasing industrialization and urbanization in emerging markets
- Advancements in chemical distribution logistics and technology
Market Restraints
- Stringent environmental regulations impacting chemical manufacturing and distribution
- Fluctuating raw material prices affecting profit margins
- High competition leading to pricing pressures
Market Opportunities
- Expansion of the pharmaceutical and personal care sectors
- Rising investments in green chemicals and sustainable solutions
- Growing e-commerce platforms facilitating easier distribution channels
Chemical Distribution Market Report Coverage
| Market | Chemical Distribution Market |
| Chemical Distribution Market Size 2022 | USD 274.4 Billion |
| Chemical Distribution Market Forecast 2032 |
USD 449.7 Billion |
| Chemical Distribution Market CAGR During 2024 - 2032 | 5.8% |
| Chemical Distribution Market Analysis Period | 2020 - 2032 |
| Chemical Distribution Market Base Year |
2022 |
| Chemical Distribution Market Forecast Data | 2024 - 2032 |
| Segments Covered | By Product, By End-User, And By Geography |
| Regional Scope | North America, Europe, Asia Pacific, Latin America, and Middle East & Africa |
| Key Companies Profiled | Wilbur Ellis Holdings, Inc., Brenntag AG, Univar Solutions Inc., Azelis Holding S.A., Solvadis Deutschland GmbH, ICC Industries, Inc., Helm AG, Ter Group, REDA Chemicals, Biesterfeld AG, Stockmeier Group, and Jebsen & Jessen Pte. Ltd. |
| Report Coverage |
Market Trends, Drivers, Restraints, Competitive Analysis, Player Profiling, Covid-19 Analysis, Regulation Analysis |
Chemical Distribution Market Insights
The growing demand for specialty chemicals across various industries is significantly driving the demand for the chemical distribution market. For instance, according to India’s Brand Equity Foundation, the rise in demand from end-user sectors such as food processing, personal care, and home care is driving the growth of various segments in India's specialty chemicals market. Chemical and petrochemical demand in India is predicted to nearly treble, reaching $1 trillion by 2040. Furthermore, India is the world's sixth largest chemical manufacturer and third in Asia, accounting for 7% of its GDP. As a result, this rising chemical demands boosting growth of chemical distribution industry. Moreover, increasing industrialization and urbanization in emerging markets further drives market’s growth.
Stringent environmental regulations impacting chemical manufacturing and distribution significantly impede the growth of the chemical distribution market. These regulations often necessitate substantial investments in advanced technologies, safety measures, and waste management systems to mitigate environmental impact. Furthermore, regulatory uncertainty and the possibility of noncompliance penalties foster a cautious company environment, limiting expansion and delaying market growth. Overall, while these regulations aim to protect the environment, they can hinder the rapid development and quickness of the chemical distribution sector.
The expansion of the pharmaceutical and personal care sectors presents a significant growth opportunity for the chemical distribution market. For instance, in May 2023, HARKE GROUP announced a relationship with Omya to distribute Omyapure, Omyapharm, and Omyanutra - innovative mineral products for pharmaceutical and nutraceutical uses - in Germany, Austria, Ireland, and the United Kingdom. These factors expected increase growth of pharmaceutical and personal care industry which creates an opportunity for chemical distribution market in forecast year. Furthermore, growing e-commerce platforms facilitating easier distribution channels prompted chemical distribution market in coming years.
Chemical Distribution Market Segmentation
The worldwide market for chemical distribution is split based on product, end-user, and geography.
Chemical Distribution Products
- Specialty Chemical
- CASE
- Electronic
- Agrochemicals
- Specialty Polymers & Resins (SPR)
- Construction
- Flavor & Fragrances
- Personal Care Active Ingredients (PCAI)
- Commodity Chemical
- Plastics & Polymers
- Explosives
- Synthetic Rubber
- Petrochemicals
- Others
According to the chemical distribution industry analysis, commodity chemicals as product dominate chemical distribution market. Commodity chemicals dominate the chemical distribution market due to their essential role in various industries and their high volume, low-margin nature. These chemicals, which include basic and widely used substances like acids, alkalis, salts, and solvents, are crucial for manufacturing processes across sectors such as agriculture, pharmaceuticals, construction, and consumer goods. Their widespread application ensures a consistent and substantial demand. Moreover, the large-scale production and standardized nature of commodity chemicals make them easier to handle and distribute, leading to cost efficiencies and efficient supply chains, further solidifying their dominance in the market.
Chemical Distribution End-Users
- Automotive & Transportation
- Agriculture
- Construction
- Consumer Goods
- Industrial Manufacturing
- Oil & Gas Mining
- Textiles
- Healthcare & Pharmaceuticals
- Food Processing
The construction segment is the largest segment category in the chemical distribution market and it is expected to increase over the industry. The construction segment dominates the chemical distribution market due to its substantial demand for construction chemicals like adhesives, sealants, and concrete admixtures. These chemicals are crucial for enhancing the performance, durability, and efficiency of building materials, driving consistent demand. The chemical industry produces a wide range of chemicals as raw materials for the oil and petroleum, cosmetics, food, textile, paint, construction, and agricultural industries. Additionally, the global infrastructure development and urbanization trends further boost the market's growth in this segment.
Industrial manufacturing segment is expected to grow in the chemical distribution forecast period. This segment encompasses a broad range of chemicals essential for production processes, including lubricants, adhesives, sealants, and coatings, which are critical for various industries such as automotive, aerospace, and electronics. As these industries continue to expand and innovate, the need for specialized chemicals modified to specific manufacturing processes grows, driving further demand in the market. For instance, in June 2023, IMCD purchased 100% of the shares of specialized distributor Brylchem Pte Ltd in order to extend its foothold in Southeast Asia. The transaction is expected for the fourth quarter of 2023. Besides, Brenntag bought Shanghai Saifu Chemical Development Co., Ltd. in China in June 2023, marking a significant step in expanding its specialty chemicals footprint in the Asia Pacific region. Overall, the trend towards advanced manufacturing techniques also fuels growth, ensuring the industrial manufacturing segment's prominence and projected increase in the specialty chemicals distribution sector.
Chemical Distribution Market Regional Outlook
North America
- U.S.
- Canada
Europe
- U.K.
- Germany
- France
- Spain
- Rest of Europe
Asia-Pacific
- India
- Japan
- China
- Australia
- South Korea
- Rest of Asia-Pacific
Latin America
- Brazil
- Mexico
- Rest of Latin America
The Middle East & Africa
- South Africa
- GCC Countries
- Rest of the Middle East & Africa (ME&A)

Chemical Distribution Market Regional Analysis
For several reasons, the Asia-Pacific region dominates the chemical distribution market. Because of increased chemical manufacturing and consumption, Asia-Pacific dominates the chemical distribution market. Furthermore, increased per capita purchasing power will drive the region's chemical distribution market growth during the forecast period. This region contains a strong chemical sector with presence of robust key players which contributes to growth of market due to their collaboration and product launching in Asian region. For instance, in November 2023, Insecticides (India) Limited, an agrochemical firm, announced the launch of four new products: Nakshatra, Supremo SP, Opaque, and Million. These solutions are designed to give good protection from weeds, pests, and the Phalaris minor weed in wheat, which benefits farmers and promotes sustainability in the agricultural sector. Additionally, with strong industrialization and infrastructure in countries like China, India, Japan, South Korea and Australia further boosting chemical distribution market due to strong economy of Asian Countries. For instance, in 2022, China was responsible for 44% of worldwide chemical production and 46% of capital investment. Furthermore, in 2023, Saudi Aramco, through its subsidiary AOC, purchased a ten percent ownership in Rongsheng Petrochemical and pledged to collaborate on raw materials, technology, and chemicals. As a result, ongoing advancements and well-built chemicals industrialization maintain region’s dominance in chemical distribution industry.
North America is the fastest-growing region in the chemical distribution market. With the ongoing investments in chemical industry and strong industrialization and infrastructure drives growth of market in North American region. For instance, the US Chemical sector produces over 70,000 goods and distributes them to 750,000 end consumers nationwide. Chemical facilities in the United States, from petrochemical makers to wholesalers, operate in a worldwide supply chain. Moreover, countries like U.S. and Canada contains robust key players due to their advancements and innovations in this industry further contribute to growth of market. For instance, Univar Solutions Inc. announced in February 2023 that it will acquire ChemSol Group in Costa Rica, El Salvador, Panama, Guatemala, and Honduras in order to grow its presence in Central America and expand its ingredients and specialties offering. Overall, these advancements become North America as a fastest growing region in chemical distribution market.
Chemical Distribution Market Players
Some of the top chemical distribution companies offered in our report include Wilbur Ellis Holdings, Inc., Brenntag AG, Univar Solutions Inc., Azelis Holding S.A., Solvadis Deutschland GmbH, ICC Industries, Inc., Helm AG, Ter Group, REDA Chemicals, Biesterfeld AG, Stockmeier Group, and Jebsen & Jessen Pte. Ltd.
Frequently Asked Questions
How big is the chemical distribution market?
The chemical distribution market size was valued at USD 274.4 billion in 2023.
What is the CAGR of the global chemical distribution market from 2024 to 2032?
What is the CAGR of the global chemical distribution market from 2024 to 2032?
Which are the key players in the chemical distribution market?
The key players operating in the global market are including Wilbur Ellis Holdings, Inc., Brenntag AG, Univar Solutions Inc., Azelis Holding S.A., Solvadis Deutschland GmbH, ICC Industries, Inc., Helm AG, Ter Group, REDA Chemicals, Biesterfeld AG, Stockmeier Group, and Jebsen & Jessen Pte. Ltd.
Which region dominated the global chemical distribution market share?
Asia Pacific held the dominating position in chemical distribution industry during the analysis period of 2024 to 2032.
Which region registered fastest CAGR from 2024 to 2032?
North America region exhibited fastest growing CAGR for market of chemical distribution during the analysis period of 2024 to 2032.
What are the current trends and dynamics in the global chemical distribution industry?
The current trends and dynamics in the chemical distribution industry include growing demand for specialty chemicals across various industries, increasing industrialization and urbanization in emerging markets, and advancements in chemical distribution logistics and technology
Which product held the maximum share in 2023?
The commodity chemicals as product held the maximum share of the chemical distribution industry.


