Blockchain Supply Chain Market Size - Global Industry, Share, Analysis, Trends and Forecast 2023 - 2032
Published :
Report ID:
Pages :
Format :
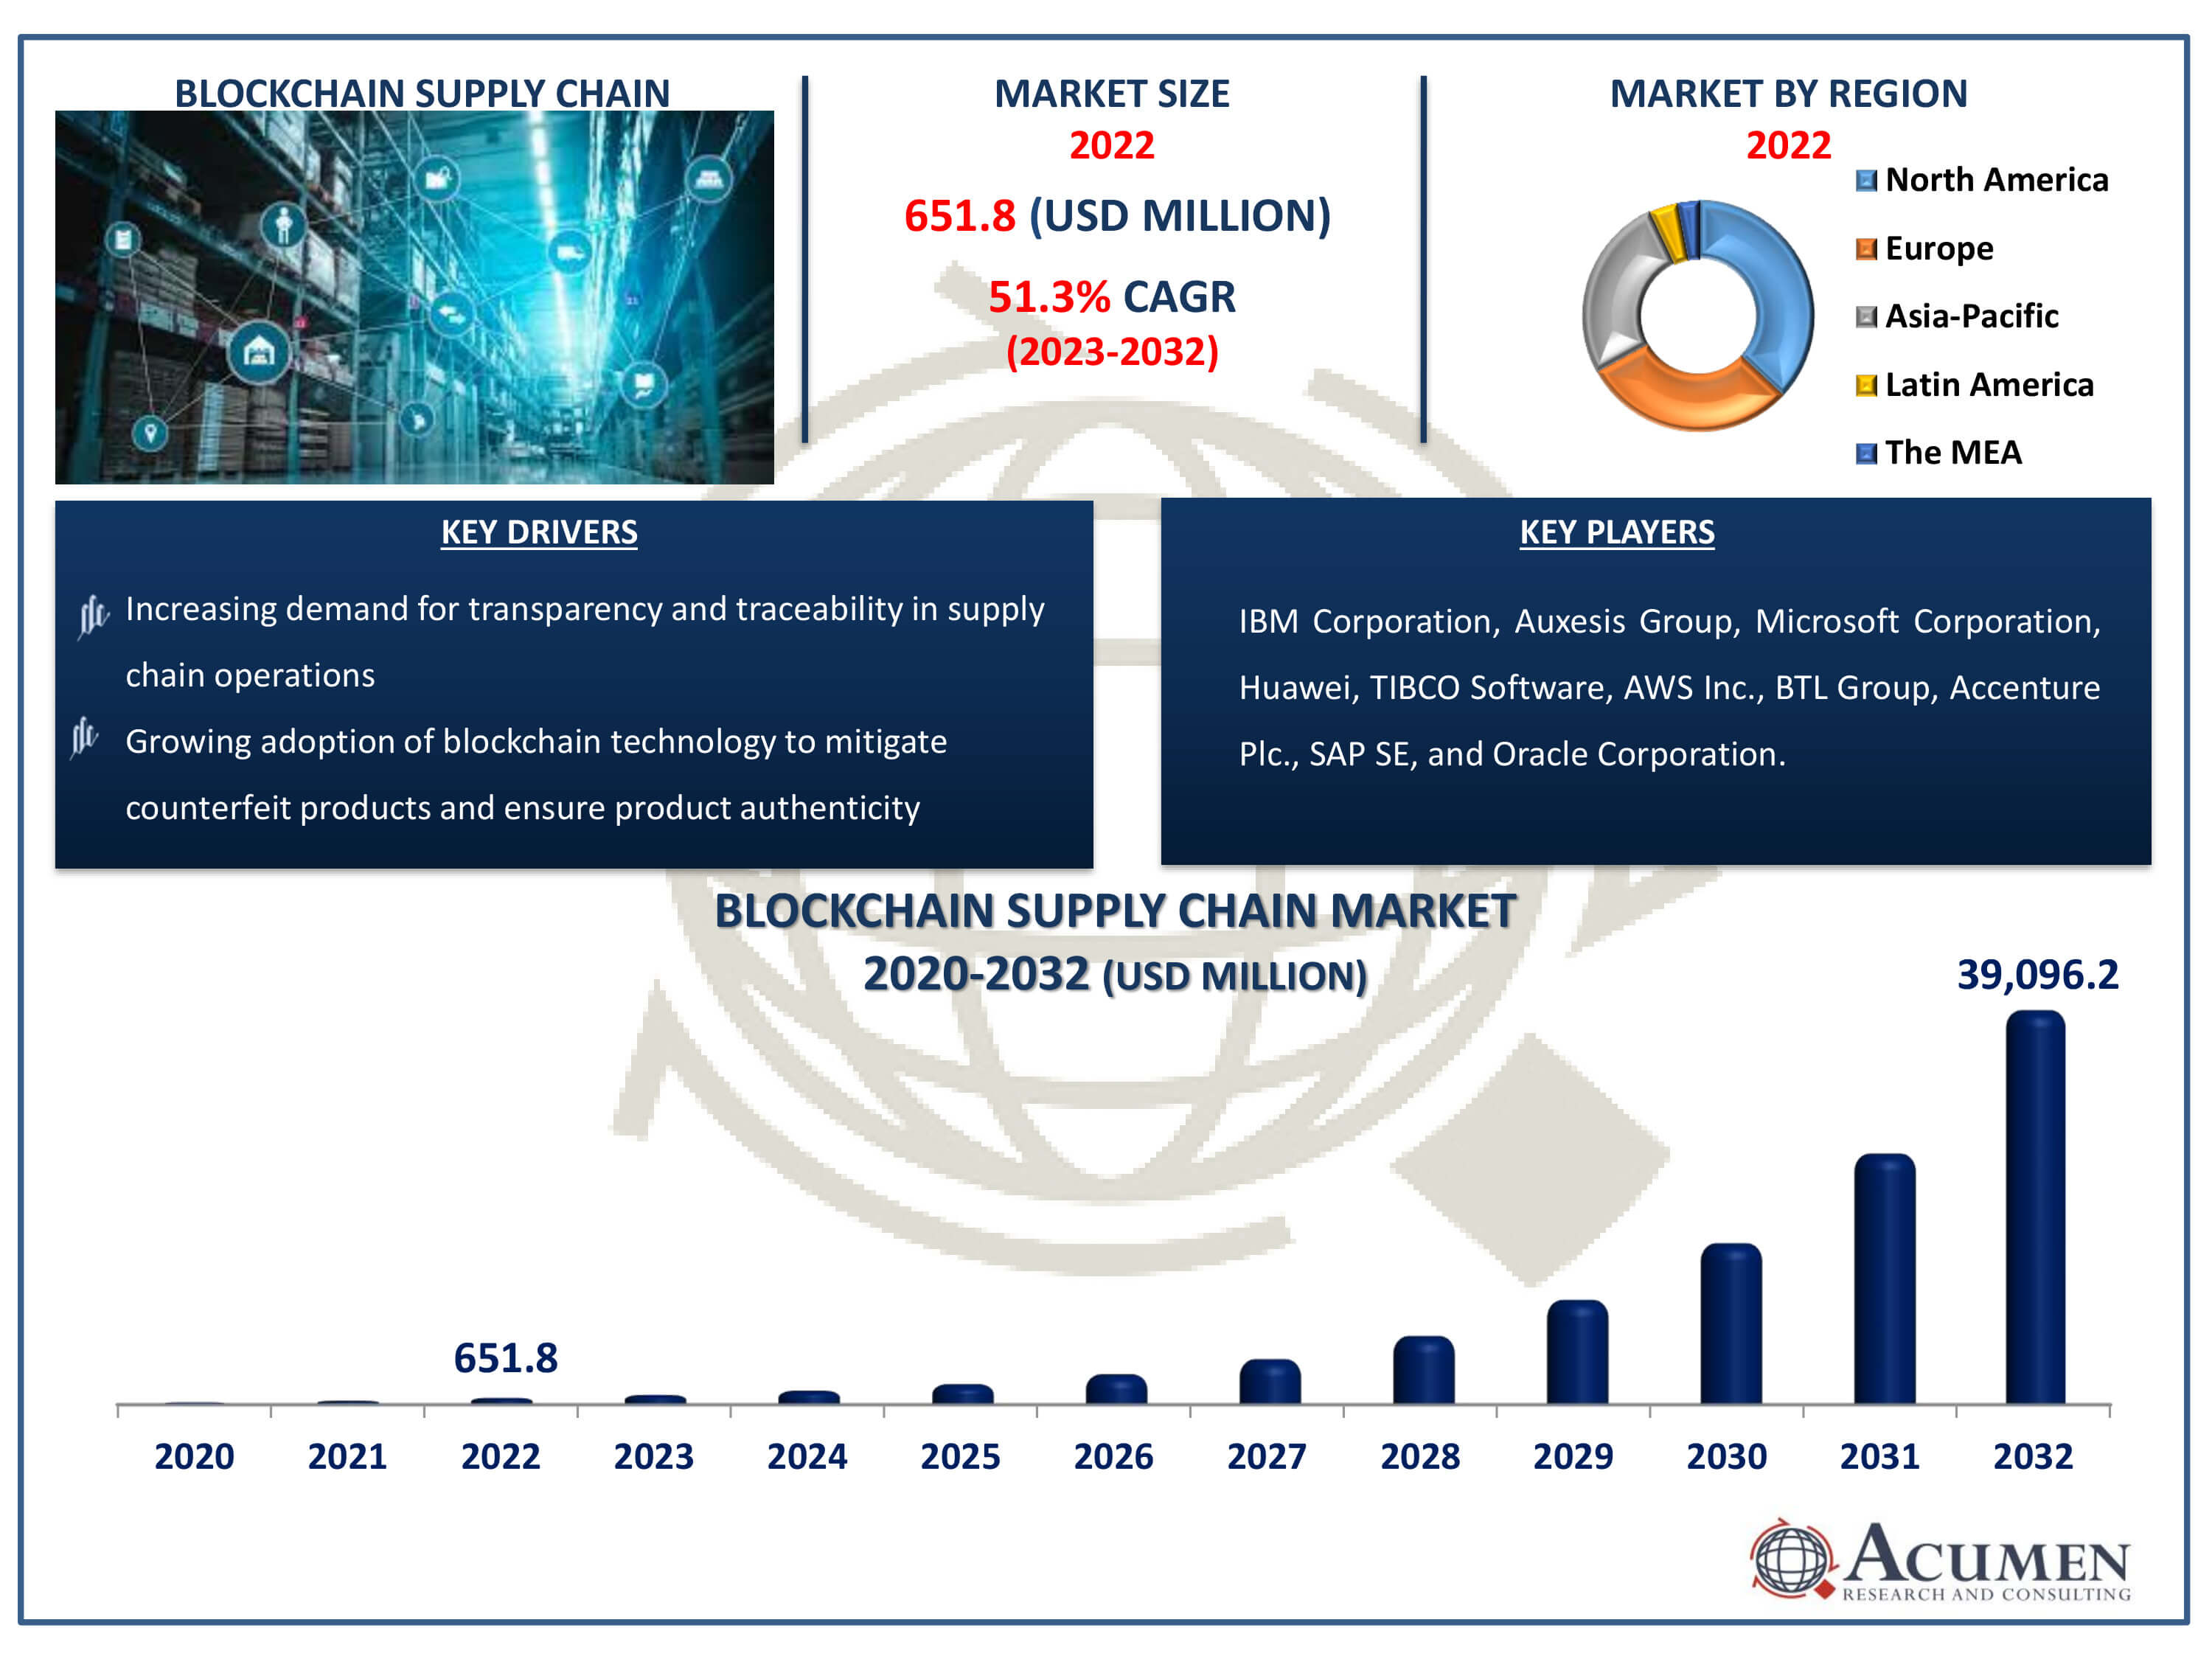
The Blockchain Supply Chain Market Size accounted for USD 651.8 Million in 2022 and is estimated to achieve a market size of USD 39,096.2 Million by 2032 growing at a CAGR of 51.3% from 2023 to 2032.
Blockchain Supply Chain Market Highlights
- Global blockchain supply chain market revenue is poised to garner USD 39,096.2 million by 2032 with a CAGR of 51.3% from 2023 to 2032
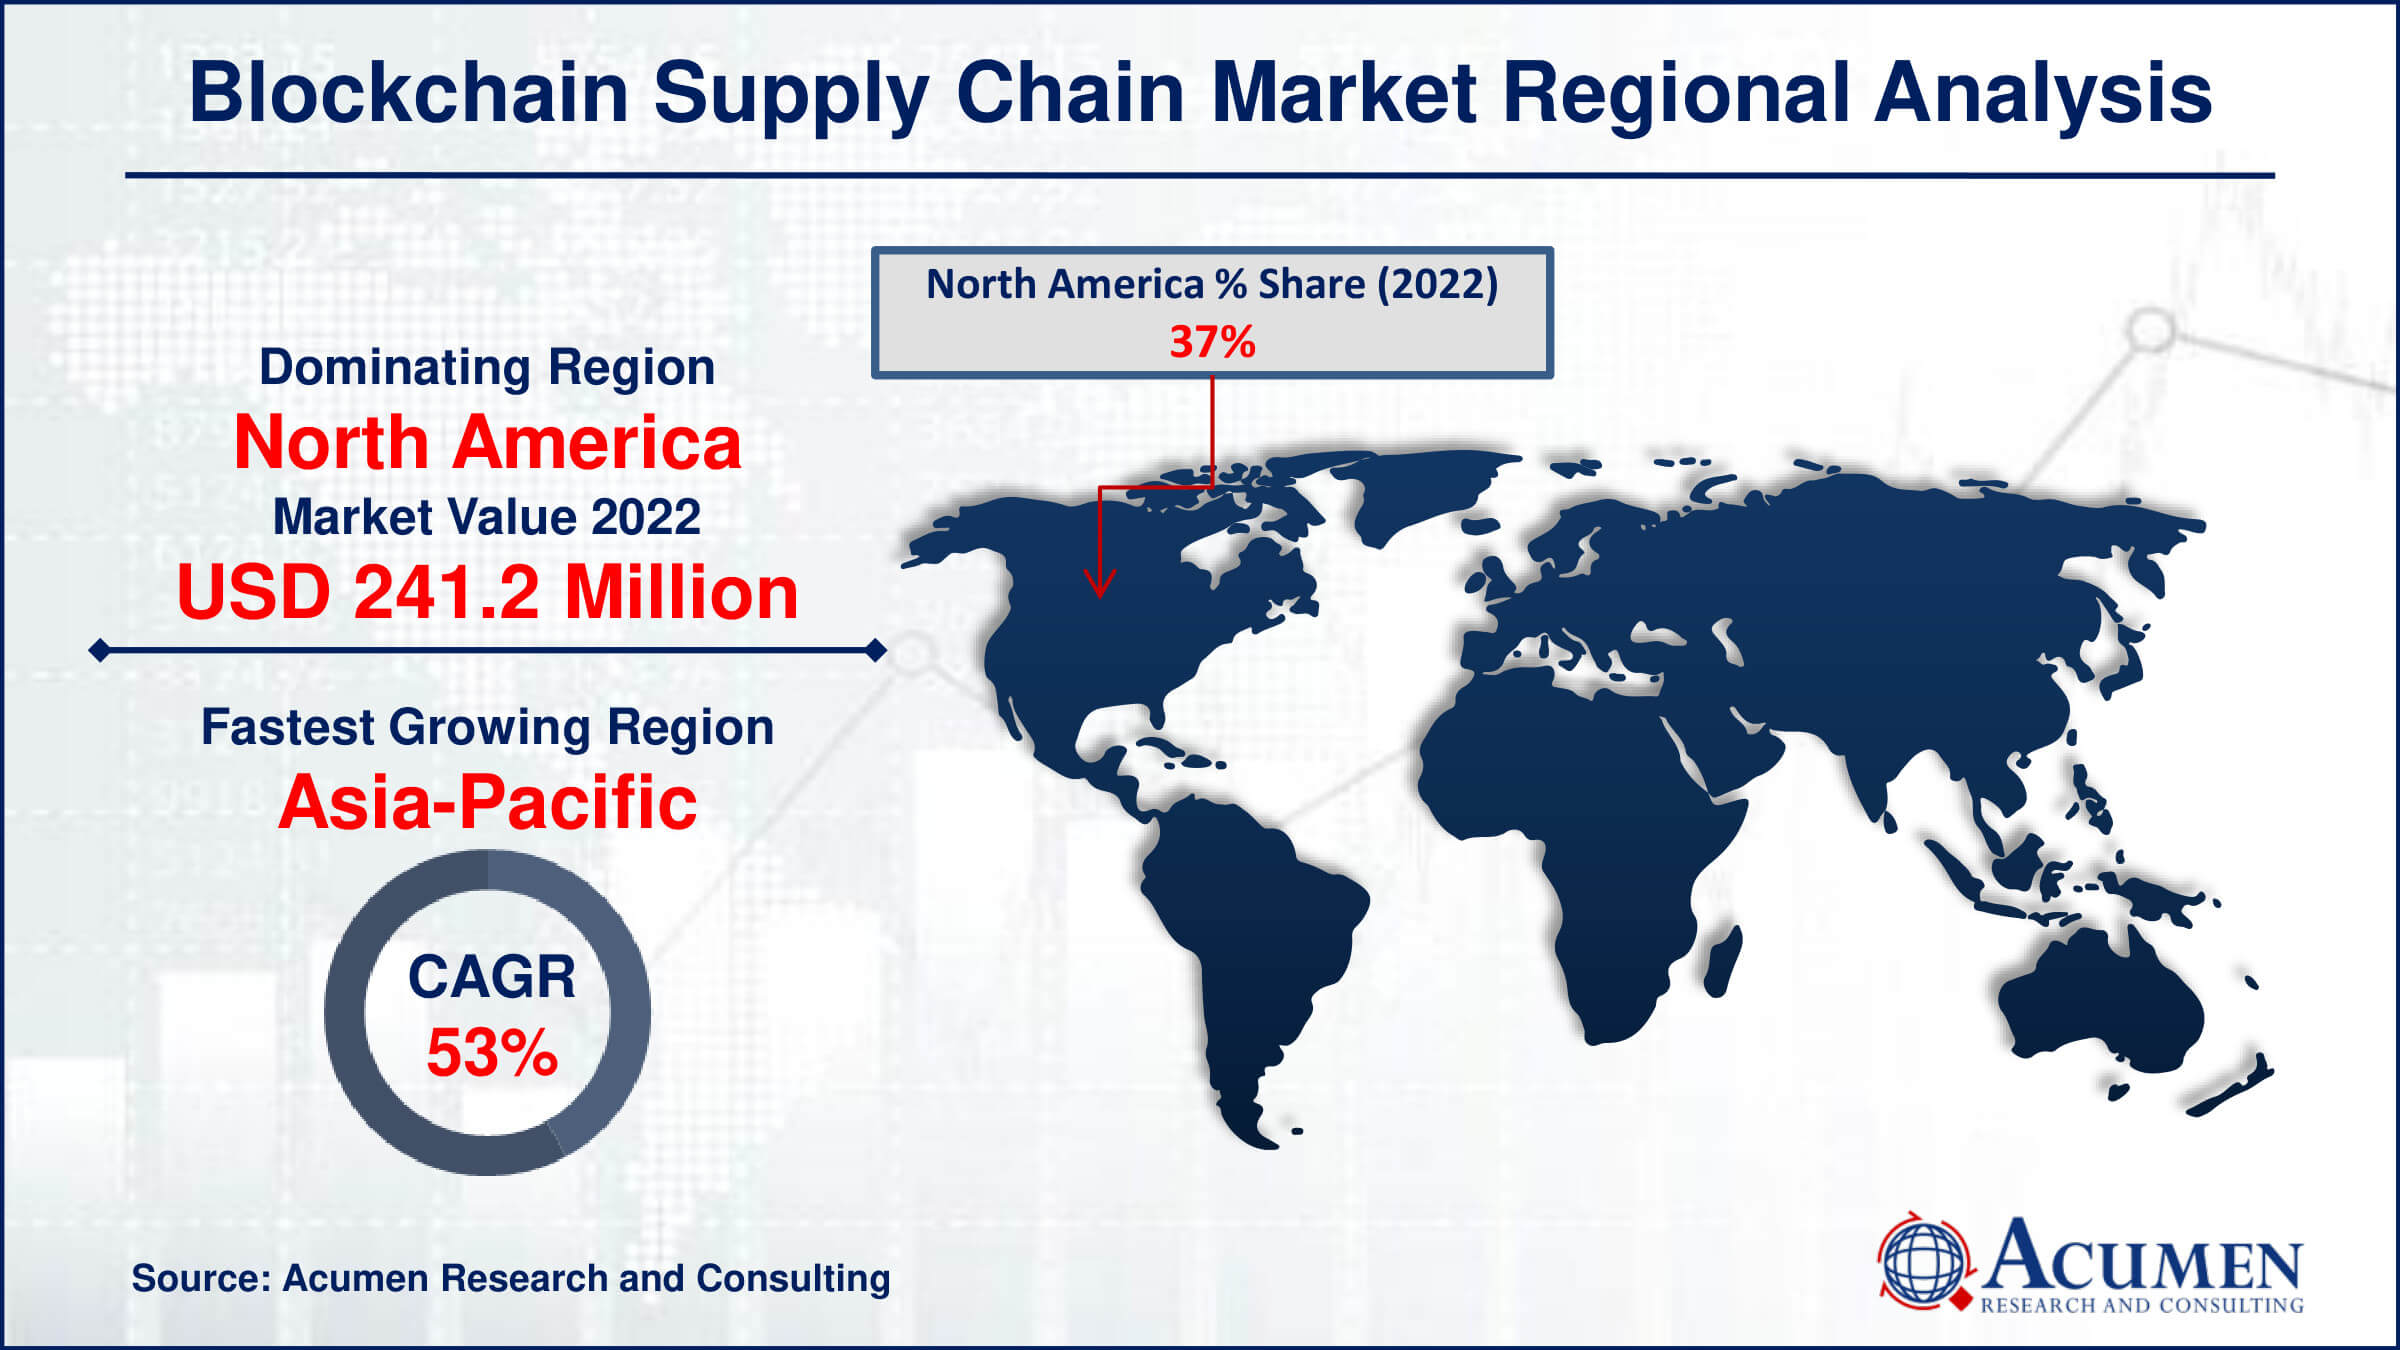
- North America blockchain supply chain market value occupied around USD 241.1 million in 2022
- Asia-Pacific blockchain supply chain market growth will record a CAGR of more than 53% from 2023 to 2032
- Among component, the platform sub-segment generated over US$ 417.1 million revenue in 2022
- Based on industry vertical, the retail and consumer goods sub-segment generated around 20% share in 2022
- Blockchain supply chain finance solutions streamline payments and enhance liquidity is a popular blockchain supply chain market trend that fuels the industry demand

Blockchain is a distributed digital ledger that records transactions in a series of blocks. It exists in multiple copies, spread across multiple computers termed as nodes. Real-time tracking of products such as equipment, consumer goods, food products, or digital offerings is facilitated in a supply chain with the help of blockchain. Payments can be processed by customers and suppliers within the supply chain using cryptocurrency. Additionally, the ledger is secured because each new block of the transaction is linked back to the previous block, making tampering practically impossible.
Global Blockchain Supply Chain Market Dynamics
Market Drivers
- Increasing demand for transparency and traceability in supply chain operations
- Growing adoption of blockchain technology to mitigate counterfeit products and ensure product authenticity
- Rising need for efficient and secure data management across supply chain networks
- Emergence of smart contracts and automation capabilities enhancing supply chain efficiency
Market Restraints
- Lack of regulatory standards and interoperability issues across blockchain platforms
- Concerns regarding data privacy and security in decentralized blockchain networks
- Limited scalability and transaction throughput of existing blockchain solutions
Market Opportunities
- Integration of internet of things (IoT) devices with blockchain for real-time monitoring and tracking in supply chains
- Expansion of blockchain applications in emerging markets and industries
- Collaboration among industry players to develop standardized blockchain solutions
Blockchain Supply Chain Market Report Coverage
| Market | Blockchain Supply Chain Market |
| Blockchain Supply Chain Market Size 2022 | USD 651.8 Million |
| Blockchain Supply Chain Market Forecast 2032 | USD 39,096.2 Million |
| Blockchain Supply Chain Market CAGR During 2023 - 2032 | 51.3% |
| Blockchain Supply Chain Market Analysis Period | 2020 - 2032 |
| Blockchain Supply Chain Market Base Year |
2022 |
| Blockchain Supply Chain Market Forecast Data | 2023 - 2032 |
| Segments Covered | By Component, By Application, By Industry Vertical, And By Geography |
| Regional Scope | North America, Europe, Asia Pacific, Latin America, and Middle East & Africa |
| Key Companies Profiled | IBM Corporation, Auxesis Group, Microsoft Corporation, Huawei, TIBCO Software, AWS Inc., BTL Group, Accenture Plc., SAP SE, and Oracle Corporation. |
| Report Coverage |
Market Trends, Drivers, Restraints, Competitive Analysis, Player Profiling, Covid-19 Analysis, Regulation Analysis |
Blockchain Supply Chain Market Insights
The rising emphasis on supply chain transparency and security is a key driver of market value. In addition to the benefits previously mentioned, blockchain supply chain technology offers enhanced data integrity, interoperability, and scalability, further bolstering its market value. Additionally, the increasing adoption of digital supply chain platforms and the rise of decentralized finance (DeFi) solutions are expected to fuel market growth. Moreover, the integration of blockchain and IoT presents opportunities for real-time supply chain monitoring, predictive analytics, and personalized customer experiences. By leveraging IoT-generated data, stakeholders can optimize inventory management, enhance product lifecycle management, and mitigate supply chain risks. This convergence of blockchain and IoT technologies not only enhances operational efficiency but also enables sustainable practices and ethical sourcing throughout the supply chain. As businesses prioritize agility and resilience in the face of global disruptions, the demand for blockchain-enabled supply chain solutions is poised for continued growth and innovation.
The blockchain supply chain business also has potential due to its interaction with the Internet of Things (IoT). Temperature, humidity, location, and the state of the items are just a few of the variables on the supply chain that may be tracked and transmitted in real time by IoT devices like sensors and RFID tags. Stakeholders can establish unchangeable records of product provenance, quality, and compliance along the supply chain by fusing blockchain technology with IoT-generated data. This connectivity allows for proactive risk management, faster decision-making, and improved supply chain visibility. For instance, blockchain-IoT integration can improve product safety and authenticity, reduce the danger of counterfeiting, and guarantee regulatory compliance in sectors like food and medicines. The potential for blockchain and IoT to work together to change supply chain management and create value for both businesses and customers is strong as IoT adoption spreads throughout industries.
Blockchain Supply Chain Market Segmentation
The worldwide market for blockchain supply chain is split based on component, application, industry vertical, and geography.
Blockchain Supply Chain Components
- Platform
- Services
According to blockchain supply chain industry analysis, With 64% the platform component leads the market. The fundamental infrastructure and technologies that support blockchain-based supply chain solutions are included in this section. Blockchain platforms facilitate the safe, transparent, and unchangeable recording of transactions and data throughout the supply chain network by providing decentralised ledgers, smart contracts, and consensus processes. These platforms are the foundation for many supply chain applications, such as digital identification, provenance tracking, and traceability. Businesses may improve supply chain visibility, reduce risks, and streamline operations all of which contribute to increased efficiency and agility by utilizing blockchain technologies. Furthermore, cooperation among stakeholders and smooth integration with current supply chain systems are made possible by the scalability and interoperability of blockchain platforms. Because of this, the Platform segment dominates the blockchain supply chain market, propelling innovation and digital transformation in a variety of sectors.
Blockchain Supply Chain Applications
- Payment & Settlement
- Counterfeit Detection
- Product Traceability
- Smart contracts
- Risk & Compliance Management
- Others (Documentation and Rewards Management)
The payment & settlement application is the largest segment in the market and it is expected to grow over the blockchain supply chain industry forecast period, holding a majority of the market share. The revolutionary potential of blockchain technology to change financial transactions and supply chain settlement procedures is what propels this domination. Blockchain removes middlemen and lowers transaction costs by enabling peer-to-peer transactions that are safe, transparent, and almost immediate. Furthermore, its unchangeable ledger reduces the possibility of fraud and mistakes in payment and settlement processes by guaranteeing data integrity and auditability. Furthermore, the decentralised structure of blockchain promotes efficiency and collaboration by improving transparency and trust among supply chain actors. Organisations can decrease administrative overhead, expedite transaction speed, and streamline financial operations by utilizing blockchain technology for payment and settlement. This efficiency picks up steam in a variety of industries, including retail and manufacturing, which helps explain why the Payment & Settlement segment leads the blockchain supply chain market and propels supply chain finance's digital transformation.
Blockchain Supply Chain Industry Verticals
- Retail and Consumer Goods
- Healthcare and Life Sciences
- Oil & gas
- Manufacturing
- Logistics
- Others (Construction and Agriculture)
With a sizeable market share, the retail and consumer goods sector stands out as the biggest industry vertical in the blockchain supply chain market. The industry's extensive and intricate supply chains are to blame for this domination, as is the growing demand from customers for authenticity and transparency in the source and delivery of products. Blockchain technology allows for real-time product tracking from manufacturing to distribution and retail shelves, providing unmatched visibility and traceability throughout the retail and consumer goods supply chain. Retailers and consumer goods companies may increase supply chain efficiency, reduce the risk of counterfeit products, and improve inventory management by utilising blockchain technology. Additionally, blockchain builds connections of collaboration and regulatory compliance by facilitating direct communication and trust among parties.
Blockchain Supply Chain Market Regional Outlook
North America
- U.S.
- Canada
Europe
- U.K.
- Germany
- France
- Spain
- Rest of Europe
Asia-Pacific
- India
- Japan
- China
- Australia
- South Korea
- Rest of Asia-Pacific
Latin America
- Brazil
- Mexico
- Rest of Latin America
The Middle East & Africa
- South Africa
- GCC Countries
- Rest of the Middle East & Africa (ME&A)

Blockchain Supply Chain Market Regional Analysis
North America is the market leader in the blockchain supply chain space, holding a sizable share and expected to continue dominating the field for the duration of the forecast. Numerous factors, most notably its strong broadband infrastructure and the spread of major market players throughout the region, are responsible for its dominance. As two of the biggest economies in North America, the United States and Canada are essential to maintaining the region's market value.
Furthermore, the Asia Pacific region will grow at the fastest rate blockchain supply chain market forecast period between 2023 and 2032. The region's growing acceptance of blockchain technology across a range of industries, growing digitalization initiatives, and a developing entrepreneurial ecosystem are some of the factors contributing to this spike. Asia Pacific nations, including China, Japan, India, and South Korea, are accelerating their economic trajectory by implementing blockchain technologies in their supply chain management procedures.
Blockchain Supply Chain Market Players
Some of the top blockchain supply chain companies offered in our report includes IBM Corporation, Auxesis Group, Microsoft Corporation, Huawei, TIBCO Software, AWS Inc., BTL Group, Accenture Plc., SAP SE, and Oracle Corporation.
Frequently Asked Questions
How big is the blockchain supply chain market?
The blockchain supply chain market size was valued at USD 651.8 million in 2022.
What is the CAGR of the global blockchain supply chain market from 2023 to 2032?
The CAGR of blockchain supply chain is 51.3% during the analysis period of 2023 to 2032.
Which are the key players in the blockchain supply chain market?
The key players operating in the global market are including IBM Corporation, Auxesis Group, Microsoft Corporation, Huawei, TIBCO Software, AWS Inc., BTL Group, Accenture Plc., SAP SE, and Oracle Corporation.
Which region dominated the global blockchain supply chain market share?
North America held the dominating position in blockchain supply chain industry during the analysis period of 2023 to 2032.
Which region registered fastest CAGR from 2023 to 2032?
Asia-Pacific region exhibited fastest growing CAGR for market of blockchain supply chain during the analysis period of 2023 to 2032.
What are the current trends and dynamics in the global blockchain supply chain industry?
The current trends and dynamics in the blockchain supply chain industry include increasing demand for transparency and traceability in supply chain operations, growing adoption of blockchain technology to mitigate counterfeit products and ensure product authenticity, rising need for efficient and secure data management across supply chain networks, and emergence of smart contracts and automation capabilities enhancing supply chain efficiency.
Which component held the maximum share in 2022?
The platform component held the maximum share of the blockchain supply chain industry.


