Beverage Container Market Size - Global Industry, Share, Analysis, Trends and Forecast 2023 - 2032
Published :
Report ID:
Pages :
Format :
Beverage Container Market Size - Global Industry, Share, Analysis, Trends and Forecast 2023 - 2032
Report Coverage
- Industry Dynamics
- Market Size and Forecast Data
- Segment Analysis
- Competitive Landscape
- Regional Analysis with a Niche Focus on Country-Level Data
- High Level Analysis - Porter's, PESTEL, Value Chain, etc.
- Company Profiles of Key Players
- Option to Customize the Report As Per Your Specific Need
Request Sample Report
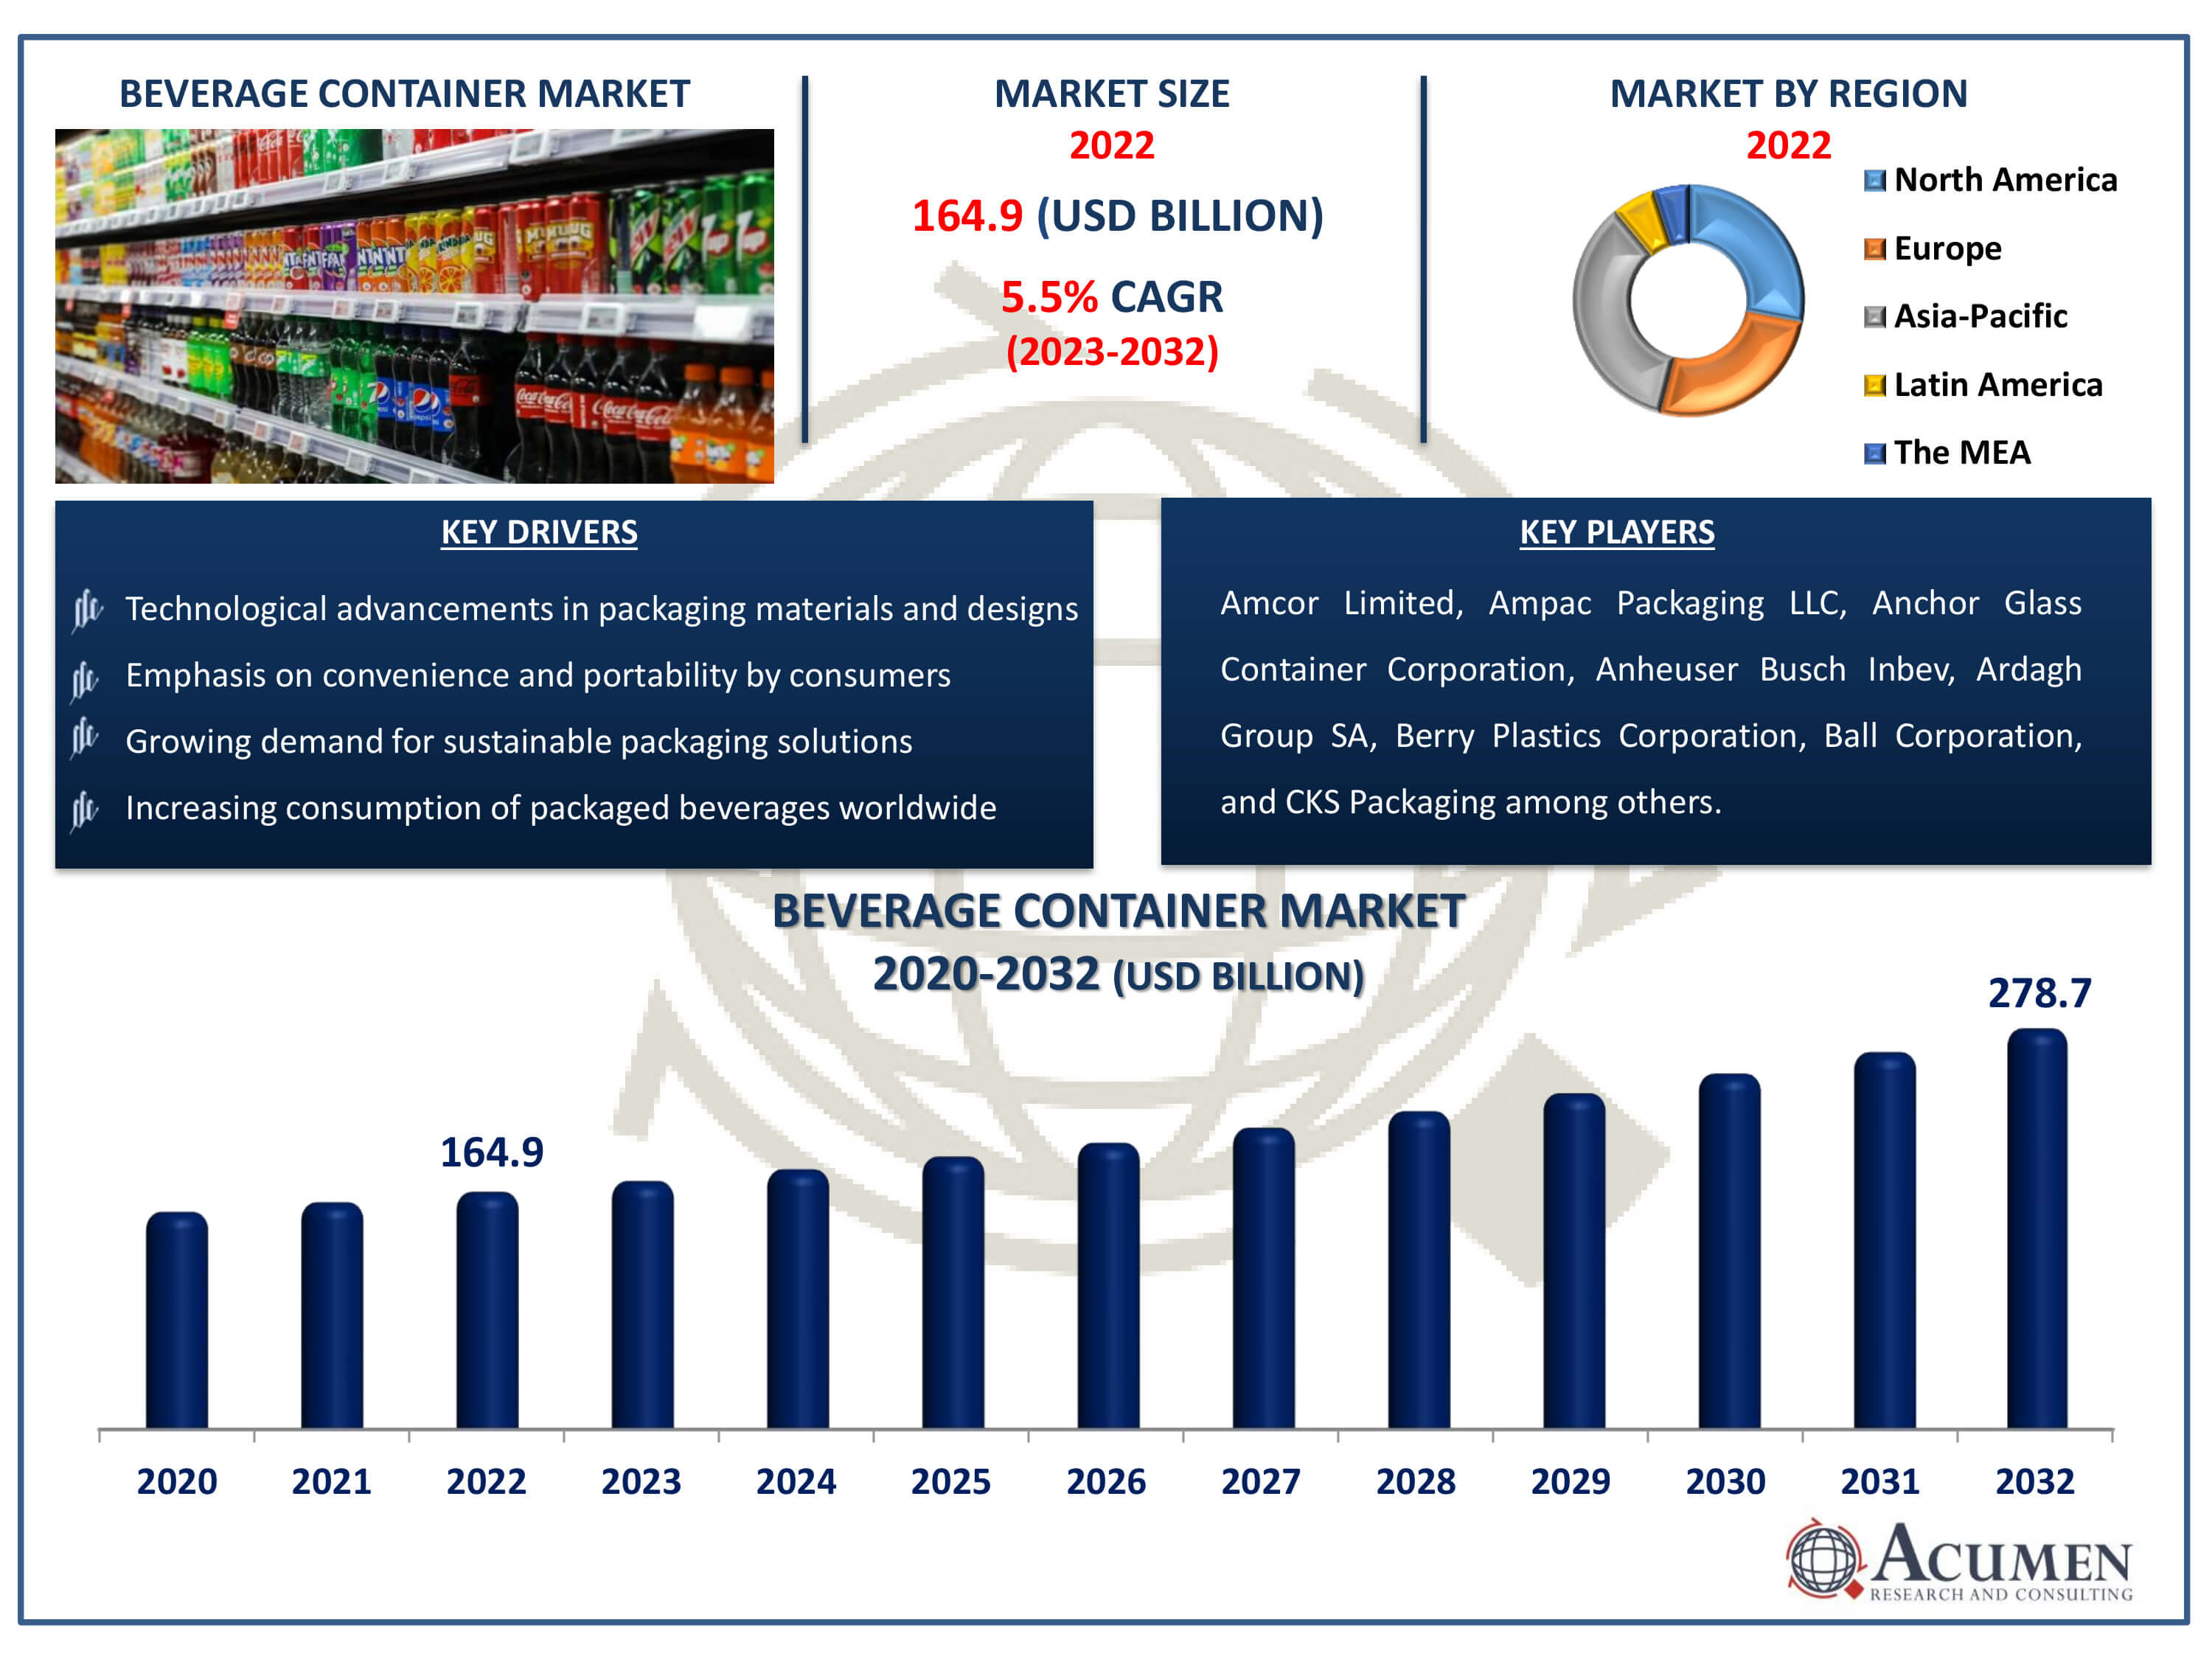
The Beverage Container Market Size accounted for USD 164.9 Billion in 2022 and is estimated to achieve a market size of USD 278.7 Billion by 2032 growing at a CAGR of 5.5% from 2023 to 2032.
Beverage Container Market Highlights
- Global beverage container market revenue is poised to garner USD 278.7 billion by 2032 with a CAGR of 5.5% from 2023 to 2032
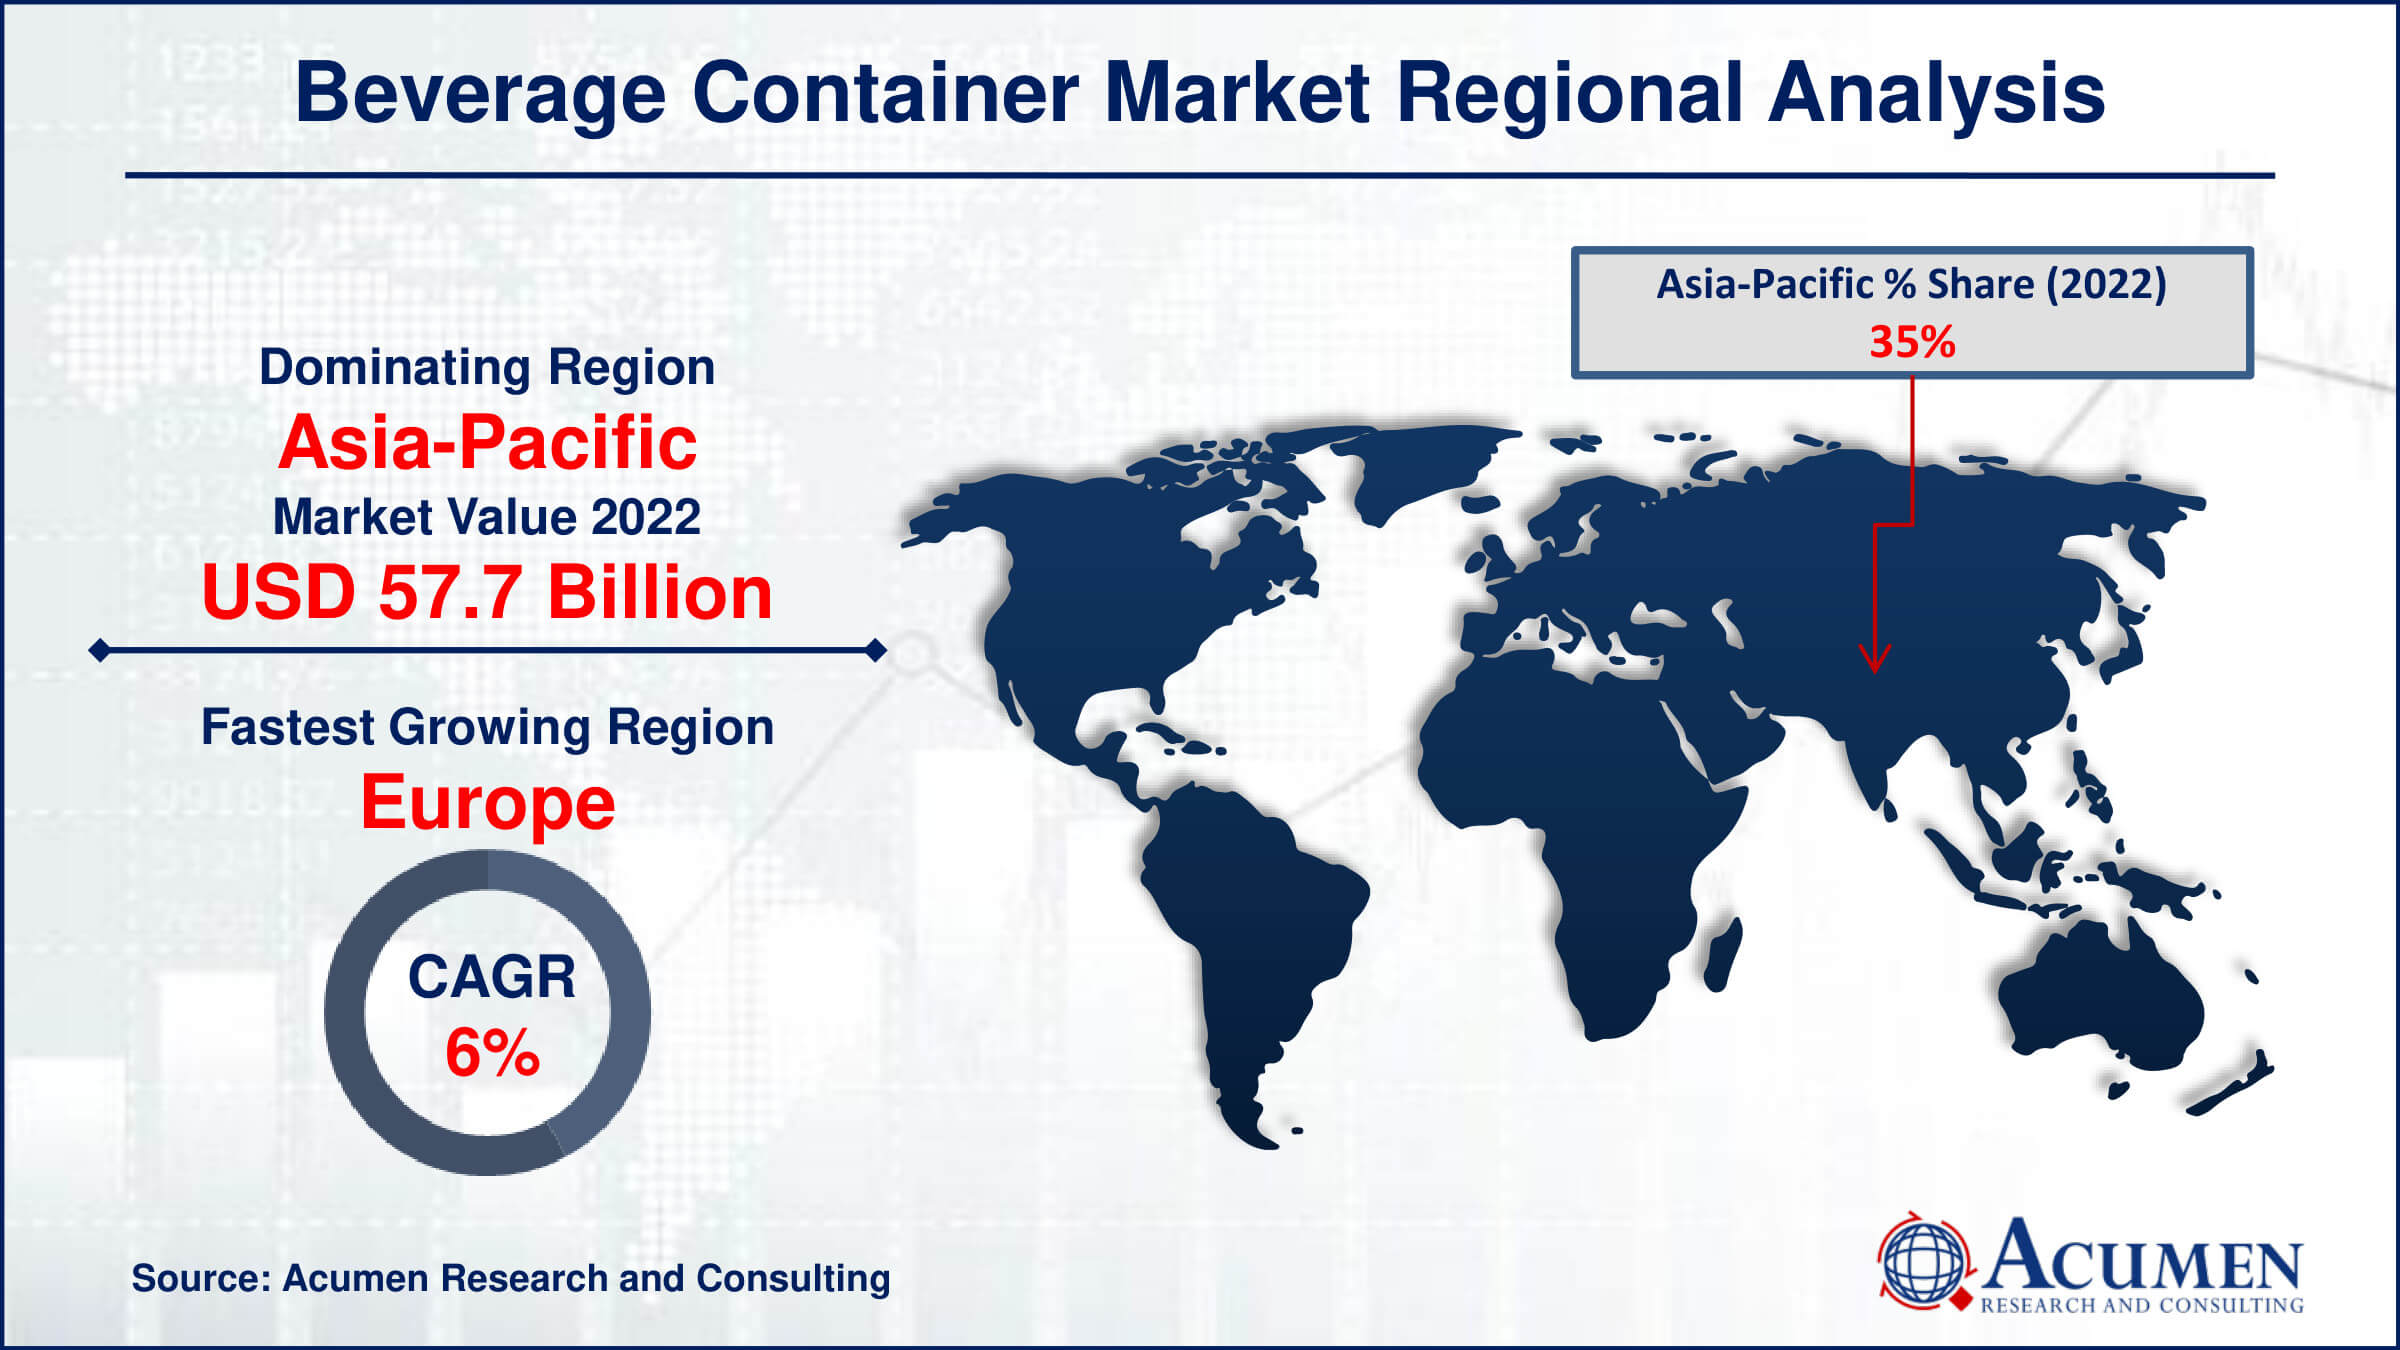
- Asia-Pacific beverage container market value occupied around USD 57.7 billion in 2022
- Europe beverage container market growth will record a CAGR of more than 6% from 2023 to 2032
- Among container type, the jars & bottles sub-segment generated more than USD 66 billion revenue in 2022
- Based on application, the non-alcoholic beverages sub-segment generated around 55% market share in 2022
- Customization and personalization of packaging to cater to niche consumer segments is a popular beverage container market trend that fuels the industry demand

Rapid technological developments and innovations across the packaging industry are driving the global market for beverage containers. However, several anticipated changes are expected to transform the beverage packaging industry. Geopolitical scenarios and shifts in consumer purchasing patterns have hindered market players from fully capitalizing on market movements. To enhance beverage quality, consumer acceptability, and security, the development of intelligent packaging solutions that can interact with the product or environment will be crucial factors in the global market.
Global Beverage Container Market Dynamics
Market Drivers
- Growing demand for sustainable packaging solutions
- Increasing consumption of packaged beverages worldwide
- Technological advancements in packaging materials and designs
- Emphasis on convenience and portability by consumers
Market Restraints
- Stringent regulations regarding plastic usage and waste management
- Fluctuating raw material prices impacting production costs
- Competition from alternative beverage packaging formats like pouches and cartons
Market Opportunities
- Expansion into emerging markets with rising disposable incomes
- Development of eco-friendly and biodegradable packaging options
- Adoption of smart packaging technologies for enhanced consumer engagement
Beverage Container Market Report Coverage
| Market | Beverage Container Market |
| Beverage Container Market Size 2022 | USD 164.9 Billion |
| Beverage Container Market Forecast 2032 | USD 278.7 Billion |
| Beverage Container Market CAGR During 2023 - 2032 | 5.5% |
| Beverage Container Market Analysis Period | 2020 - 2032 |
| Beverage Container Market Base Year |
2022 |
| Beverage Container Market Forecast Data | 2023 - 2032 |
| Segments Covered | By Material, By Container Type, By Application, And By Geography |
| Regional Scope | North America, Europe, Asia Pacific, Latin America, and Middle East & Africa |
| Key Companies Profiled | Amcor Limited, Ampac Packaging LLC, Anchor Glass Container Corporation, Anheuser Busch Inbev, Ardagh Group SA, Berry Plastics Corporation, Ball Corporation, CKS Packaging, CCL Industries Incorporated, Altium Packaging, Crown Holdings Incorporated, and Evergreen Packaging LLC. |
| Report Coverage |
Market Trends, Drivers, Restraints, Competitive Analysis, Player Profiling, Covid-19 Analysis, Regulation Analysis |
Beverage Container Market Insights
The beverage container market is expected to grow due to evolving consumer preferences for single-use containers, alongside continual changes in the food industry landscape. The demand surge can be attributed to container characteristics such as external protection, product support, and resistance to handling. The proliferation of cans and flasks enhances the aesthetic appeal of various drinks, including fruit juices, sports and energy drinks, and increased water consumption, thereby fostering enterprise growth. Aggressive marketing campaigns and new product launches are also anticipated to drive industry growth over the beverage container industry forecast period.
Changing consumer preferences have led to the adoption of new container materials for aroma retention, strength enhancement, thermal stability, moisture protection, and recyclability. Increased demand for flexible small containers presents new avenues for business expansion. Incorporating new packaging techniques will further accelerate market momentum. Aseptic beverage packaging, for instance, has witnessed high demand in the beverage industry as it extends product shelf life while preserving nutritional and organoleptic properties.
Beverage manufacturers should prioritize aesthetically pleasing beverage packaging to attract consumer attention. Recyclable container materials such as aluminum and PET have been the preferred choice of manufacturers in recent years for packaging drinks. Plant-based materials have also gained popularity among beverage producers to reduce their carbon footprint. For example, So Delicious introduced a 48-ounce bioplastic flask in June 2018, offering similar benefits to traditional packaging while ensuring recyclability, to launch their organic almond milk.
Growing concerns about plastic use and the risk of metal particle contamination have prompted manufacturers to adopt paperboards for various beverage packaging applications. For instance, WestRock company announced plans to launch paperboards to package its energy drink product line. The industry landscape is expected to undergo significant changes due to favorable policies and standards governing the use of packaging materials. For instance, the FDA regulates packaging materials under Section 409 of the Federal Food, Drug, and Cosmetic Act to mitigate any adverse effects on food products.
Stringent environmental regulations are anticipated to impede industry growth. Directives such as "Directive 94/62/EC on packaging waste from the European Parliament and the Council" mandate that manufacturers take appropriate steps to mitigate industrial waste and improve recyclability. Challenges such as declining market sales of soft drinks and alcohol in recent years, along with sluggish growth in other soft drink markets over the last five years, have also hindered market development.
Beverage Container Market Segmentation
The worldwide market for beverage container is split based on material, container type, application, and geography.
Beverage Container Materials
- Plastic
- Paperboard
- Glass
- Metal
According to beverage container industry analysis, the glass subsegment emerges as one of the fastest-growing segments. Its ability to preserve the strength, aroma, and flavors of beverages makes it the preferred choice, particularly in the alcohol sector. Glass is 100% recyclable, making it an environmentally desirable packaging option. Recycling six tons of glass indirectly saves six tons and reduces CO2 emissions by one ton. Additionally, glass is odorless, chemically inert, and resistant to gas and vapor.
The paperboard segment offers advantages such as lightweight, low cost, easy handling, high strength-to-weight ratios, and recyclability. This material has expanded its environmental appeal across various beverage categories, including fruits, caffeine, energy drinks, and carbonated beverages. Increasing emphasis on recycling materials, along with improved flexibility and packaging presentation, has bolstered the use of paperboard across numerous beverage packaging segments.
Beverage Container Types
- Jars & Bottles
- Cans
- Cartons
- Pouches
- Bag-In-Boxes
The jars and bottles segment dominates the beverage container market, primarily due to its widespread usage across various beverage categories. These containers offer versatility, durability, and aesthetic appeal, making them the preferred choice for packaging juices, soft drinks, alcoholic beverages, and more. Their rigid structure provides excellent protection for the product, preserving its freshness and quality. Additionally, jars and bottles are favored by consumers for their convenience and reusability, aligning with growing sustainability concerns. With their ability to cater to diverse consumer preferences and product types, the jars and bottles segment remains the largest and most influential category in the beverage container market.
Beverage Container Applications
- Non-Alcoholic Beverages
- Carbonated Soft Drinks
- Dairy
- Juices
- Bottled Water
- Sports Drinks
- Alcoholic Beverages
- Wine
- Beer
- Spirit
The consumption of non-alcoholic beverages is expected to increase by more than 5% throughout 2023 to 2032. The rising popularity of non-alcoholic beverages such as energy drinks and fruit juices will contribute to the overall growth of the beverage container market. Customers' preference for attractive and sustainable packaging options for their beverages is expected to enhance product penetration in this segment. Moreover, increased consumer awareness of sustainable materials has prompted producers to use organic materials for packing their beverages, further boosting industry growth over the beverage container market forecast period.
Around 45% of the overall beverage container market comprises containers for alcoholic beverages, which play a crucial role in promoting alcohol brands. The segment's growth is driven by two key factors: the increasing global consumption of alcoholic beverages and a focus on recycling. Main industries are developing containers to preserve alcohol properties for longer periods, leading to a rise in demand for sustainable materials to promote the market for drink containers.
Beverage Container Market Regional Outlook
North America
- U.S.
- Canada
Europe
- U.K.
- Germany
- France
- Spain
- Rest of Europe
Asia-Pacific
- India
- Japan
- China
- Australia
- South Korea
- Rest of Asia-Pacific
Latin America
- Brazil
- Mexico
- Rest of Latin America
The Middle East & Africa
- South Africa
- GCC Countries
- Rest of the Middle East & Africa (ME&A)

Beverage Container Market Regional Analysis
Asia-Pacific is the largest region in the market and expected to experience growth. The current consumer preferences, coupled with this high growth rate, are driving the beverage container market in the region, including countries such as China, India, and Indonesia. The demand for glass bottles from the alcoholic beverage industry is particularly high, contributing to the overall industry growth. Meanwhile, the increase in non-alcoholic beverage containers is primarily driven by the growing consumption of fruits and packaged water.
In the overall beverage container market, Europe accounts for more than 26 percent. The rapid availability of improved production facilities and low-cost natural resources are expected to drive market growth. However, factors such as changing consumer preferences and the need for extended beverage shelf life also play a significant role. Government regulations, including bans on certain materials used in container manufacturing, may impose costs on producers, hindering market growth."
Beverage Container Market Players
Some of the top beverage container companies offered in our report includes Amcor Limited, Ampac Packaging LLC, Anchor Glass Container Corporation, Anheuser Busch Inbev, Ardagh Group SA, Berry Plastics Corporation, Ball Corporation, CKS Packaging, CCL Industries Incorporated, Altium Packaging, Crown Holdings Incorporated, and Evergreen Packaging LLC.
Frequently Asked Questions
How big is the beverage container market?
The beverage container market size was valued at USD 164.9 billion in 2022.
What is the CAGR of the global beverage container market from 2023 to 2032?
The CAGR of beverage container is 5.5% during the analysis period of 2023 to 2032.
Which are the key players in the beverage container market?
The key players operating in the global market are including Amcor Limited, Ampac Packaging LLC, Anchor Glass Container Corporation, Anheuser Busch Inbev, Ardagh Group SA, Berry Plastics Corporation, Ball Corporation, CKS Packaging, CCL Industries Incorporated, Altium Packaging, Crown Holdings Incorporated, and Evergreen Packaging LLC.
Which region dominated the global beverage container market share?
Asia-Pacific held the dominating position in beverage container industry during the analysis period of 2023 to 2032.
Which region registered fastest CAGR from 2023 to 2032?
Europe region exhibited fastest growing CAGR for market of beverage container during the analysis period of 2023 to 2032.
What are the current trends and dynamics in the global beverage container industry?
The current trends and dynamics in the beverage container industry include growing demand for sustainable packaging solutions, increasing consumption of packaged beverages worldwide, technological advancements in packaging materials and designs, and emphasis on convenience and portability by consumers.
Which container type held the maximum share in 2022?
The jars & bottles container type held the maximum share of the beverage container industry.


